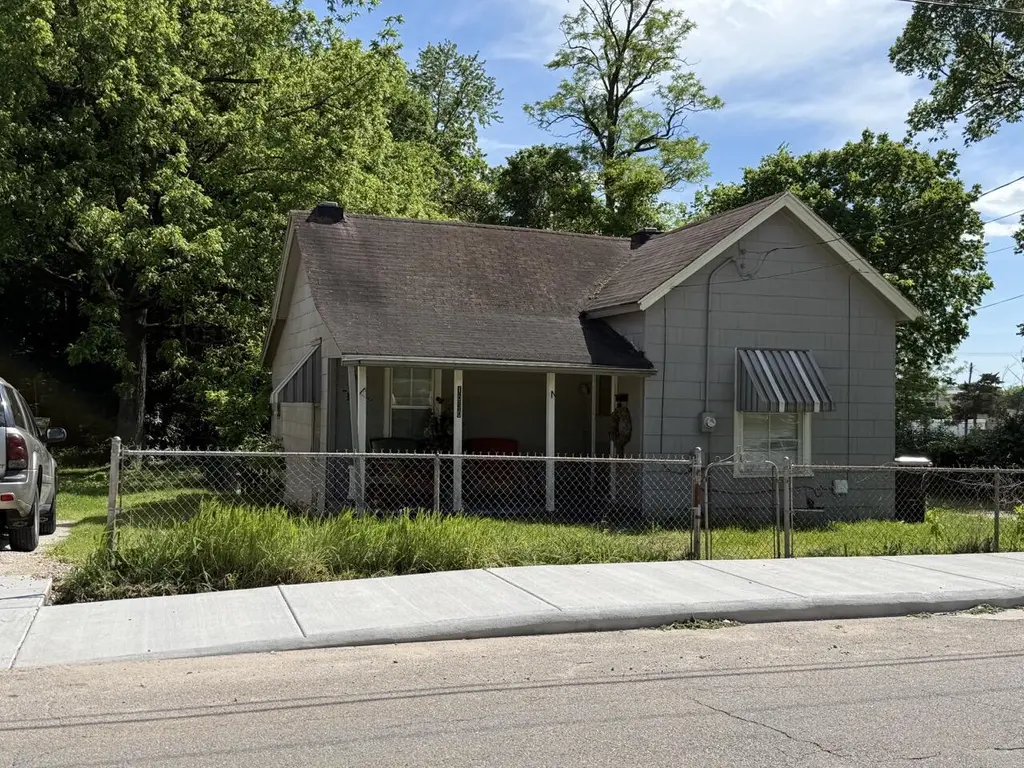
1030 W Nichols St · Springfield, MO
Flood risk 7/10 · Major
- FEMA flood zone
- X (unshaded)
- Chance of flooding over 30 yrs
- 0.76%
- Est. flood insurance / yr
- $507 – $1,088
Fire risk 1/10 · Minimal
- Est. fire insurance / yr
- $1,054 – $1,958
Heat risk 5/10 · Moderate
- Hot days now (above 104°F)
- 7 days/yr
- Hot days in 30 yrs
- 17 days/yr
Wind risk 2/10 · Minimal
- Chance of severe wind over 30 yrs
- —
Air-quality risk 2/10 · Minimal
- Unhealthy air days now
- 1 days/yr
- Unhealthy air days in 30 yrs
- 2 days/yr
Risk factors via First Street. Map © Google.
Why this score? — see what drove the C+ grade
The composite is a weighted blend of 9 inputs, each scored 0–100. Each bar is that input's sub-score; the figure is the points it added to the 100-point composite (weight × sub-score).
- Cash flow +24.4/30.0
- ARV discount +13.7/15.0
- DSCR +7.9/10.0
- 1% rule +5.2/10.0
- Livability +3.8/5.0
- Rent growth +3.7/5.0
- Schools +3.2/10.0
- Condition / age +2.5/5.0
- Appreciation +0.0/10.0
$85,000
🖨 Deal sheet 📄 Offer letter ✓ Due diligence
Listing remarks
Investor opportunity with tenant already in place in Springfield's Midtown area. This 1 bed, 1 bath home offers immediate rental income potential and convenient access to downtown, shopping, dining, and local amenities. Functional layout with solid upside for investors looking to add to their portfolio. Sold as-is.
Key facts
- Convenient access
- Functional layout
- 8,276 sq ft lot
Tags
Property features AI
Finance
- Other: Square footage: 686 (above grade finished area 686)
- Financial info: Tax amount listed (financial specifics otherwise excluded)
- HOA & community: HOA information not provided
Exterior
- Parking: Parking details not provided
- Security: Security details not provided
- Utilities: Public water; Public sewer
- Home design: Single Family Residence; Residential property; One story
- Construction: Construction details not provided; Year built not provided
- Exterior features: Lot on approximately 0.19 acres; Located in the Greene-Not in List subdivision; Directions: From Fort head east on Nichols; house is on the right (south) side of the road
Interior
- Kitchen: Kitchen details not provided
- Bedrooms: Bedrooms information not provided
- Flooring: Flooring details not provided
- Bathrooms: 1 full bathroom
- Heating & cooling: Has heating (type described as Other); No central air / No cooling system
- Interior features: One-level layout
- Laundry & utility: Heating present (type: Other); No cooling
Neighborhood map
What this means for you Summary
Snapshot
- This is a 1-bed/1.0-bath single-family listed at $85k.
Deal economics
- At list price, monthly cash flow is $106 ($1k/yr) — positive.
- The deal already cash-flows at list — no discount required.
- Meets the 1% rule at list price ($869 rent vs $85k).
- Recommended offer: $82k (3.0% below list) — sets the bar for market timing.
- Cap rate 8.7% vs local median 4.6% in Springfield — top-decile yield for the area; either an underpriced asset or a hidden risk that comps aren't pricing in. Stress-test before assuming the spread holds.
Location & tenants
- Location reads 75/100 on livability (#57 in MO, #4,121 nationally) — a middle-class / working-renter tenant base. Strengths: commute A+, cost of living A+, housing A+; Watch: crime F, employment F.
- Springfield R-XII (urban): math 32% / reading 46% proficiency, ranked #174 of 324 in MO (top 54%) — families likely to look elsewhere, expect single-tenant / working-renter base with shorter leases.
- Zoned schools: Weaver Elem. (math 27% / reading 47%, grade F, #611 of 1,115 statewide, top 59%, 224 students, 91% FRL); Central High (math 42% / reading 62%, grade D+, #92 of 521 statewide, top 20%, 1,464 students, 51% FRL) — zoned schools average 71% FRL vs 46% district-wide (25 pts higher); higher-poverty schools than district average — tighter screening recommended.
- Market conditions: Rents rising fast (+4.8%/yr); 512 active listings in the ZIP; 27 comparable units currently listed for rent nearby; rentals at typical pace (median 24d on market — plan ~3-4 weeks tenant-placement turnaround); 1,302 units permitted in Greene County in 2024 (250 in 5+ unit buildings).
Forward outlook
- Local home prices are declining (-3.0%/yr); year-one equity from $588 of loan paydown is wiped out by about $3k of value loss. Plan a longer hold.
- Greene County population projected at +25% by 2050 — long-run rental-demand tailwind backs the buy-and-hold thesis.
Negotiation context
- It's been on market 35 days — a 3% lower offer ($82k) is reasonable based on typical stale-listing flexibility.
Risks & watch-outs
- Watch-outs: flood insurance adds $66/mo; built in 1897 — expect roof / HVAC / electrical / plumbing capex.
- Climate carrying-cost: major flood risk; extreme-heat days projected 7→17/yr by 2055 (HVAC capex compounding) — expect insurance premiums to compound above CPI over the hold.
Questions for the listing agent
- It's been on market 35 days. Have you received any prior offers? Is the seller open to a 3% concession, seller financing, or rate buy-down credit?
- Built in 1897 — when were the roof, HVAC, electrical panel, plumbing, and water heater last replaced?
- What's the actual annual flood-insurance premium (NFIP or private), and is the property in a SFHA with mandatory coverage?
- Is there a deadline driving the sale (1031 exchange, divorce, estate, relocation)? That informs how much negotiation room exists.
- Crime grade is F in this area — have there been break-ins, vandalism, or insurance claims at this property in the last 3 years? What carrier currently insures it and at what premium?
- What's the average days-on-market for RENTAL listings here right now (not sales)? A rising rental-DOM trend means longer vacancies and softer asking-rent achievability than the comps imply.
- What's the recent tenant-quality profile in this submarket — average credit score on applications, eviction rate, late-payment / NSF rate, and stable-employment percentage? A property-management company in the area should have these aggregated.
- How much new for-sale + rental construction is in the pipeline within 1–3 miles? Heavy new supply typically softens prices + rents 12–24 months out; constrained supply supports both.
Investment metrics
- 1% rule
- 1.02% ✓
- Cap rate
- 8.73%
- Cash-on-cash
- 8.70%
- DSCR
- 1.39
- GRM
- 8.2
CMA / ARV
- ARV (median comp)
- $98,683
- List price
- $85,000
- Delta
- -13.87%
- Verdict
- UNDERPRICED
- Comps
- 20 within 1.0 mi
Show comp detail 12 sales within ~0.75 mi
| Address | Dist | Beds/Ba | Sqft | Sold | Price | $/sf | Match |
|---|---|---|---|---|---|---|---|
| 920 W Central St | 0.17mi | 2/1.0 (+1) | 700 (+2%) | 13mo | $89,000 | $127 | 73 |
| 1318 N Douglas Ave | 0.39mi | 2/1.0 (+1) | 714 (+4%) | 1mo | $92,500 | $130 | 69 |
| 920 W Brower St | 0.21mi | 2/1.0 (+1) | 624 (-9%) | 1mo | $134,900 | $216 | 69 |
| 1308 N Franklin Ave | 0.27mi | 2/1.0 (+1) | 656 (-4%) | 10mo | $110,000 | $168 | 67 |
| 803 N Concord Ave | 0.41mi | 2/1.0 (+1) | 720 (+5%) | 4mo | $85,000 | $118 | 64 |
| 1025 W Scott St | 0.11mi | 2/1.0 (+1) | 784 (+14%) | 10mo | $25,500 | $33 | 58 |
| 1635 W Lynn St | 0.62mi | 2/1.0 (+1) | 732 (+7%) | 1mo | $115,000 | $157 | 54 |
| 806 N Farmer Ave | 0.55mi | 2/1.0 (+1) | 672 (-2%) | 15mo | $105,000 | $156 | 54 |
| 711 W Hovey St | 0.54mi | 2/1.0 (+1) | 756 (+10%) | 10mo | $75,000 | $99 | 44 |
| 1016 N Wabash Ave | 0.67mi | 2/1.0 (+1) | 630 (-8%) | 9mo | $89,900 | $143 | 42 |
| 921 N Lexington Ave | 0.61mi | 2/1.0 (+1) | 748 (+9%) | 13mo | $133,500 | $178 | 40 |
| 1459 N Nettleton Ave | 0.60mi | 1/1.0 | 588 (-14%) | 12mo | $89,900 | $153 | 38 |
Match score weights: distance 35% · size 25% · config 20% · recency 20%. Top-matched comps best support the ARV.
Projected returns pro-forma
-3.0% appreciation · 4.82% rent growth · sell at horizon
- IRR
- -6.0%
- Equity multiple
- 0.77×
- Total profit
- $-5,386
- Equity at exit
- $12,674
- IRR
- 5.7%
- Equity multiple
- 1.46×
- Total profit
- $10,945
- Equity at exit
- $7,349
Cash invested: $23,800 (down + closing). Projections, not guarantees.
Landlord ↔ Tenant lean methodology
- Overall (STATE)
- 81 Strongly Landlord-Friendly
- State Missouri
- 81 Strongly Landlord-Friendly · R+10
- County
- — inherits STATE
- City
- — inherits STATE
ZIP-level market 65802
- Home prices YoY
- -31.9%
- Rents YoY
- 4.8%
- Active inventory
- 512
- Price-to-rent
- 8.2×
Monthly cashflow live
- Estimated rent
- $869 high interval (Pro) →
- Mortgage (P&I)
- −$446
- Tax from tax record
- −$32 /mo · $389/yr
- Insurance
- −$35
- Flood insurance flood zone
- −$66 /mo · $798/yr
- HOA
- −$0
- Vacancy / Maint / Mgmt
- −$182
- Net cashflow
- $106
Break-even live
UW: 25.0% down · 7.5% · 30yr · 1.5% tax · 5.0% vac · 8.0% maint · 8.0% mgmt
Financing live
Cash to close
- Down payment
- $21,250
- Closing costs
- $2,550
- Reserves months
- —
- Total cash needed
- —
Loan-product check · same deal, 3 products live
Conventional
25% down · 7.5% · 30yr
- Down + closing
- —
- Monthly P&I
- —
- Monthly cashflow
- —
- DSCR
- —
- Eligible?
- —
Personal DTI + credit; lowest rate.
DSCR
20% down · 8.5% · 30yr
- Down + closing
- —
- Monthly P&I
- —
- Monthly cashflow
- —
- DSCR
- —
- Eligible?
- —
No personal income docs; deal must DSCR.
Hard money
10% down · 12.0% · 12mo
- Down + closing
- —
- Monthly P&I
- —
- Monthly cashflow
- —
- DSCR
- —
- Eligible?
- —
Short-term bridge; refi at stabilization.
Rent comps 27 comps
| Address | Beds | Baths | Sqft | Rent | $/sqft | DOM | Units | Dist |
|---|---|---|---|---|---|---|---|---|
| 1126 W Hamilton St Springfield, MO | 2.0 | 1.0 | 648 | $895 | $1.38 | 23d | 1 | 0.28mi |
| 813 W Poplar St Unit 813 Springfield, MO | 2.0 | 1.0 | 560 | $795 | $1.42 | 13d | 1 | 0.29mi |
| 916 N Kansas Expy Springfield, MO | 1.0 | 1.0 | 573 | $595 | $1.04 | 43d | 1 | 0.42mi |
| 733 W College St Springfield, MO | 1.0 | 1.0 | 700 | $750 | $1.07 | 13d | 1 | 0.75mi |
| 235 N Market Ave Springfield, MO | 1.0–4.0 | 1.0–2.0 | 1350 | $1,150 | $0.85 | 13d | 4 | 0.80mi |
| 235 N Market Ave Springfield, MO | 1.0–4.0 | 1.0–2.0 | 1350 | $1,150 | $0.85 | 23d | 5 | 0.80mi |
| 138 Park Central Sq Springfield, MO | 1.0–2.0 | 1.0–2.0 | 1083 | $969 | $0.89 | 13d | 8 | 0.90mi |
| 305 S Campbell Ave Unit 208 Springfield, MO | 1.0 | 1.0 | 649 | $975 | $1.50 | 13d | 1 | 0.91mi |
| 302 W Commercial St Unit 206F Springfield, MO | — | 1.0 | 615 | $850 | $1.38 | 43d | 1 | 0.94mi |
| 209 W McDaniel St Unit 209-207 Springfield, MO | 1.0 | 1.0 | 700 | $950 | $1.36 | 43d | 1 | 0.97mi |
| 522 N Park Ave Springfield, MO | 1.0 | 1.0 | 608 | $950 | $1.56 | 43d | 1 | 1.00mi |
| 1623 N Jefferson Ave Unit B Springfield, MO | 1.0 | 1.0 | 750 | $950 | $1.27 | 43d | 1 | 1.02mi |
| 1911 W Elm St Springfield, MO | 2.0 | 1.0 | 580 | $875 | $1.51 | 43d | 1 | 1.13mi |
| 301 W State St Unit D Springfield, MO | 1.0 | 1.0 | 570 | $875 | $1.54 | 23d | 1 | 1.28mi |
| 940 E Webster St Springfield, MO | — | 1.0 | 350 | $735 | $2.10 | 43d | 1 | 1.34mi |
| 511 E Cherry St Unit 8 Springfield, MO | 1.0 | 1.0 | 500 | $775 | $1.55 | 13d | 1 | 1.34mi |
| 511 E Cherry St Unit 2 Springfield, MO | 1.0 | 1.0 | 700 | $850 | $1.21 | 43d | 1 | 1.34mi |
| 934 E Webster St Springfield, MO | — | 1.0 | 350 | $818 | $2.34 | 13d | 6 | 1.35mi |
| 435 E Harrison St Unit 50302 Springfield, MO | — | 1.0 | 400 | $895 | $2.24 | 23d | 1 | 1.38mi |
| 435 E Harrison St Unit 435108 Springfield, MO | — | 1.0 | 400 | $700 | $1.75 | 13d | 1 | 1.38mi |
| 435 E Harrison St Unit 435203 Springfield, MO | — | 1.0 | 400 | $895 | $2.24 | 13d | 1 | 1.39mi |
| 755 South Ave Unit 2 Springfield, MO | 1.0 | 1.0 | 600 | $850 | $1.42 | 23d | 1 | 1.40mi |
| 407 E Dale St Apt B Springfield, MO | 2.0 | 1.0 | 720 | $795 | $1.10 | 13d | 1 | 1.41mi |
| 2712 W Nichols St Springfield, MO | 2.0 | 1.0 | 619 | $795 | $1.28 | 43d | 1 | 1.46mi |
| 806 South Ave Springfield, MO | 1.0 | 1.0 | 670 | $1,085 | $1.62 | 13d | 3 | 1.47mi |
| 745 S Jefferson Ave Unit 1 Springfield, MO | 1.0 | 1.0 | 410 | $795 | $1.94 | 23d | 1 | 1.50mi |
| 745 S Jefferson Ave Unit 6 Springfield, MO | 1.0 | 1.0 | 500 | $850 | $1.70 | 43d | 1 | 1.50mi |
Listing history 15 events
-
2026-06-18days on market $85,000 Active 35 DOM
-
2026-06-17days on market $85,000 Active 34 DOM
-
2026-06-16days on market $85,000 Active 33 DOM
-
2026-06-15days on market $85,000 Active 32 DOM
-
2026-06-14days on market $85,000 Active 30 DOM
-
2026-06-10days on market $85,000 Active 27 DOM
-
2026-06-09days on market $85,000 Active 26 DOM
-
2026-06-08days on market $85,000 Active 25 DOM
-
2026-06-07days on market $85,000 Active 24 DOM
-
2026-06-03days on market $85,000 Active 20 DOM
-
2026-06-02days on market $85,000 Active 19 DOM
-
2026-06-01days on market $85,000 Active 18 DOM
-
2026-05-31days on market $85,000 Active 17 DOM
-
2026-05-30days on market $85,000 Active 16 DOM
-
2026-05-14$85,000 Active 316-char remark
ⓘ Source: listings_history table (triggers on properties + properties_extension) + one-shot
backfill from property_details.listing_events for pre-trigger history.
Tax reassessment forecast MO · Resets to sale price
- Current annual tax
- $389 · $32/mo
- Projected year-2 tax
- $824 · $69/mo
- Expected delta
- +$435/yr (+$36/mo · 111.9%)
ⓘ Screening estimate from a state-policy table — verify with the county assessor before closing.
Climate risk First Street
- Flood 7/10 Severe FEMA zone X (unshaded) · 76% chance over 30 yrs
- Wildfire 1/10 Low
- Heat 5/10 Major 7 d/yr ≥104°F today · 17 d/yr by 30 yrs out
- Wind 2/10 Low
- Air quality 2/10 Low 1 unhealthy d/yr today · 2 by 30 yrs out
Nearby sold comps map
Loading sold comps map…
Walkable amenities ~0.75 mi
Loading nearby amenities…
Taxation est. · year 1
- Rental income
- $10,423
- − Mortgage interest
- −$4,761
- − Property taxes
- −$389
- − Insurance
- −$1,222
- − Repairs & maintenance
- −$834
- − Management
- −$834
- − Depreciation
- −$2,473
- Taxable loss
- −$90
- Est. tax savings @ 24.0%
- +$22
- After-tax cash flow
- $1,295/yr
For passive investors: Depreciation is non-cash, so a rental often shows a tax loss while cash-flowing — sheltering income. Rental losses are passive: they offset passive income freely, and up to $25,000/yr can offset ordinary (W-2) income if you actively participate and your MAGI is under $100k (phasing out to $0 by $150k); unused losses carry forward. On sale, claimed depreciation is recaptured at up to 25%, and gains may owe capital-gains tax (a 1031 exchange can defer both). Figures are a year-1 estimate at your 24.0% rate — not tax advice; consult a CPA.
Schools (NCES district)
- District
- Springfield R-XII
- NCES district ID
- 2928860
- Math proficiency
- 32% ▼ -2.00%
- Reading proficiency
- 46% ▼ -3.00%
- Median HH income
- $37,886
- Composite
- 32.45/100
- National rank
- #5717
- State rank
- #174 of 324 in MO
Livability — Springfield
- Score
- 75/100
- State rank
- #57
- US rank
- #4121
Category grades
Schools grade is shown separately in the Schools card above.
Census & demographics
- Census place
- Springfield, MO
- County
- Greene County · 244,327 people
- City population
- 223,044
- Metro
- Springfield, MO
- Population (ZIP)
- 46,739
- Household income
- $55,019
- Rent vs Own
- Severe rent burden
- 1818.0
Population outlook (Greene County) Hauer SSP2
- Today (2025)
- 319,054 people
- By 2030
- 335,135 · +5.0%
- By 2040
- 366,186 · +14.8%
- By 2050
- 397,431 · +24.6%
- By 2075
- 477,035 · +49.5%
- By 2100
- 520,828 · +63.2%
Race, ethnicity, and origin ACS 2023
- Neighborhood character
- Predominantly White (81%)
- Race & ethnicity
- White 81% Two or more races 8% Hispanic / Latino 5% Black 4% Asian 2%
- Common ancestry
- Slovak 2% Lithuanian 2% Italian 2%
- Foreign-born
- 3% · Canada, Vietnam
- Languages at home
- 95% English-only · Spanish 2% Vietnamese 1% Other Indo-European 1%
Political lean MEDSL · Greene
- 2024 margin
- Strong R (+20.8) · D 38.9% · R 59.7% · Other 1.4%
- 2008→2024 swing
- -5.0pp toward R · 2008: -15.8pp · 2024: -20.8pp
- All cycles
- 2024: R+20.8 2020: R+20.1 2016: R+27.4 2012: R+24.4 2008: R+15.8
Not yet ingested
- Civics
- —
Market trends
- HPI YoY
- ▼ -99.72%
- Current HPI
- 212.9826
- Rent YoY
- ▲ 4.82%
- Metro
- Springfield, MO
- State GDP YoY
- ▲ 1.84%
- F500 in state
- 20
Industry mix (Fortune 500 HQ in MO)
| Industry | F500 HQs | Revenue |
|---|---|---|
| Healthcare | 1 | $163B |
|
||
| Insurance | 1 | $21B |
|
||
| Industrial Technology | 1 | $17B |
|
||
| Retail | 1 | $16B |
|
||
| Industrial Distribution | 1 | $10B |
|
||
| Utilities | 1 | $9B |
|
||
Price history
1 event — show timeline
- 2026-05-14 Listed $85,000 SOMO
Property tax history
+2.8%/yrLatest (2025): $389 · +23.3% YoY. Source: county tax records.
Cash-flow waterfall
monthlySold comps — $/sqft
last 12 mo · ≤1 miLoading sold comps…