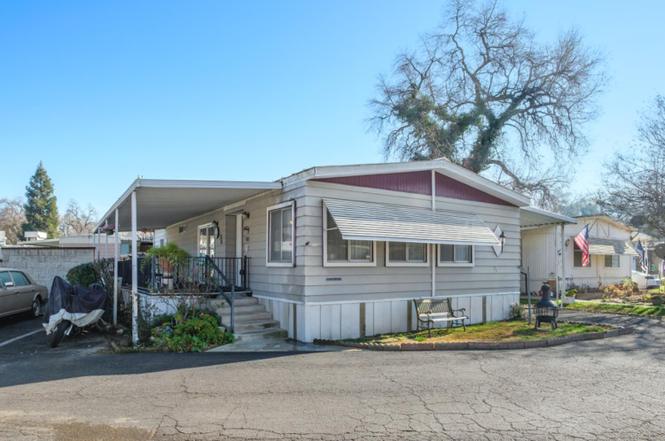
339 N Frankwood Ave #24 · Minkler, CA
Flood risk 2/10 · Minimal
- FEMA flood zone
- X (unshaded)
- Chance of flooding over 30 yrs
- 0.03%
- Est. flood insurance / yr
- $507 – $1,088
Fire risk 6/10 · Moderate
- Est. fire insurance / yr
- $659 – $1,223
Heat risk 7/10 · Major
- Hot days now (above 107°F)
- 6 days/yr
- Hot days in 30 yrs
- 15 days/yr
Wind risk 1/10 · Minimal
- Chance of severe wind over 30 yrs
- —
Air-quality risk 10/10 · Severe
- Unhealthy air days now
- 58 days/yr
- Unhealthy air days in 30 yrs
- 65 days/yr
Risk factors via First Street. Map © Google.
Why this score? — see what drove the B+ grade
The composite is a weighted blend of 9 inputs, each scored 0–100. Each bar is that input's sub-score; the figure is the points it added to the 100-point composite (weight × sub-score).
- Cash flow +30.0/30.0
- ARV discount +15.0/15.0
- 1% rule +10.0/10.0
- DSCR +10.0/10.0
- Schools +3.7/10.0
- Rent growth +2.5/5.0
- Condition / age +2.5/5.0
- Livability +2.0/5.0
- Appreciation +0.0/10.0
$99,500
🖨 Deal sheet 📄 Offer letter ✓ Due diligence
Listing remarks
Want to live next to the Sherwood Forest Golf Course? Well here you go. This mobile space across from the golf cart path easy access to the beautiful Sherwood Forest golf course. & nbsp; Country living surrounded by the peaceful nature of tall trees and a beautiful view of the Sierra mountains on a clear day. & nbsp; Space 24 is close to the community pool. & nbsp; Shaded large patio decking. This home has been well maintained by the owner. & nbsp; Open and spacious floor plan with 2 living areas. This Mobile home park is designed for 55 plus residence. & nbsp;
Key facts
- Large patio decking
- Community pool
- Golf cart path
Tags
Property features AI
Finance
- HOA & community: Park space is rented; Community pool
Exterior
- Parking: Carport; Has carport
- Utilities: Electric service connected; Public utilities available; Septic tank sewer
- Home design: Mobile home; Kingsbrook make
- Construction: Metal roof; Vinyl siding; Wood subfloor foundation; Built as a mobile home
- Exterior features: One-level home; Metal roof; Vinyl siding; Wood subfloor foundation; Rural setting; Community in-ground pool (private access noted); Park space rented
Interior
- Kitchen: Dishwasher; Electric appliances
- Flooring: Carpet; Vinyl
- Bathrooms: 2 bathrooms with tub/shower and tub
- Heating & cooling: Central heating and cooling; Has heating; Has cooling
- Interior features: Electric appliances; Dishwasher; Covered porch and deck; No basement
- Laundry & utility: Indoor laundry in utility room
Neighborhood map
What this means for you Summary
Snapshot
- This is a 2-bed/2.0-bath manufactured listed at $100k.
Deal economics
- At list price, monthly cash flow is $915 ($11k/yr) — positive.
- The deal already cash-flows at list — no discount required.
- Meets the 1% rule at list price ($2k rent vs $100k).
- Recommended offer: $94k (6.0% below list) — sets the bar for market timing.
Location & tenants
- Location reads 40/100 on livability (#1,388 in CA) — a working-class tenant base; expect higher turnover. Strengths: employment A-; Watch: crime D+, amenities F, commute F.
- Sanger Unified (town): math 22% / reading 62% proficiency, ranked #216 of 517 in CA (top 42%) — families likely to look elsewhere, expect single-tenant / working-renter base with shorter leases; 64% free/reduced lunch — lower-income household profile, screen leases tightly.
- Zoned schools: Fairmont Elementary (677 students, 46% FRL); Sanger High (math 24% / reading 66%, grade D-, #425 of 1,170 statewide, top 37%, 2,734 students, 67% FRL).
- Market conditions: 151 active listings in the ZIP; solid renter incomes; 2,426 units permitted in Fresno County in 2024 (296 in 5+ unit buildings).
- This rent runs 31% of the median local income ($79k/yr) — at the standard rent-burdened threshold; future hikes will face affordability resistance.
Forward outlook
- Local home prices are declining (-3.0%/yr); year-one equity from $688 of loan paydown is wiped out by about $3k of value loss. Plan a longer hold.
- Fresno County population projected at +11% by 2050 — modest demand growth; plan on rents tracking national, not racing it.
- At projected returns (-3.0% appreciation + 3.0% rent growth), your $28k cash investment doubles in ~3 years — after that, you're playing with house money.
Negotiation context
- It's been on market 80 days — a 6% lower offer ($94k) is reasonable based on typical stale-listing flexibility.
Risks & watch-outs
- Climate carrying-cost: major wildfire risk; extreme-heat days projected 6→15/yr by 2055 (HVAC capex compounding) — expect insurance premiums to compound above CPI over the hold.
Questions for the listing agent
- It's been on market 80 days. Have you received any prior offers? Is the seller open to a 6% concession, seller financing, or rate buy-down credit?
- Built in 1973 — when were the roof, HVAC, electrical panel, plumbing, and water heater last replaced?
- Why hasn't it sold? Are there any deal-killer items the seller is aware of (foundation, flood, title, zoning, code violations)?
- Is there a deadline driving the sale (1031 exchange, divorce, estate, relocation)? That informs how much negotiation room exists.
- Schools are F-rated, which usually means shorter tenancies and higher turnover. Who's the typical renter profile here, and what's been the actual vacancy rate?
- Crime grade is D in this area — have there been break-ins, vandalism, or insurance claims at this property in the last 3 years? What carrier currently insures it and at what premium?
- What's the average days-on-market for RENTAL listings here right now (not sales)? A rising rental-DOM trend means longer vacancies and softer asking-rent achievability than the comps imply.
- What's the recent tenant-quality profile in this submarket — average credit score on applications, eviction rate, late-payment / NSF rate, and stable-employment percentage? A property-management company in the area should have these aggregated.
- How much new for-sale + rental construction is in the pipeline within 1–3 miles? Heavy new supply typically softens prices + rents 12–24 months out; constrained supply supports both.
Investment metrics
- 1% rule
- 2.04% ✓
- Cap rate
- 17.32%
- Cash-on-cash
- 39.39%
- DSCR
- 2.75
- GRM
- 4.1
CMA / ARV
- ARV (on-the-fly)
- $136,152
- Comps found
- 5
Show comp detail 5 sales within ~0.75 mi
| Address | Dist | Beds/Ba | Sqft | Sold | Price | $/sf | Match |
|---|---|---|---|---|---|---|---|
| 339 N Frankwood #29 | 0.08mi | 2/2.0 | 1,444 (-1%) | 3mo | $135,000 | $93 | 91 |
| 339 N Frankwood Ave #6 | 0.08mi | 3/2.0 (+1) | 1,464 (0%) | 3mo | $123,000 | $84 | 88 |
| 339 N Frankwood Ave | 0.08mi | 2/2.0 | 1,440 (-2%) | 20mo | $146,500 | $102 | 76 |
| 339 N FRANKWOOD Ave Spc 8 | 0.08mi | 2/2.0 | 1,440 (-2%) | 20mo | $146,500 | $102 | 76 |
| 339 N Frankwood Ave Ave #15 | 0.08mi | 2/2.0 | 1,440 (-2%) | 21mo | $133,115 | $92 | 76 |
Match score weights: distance 35% · size 25% · config 20% · recency 20%. Top-matched comps best support the ARV.
Projected returns pro-forma
-3.0% appreciation · 3.0% rent growth · sell at horizon
- IRR
- 35.7%
- Equity multiple
- 2.51×
- Total profit
- $42,156
- Equity at exit
- $14,836
- IRR
- 42.4%
- Equity multiple
- 5.01×
- Total profit
- $111,838
- Equity at exit
- $8,603
Cash invested: $27,860 (down + closing). Projections, not guarantees.
Landlord ↔ Tenant lean methodology
- Overall (STATE)
- 18 Strongly Tenant-Friendly
- State California
- 18 Strongly Tenant-Friendly · D+13
- County
- — inherits STATE
- City
- — inherits STATE
ZIP-level market 93657
- Active inventory
- 151
- Price-to-rent
- 4.1×
Monthly cashflow live
- Estimated rent
- $2,028 medium interval (Pro) →
- Mortgage (P&I)
- −$522
- Tax est. 1.5%
- −$124 /mo · $1,492/yr
- Insurance
- −$41
- HOA
- −$0
- Vacancy / Maint / Mgmt
- −$426
- Net cashflow
- $915
Break-even live
UW: 25.0% down · 7.5% · 30yr · 1.5% tax · 5.0% vac · 8.0% maint · 8.0% mgmt
Financing live
Cash to close
- Down payment
- $24,875
- Closing costs
- $2,985
- Reserves months
- —
- Total cash needed
- —
Loan-product check · same deal, 3 products live
Conventional
25% down · 7.5% · 30yr
- Down + closing
- —
- Monthly P&I
- —
- Monthly cashflow
- —
- DSCR
- —
- Eligible?
- —
Personal DTI + credit; lowest rate.
DSCR
20% down · 8.5% · 30yr
- Down + closing
- —
- Monthly P&I
- —
- Monthly cashflow
- —
- DSCR
- —
- Eligible?
- —
No personal income docs; deal must DSCR.
Hard money
10% down · 12.0% · 12mo
- Down + closing
- —
- Monthly P&I
- —
- Monthly cashflow
- —
- DSCR
- —
- Eligible?
- —
Short-term bridge; refi at stabilization.
Listing history 5 events
-
2026-05-01status Pending
-
2026-03-31historical Pending Accepting Backups
-
2026-02-10$99,500 Active
-
2025-08-05price $99,500
-
2025-06-17price $110,000
ⓘ Source: listings_history table (triggers on properties + properties_extension) + one-shot
backfill from property_details.listing_events for pre-trigger history.
Climate risk First Street
- Flood 2/10 Low FEMA zone X (unshaded) · 3% chance over 30 yrs
- Wildfire 6/10 Major
- Heat 7/10 Severe 6 d/yr ≥107°F today · 15 d/yr by 30 yrs out
- Wind 1/10 Low
- Air quality 10/10 Extreme 58 unhealthy d/yr today · 65 by 30 yrs out
Nearby sold comps map
Loading sold comps map…
Walkable amenities ~0.75 mi
Loading nearby amenities…
Taxation est. · year 1
- Rental income
- $24,337
- − Mortgage interest
- −$5,574
- − Property taxes
- −$1,492
- − Insurance
- −$498
- − Repairs & maintenance
- −$1,947
- − Management
- −$1,947
- − Depreciation
- −$2,895
- Taxable income
- $9,985
- Est. tax owed @ 24.0%
- −$2,396
- After-tax cash flow
- $8,578/yr
For passive investors: Depreciation is non-cash, so a rental often shows a tax loss while cash-flowing — sheltering income. Rental losses are passive: they offset passive income freely, and up to $25,000/yr can offset ordinary (W-2) income if you actively participate and your MAGI is under $100k (phasing out to $0 by $150k); unused losses carry forward. On sale, claimed depreciation is recaptured at up to 25%, and gains may owe capital-gains tax (a 1031 exchange can defer both). Figures are a year-1 estimate at your 24.0% rate — not tax advice; consult a CPA.
Schools (NCES district)
- District
- Sanger Unified
- NCES district ID
- 0635250
- Math proficiency
- 22% ▼ -21.00%
- Reading proficiency
- 62% ▲ 9.00%
- Median HH income
- $57,180
- Composite
- 36.67/100
- National rank
- #4608
- State rank
- #216 of 517 in CA
Livability — Minkler
- Score
- 40/100
- State rank
- #1388
- US rank
- #27290
Category grades
Schools grade is shown separately in the Schools card above.
Census & demographics
- Census place
- Minkler, CA
- County
- Fresno County · 834,801 people
- Metro
- Fresno, CA
- Population (ZIP)
- 36,205
- Household income
- $78,904
- Rent vs Own
- Severe rent burden
- 878.0
Population outlook (Fresno County) Hauer SSP2
- Today (2025)
- 1,042,971 people
- By 2030
- 1,072,198 · +2.8%
- By 2040
- 1,122,408 · +7.6%
- By 2050
- 1,157,251 · +11.0%
- By 2075
- 1,182,575 · +13.4%
- By 2100
- 1,105,899 · +6.0%
Race, ethnicity, and origin ACS 2023
- Neighborhood character
- Predominantly Hispanic (68%)
- Race & ethnicity
- Hispanic / Latino 68% White 25% Two or more races 17% Asian 5% Native American 2%
- Hispanic origin (detail)
- Mexican 64%
- Common ancestry
- Russian 1% Italian 1% Iranian 1%
- Foreign-born
- 19% · Canada, China
- Languages at home
- 52% English-only · Spanish 44% Other Asian/Pacific 2% Other Indo-European 1%
Political lean MEDSL · Fresno
- 2024 margin
- Toss-up / Even · D 46.5% · R 50.9% · Other 2.6%
- 2008→2024 swing
- -6.5pp toward R · 2008: 2.1pp · 2024: -4.4pp
- All cycles
- 2024: R+4.4 2020: D+7.8 2016: D+3.9 2012: R+2.9 2008: D+2.1
Not yet ingested
- Civics
- —
Market trends
- HPI YoY
- ▼ -254.86%
- Current HPI
- 366.3783
- Rent YoY
- —
- Metro
- Fresno, CA
- State GDP YoY
- ▲ 3.21%
- F500 in state
- 116
Industry mix (Fortune 500 HQ in CA)
| Industry | F500 HQs | Revenue |
|---|---|---|
| Technology | 27 | $1,492B |
|
||
| Financial Services | 3 | $174B |
|
||
| Retail | 3 | $44B |
|
||
| Insurance | 3 | $26B |
|
||
| Media / Entertainment | 2 | $115B |
|
||
| Pharmaceuticals / Biotech | 2 | $62B |
|
||
Price history
-9.5% since first listed5 events — show timeline
- 2026-05-01 Pending — FRESNOMLS
- 2026-03-31 Contingent — FRESNOMLS
- 2026-02-10 Listed $99,500 FRESNOMLS
- 2025-08-05 Price Changed $99,500 FRESNOMLS
- 2025-06-17 Price Changed $110,000 FRESNOMLS
Cash-flow waterfall
monthlySold comps — $/sqft
last 12 mo · ≤1 miLoading sold comps…