1077 Paper Mill Rd · Chambersburg, PA
Flood risk 1/10 · Minimal
- FEMA flood zone
- X (unshaded)
- Chance of flooding over 30 yrs
- 0.0%
- Est. flood insurance / yr
- $507 – $1,088
Fire risk 3/10 · Minor
- Est. fire insurance / yr
- $511 – $949
Heat risk 4/10 · Minor
- Hot days now (above 101°F)
- 6 days/yr
- Hot days in 30 yrs
- 11 days/yr
Wind risk 2/10 · Minimal
- Chance of severe wind over 30 yrs
- 2.0%
Air-quality risk 2/10 · Minimal
- Unhealthy air days now
- 1 days/yr
- Unhealthy air days in 30 yrs
- 2 days/yr
Risk factors via First Street. Map © Google.
Why this score? — see what drove the D grade
The composite is a weighted blend of 9 inputs, each scored 0–100. Each bar is that input's sub-score; the figure is the points it added to the 100-point composite (weight × sub-score).
- Cash flow +15.2/30.0
- ARV discount +7.5/15.0
- DSCR +4.7/10.0
- Livability +3.7/5.0
- 1% rule +3.4/10.0
- Schools +3.2/10.0
- Rent growth +2.5/5.0
- Condition / age +2.5/5.0
- Appreciation +0.0/10.0
$239,900
🖨 Deal sheet (PDF) 📄 Offer letter ✓ Due diligence
Listing remarks
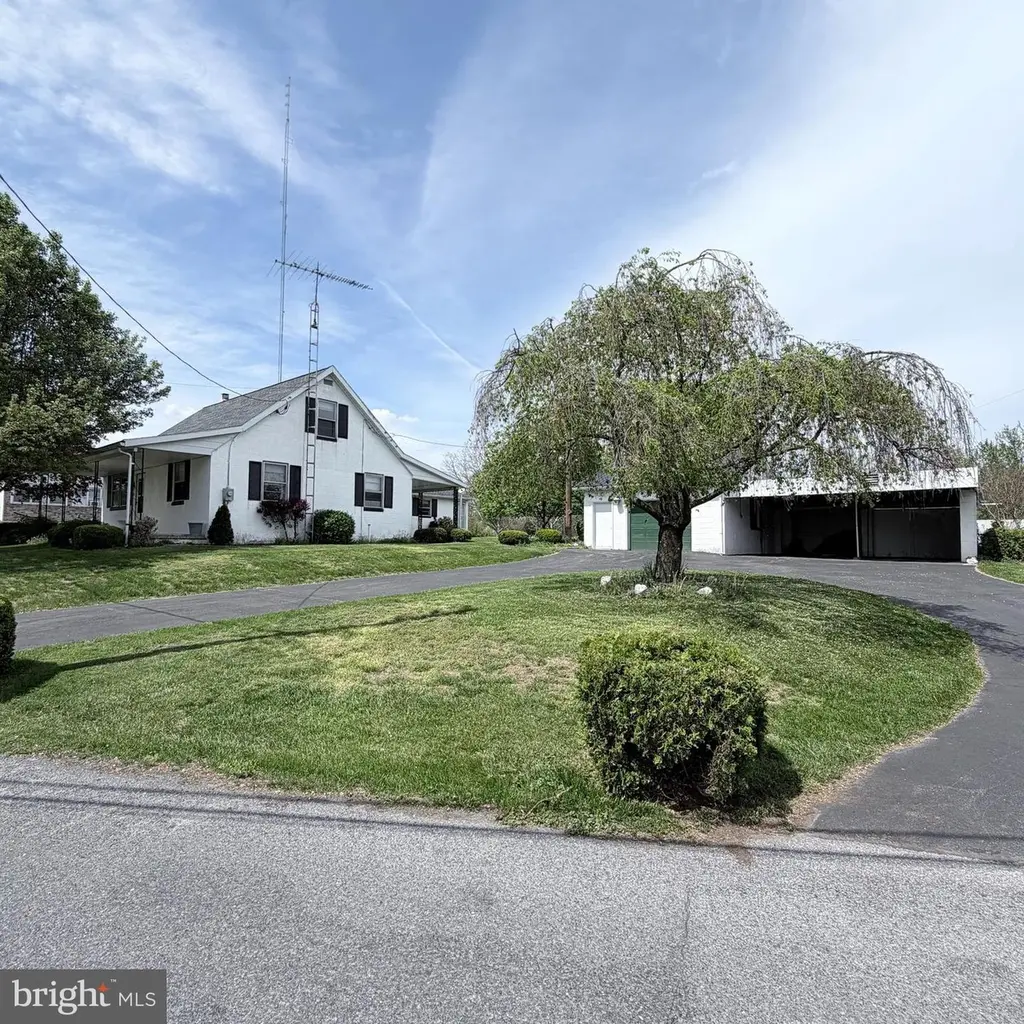
Solid four-bedroom, one full bath ranch-style home situated on three parcels totaling 0.80 acres! Nestled in a peaceful setting, this property offers plenty of space both inside and out. A garage with a covered parking area, along with multiple outbuildings, adds versatility and functionality—perfect for storage, hobbies, or additional workspace. A great opportunity for comfortable living with room to grow!
Key facts
- Ranch-style home
- Three parcels
- Covered parking area
Tags
Property features AI
Exterior
- Parking: Detached garage with additional storage (1 garage space); Detached carport (3 spaces); Total of 4 garage/parking spaces; Garage is oversized
- Utilities: Well water; Public sewer; Electric power
- Home design: Detached structure; Finished area approximately 1,300 (estimated); Fee simple ownership
- Construction: Block construction; Permanent foundation; Above-grade other structures
- Exterior features: No tidal water
Interior
- Bedrooms: 2 bedrooms on the main level; 2 bedrooms on the upper level
- Bathrooms: 1 full bathroom on the main level; 1 full bathroom total
- Heating & cooling: Baseboard electric heating; Wood burning stove; Electric hot water
- Interior features: Full basement
Neighborhood map
What this means for you Summary
Snapshot
- This is a 4-bed/1.0-bath other listed at $240k.
Deal economics
- At list price, monthly cash flow is $85 ($1k/yr) — positive.
- The deal already cash-flows at list — no discount required.
- To meet the 1% rule (rent ≥ 1% of price), the offer needs to be $201k (16.4% below list).
- Recommended offer: $201k (16.4% below list) — sets the bar for 1% rule.
- Cap rate 6.7% vs local median 3.9% in Chambersburg — top-decile yield for the area; either an underpriced asset or a hidden risk that comps aren't pricing in. Stress-test before assuming the spread holds.
Location & tenants
- Location reads 74/100 on livability (#530 in PA, #4,894 nationally) — a middle-class / working-renter tenant base. Strengths: cost of living A+, health & safety A+, housing A; Watch: amenities D+, crime D, employment D.
- Chambersburg Area SD (other): math 26% / reading 48% proficiency, ranked #383 of 539 in PA (top 71%) — families likely to look elsewhere, expect single-tenant / working-renter base with shorter leases.
- Zoned schools: South Hamilton El Sch (math 32% / reading 57%, grade F, #815 of 1,518 statewide, top 56%, 260 students, 55% FRL); Chambersburg Area Ms - South (math 17% / reading 45%, grade F, #374 of 512 statewide, top 73%, 1,054 students, 69% FRL); Chambersburg Area Shs (math 46% / reading 10%, grade F, #362 of 437 statewide, top 83%, 2,348 students, 60% FRL) — zoned schools average 61% FRL vs 41% district-wide (20 pts higher); higher-poverty schools than district average — tighter screening recommended.
- Market conditions: 223 active listings in the ZIP; 3 comparable units currently listed for rent nearby; rentals lingering (median 46d on market — plan ~5-8 weeks vacancy on turnover, expect pricing pressure); 100% of comp listings sitting > 30 days — soft ceiling on asking rent; 633 units permitted in Franklin County in 2024 (112 in 5+ unit buildings).
Forward outlook
- Local home prices are declining (-3.0%/yr); year-one equity from $2k of loan paydown is wiped out by about $7k of value loss. Plan a longer hold.
Negotiation context
- It's been on market 17 days — a 2% lower offer ($236k) is reasonable based on typical stale-listing flexibility.
- 2 sale attempts with the ask held roughly flat each time — persistent listings suggest the price (not the market) is what's stuck; bring a comps-based counter.
Risks & watch-outs
- Watch-outs: built in 1951 — expect roof / HVAC / electrical / plumbing capex.
Questions for the listing agent
- Built in 1951 — when were the roof, HVAC, electrical panel, plumbing, and water heater last replaced?
- Is there a deadline driving the sale (1031 exchange, divorce, estate, relocation)? That informs how much negotiation room exists.
- Crime grade is D in this area — have there been break-ins, vandalism, or insurance claims at this property in the last 3 years? What carrier currently insures it and at what premium?
- The area grade is low — what's the realistic commute time and amenity access for the typical tenant pool here? Any planned neighborhood developments (good or bad) we should know about?
- What's the average days-on-market for RENTAL listings here right now (not sales)? A rising rental-DOM trend means longer vacancies and softer asking-rent achievability than the comps imply.
- What's the recent tenant-quality profile in this submarket — average credit score on applications, eviction rate, late-payment / NSF rate, and stable-employment percentage? A property-management company in the area should have these aggregated.
- How much new for-sale + rental construction is in the pipeline within 1–3 miles? Heavy new supply typically softens prices + rents 12–24 months out; constrained supply supports both.
Investment metrics
- 1% rule
- 0.84% ✗
- Cap rate
- 6.72%
- Cash-on-cash
- 1.52%
- DSCR
- 1.07
- GRM
- 10.0
CMA / ARV
No comps found within radius.
Projected returns pro-forma
-3.0% appreciation · 3.0% rent growth · sell at horizon
- IRR
- -13.9%
- Equity multiple
- 0.50×
- Total profit
- $-33,527
- Equity at exit
- $35,770
- IRR
- -5.1%
- Equity multiple
- 0.67×
- Total profit
- $-22,496
- Equity at exit
- $20,742
Cash invested: $67,172 (down + closing). Projections, not guarantees.
Landlord ↔ Tenant lean methodology
- Overall (STATE)
- 62 Landlord-Friendly
- State Pennsylvania
- 62 Landlord-Friendly · EVEN
- County
- — inherits STATE
- City
- — inherits STATE
ZIP-level market 17202
- Home prices YoY
- -26.1%
- Active inventory
- 223
- Price-to-rent
- 10.0×
Monthly cashflow live
- Estimated rent
- $2,006 medium interval (Pro) →
- Mortgage (P&I)
- −$1,258
- Tax from tax record
- −$141 /mo · $1,698/yr
- Insurance
- −$100
- HOA
- −$0
- Vacancy / Maint / Mgmt
- −$421
- Net cashflow
- $85
Break-even live
Sensitivity live
| Price | -10% $221 | -5% $153 | +0% $85 | +5% $17 | +10% $-51 |
|---|---|---|---|---|---|
| Rent | -10% $-73 | -5% $6 | +0% $85 | +5% $164 | +10% $243 |
| Rate | -1.0pp $206 | -0.5pp $146 | base $85 | +0.5pp $23 | +1.0pp $-40 |
UW: 25.0% down · 7.5% · 30yr · 1.5% tax · 5.0% vac · 8.0% maint · 8.0% mgmt
Financing live
Cash to close
- Down payment
- $59,975
- Closing costs
- $7,197
- Reserves months
- —
- Total cash needed
- —
Loan-product check · same deal, 3 products live
Conventional
25% down · 7.5% · 30yr
- Down + closing
- —
- Monthly P&I
- —
- Monthly cashflow
- —
- DSCR
- —
- Eligible?
- —
Personal DTI + credit; lowest rate.
DSCR
20% down · 8.5% · 30yr
- Down + closing
- —
- Monthly P&I
- —
- Monthly cashflow
- —
- DSCR
- —
- Eligible?
- —
No personal income docs; deal must DSCR.
Hard money
10% down · 12.0% · 12mo
- Down + closing
- —
- Monthly P&I
- —
- Monthly cashflow
- —
- DSCR
- —
- Eligible?
- —
Short-term bridge; refi at stabilization.
Rent comps 3 comps
| Address | Beds | Baths | Sqft | Rent | $/sqft | DOM | Units | Dist |
|---|---|---|---|---|---|---|---|---|
| 9 Delano Dr Chambersburg, PA | 3.0 | 2.5 | 1860 | $2,195 | $1.18 | 45d | 1 | 1.30mi |
| 1121 Progress Rd Chambersburg, PA | 3.0 | 1.5 | 1376 | $1,650 | $1.20 | 45d | 1 | 1.31mi |
| 111 Delano Dr Chambersburg, PA | 3.0 | 2.5 | 1825 | $2,295 | $1.26 | 45d | 1 | 1.33mi |
Listing history 7 events
-
2026-05-04status Pending 416-char remark
-
2026-04-25price $239,900 416-char remark
-
2026-04-17$249,990 Active 416-char remark
-
2026-04-15historical
-
2026-04-06price $249,900
-
2026-03-18$259,900 Active
-
2026-03-11historical
ⓘ Source: listings_history table (triggers on properties + properties_extension) + one-shot
backfill from property_details.listing_events for pre-trigger history.
Tax reassessment forecast PA · Partial reset (capped growth)
- Current annual tax
- $1,698 · $141/mo
- Projected year-2 tax
- $2,744 · $229/mo
- Expected delta
- +$1,046/yr (+$87/mo · 61.6%)
ⓘ Screening estimate from a state-policy table — verify with the county assessor before closing.
Climate risk First Street
- Flood 1/10 Low FEMA zone X (unshaded) · 0% chance over 30 yrs
- Wildfire 3/10 Moderate
- Heat 4/10 Moderate 6 d/yr ≥101°F today · 11 d/yr by 30 yrs out
- Wind 2/10 Low 2% chance of damaging wind over 30 yrs
- Air quality 2/10 Low 1 unhealthy d/yr today · 2 by 30 yrs out
Nearby sold comps map
Loading sold comps map…
Walkable amenities ~0.75 mi
Loading nearby amenities…
Taxation est. · year 1
- Rental income
- $24,068
- − Mortgage interest
- −$13,438
- − Property taxes
- −$1,698
- − Insurance
- −$1,200
- − Repairs & maintenance
- −$1,925
- − Management
- −$1,925
- − Depreciation
- −$6,979
- Taxable loss
- −$3,097
- Est. tax savings @ 24.0%
- +$743
- After-tax cash flow
- $1,763/yr
For passive investors: Depreciation is non-cash, so a rental often shows a tax loss while cash-flowing — sheltering income. Rental losses are passive: they offset passive income freely, and up to $25,000/yr can offset ordinary (W-2) income if you actively participate and your MAGI is under $100k (phasing out to $0 by $150k); unused losses carry forward. On sale, claimed depreciation is recaptured at up to 25%, and gains may owe capital-gains tax (a 1031 exchange can defer both). Figures are a year-1 estimate at your 24.0% rate — not tax advice; consult a CPA.
Schools (NCES district)
- District
- Chambersburg Area SD
- NCES district ID
- 4205550
- Math proficiency
- 26% ▼ -17.00%
- Reading proficiency
- 48% ▼ -16.00%
- Median HH income
- $52,666
- Composite
- 32.17/100
- National rank
- #5787
- State rank
- #383 of 539 in PA
Livability — Chambersburg
- Score
- 74/100
- State rank
- #530
- US rank
- #4894
Category grades
Schools grade is shown separately in the Schools card above.
Census & demographics
- City population
- 27,554
- Population (ZIP)
- 32,772
Population outlook (Franklin County) Hauer SSP2
- Today (2025)
- 157,827 people
- By 2030
- 158,933 · +0.7%
- By 2040
- 159,060 · +0.8%
- By 2050
- 155,132 · -1.7%
- By 2075
- 138,545 · -12.2%
- By 2100
- 112,321 · -28.8%
Race, ethnicity, and origin ACS 2023
- Neighborhood character
- Predominantly White (84%)
- Race & ethnicity
- White 84% Hispanic / Latino 7% Two or more races 5% Black 2% Asian 2%
- Hispanic origin (detail)
- Mexican 1% Puerto Rican 2%
- Common ancestry
- Romanian 3% Italian 3% Polish 1%
- Foreign-born
- 4% · Canada, Philippines
- Languages at home
- 92% English-only · Spanish 6% Other Asian/Pacific 1%
Political lean MEDSL · Franklin
- 2024 margin
- Solid R (+43.0) · D 28.1% · R 71.1%
- 2008→2024 swing
- -10.4pp toward R · 2008: -32.6pp · 2024: -43.0pp
- All cycles
- 2024: R+43.0 2020: R+43.1 2016: R+46.5 2012: R+38.5 2008: R+32.6
Not yet ingested
- Civics
- —
Market trends
- HPI YoY
- ▼ -81.86%
- Current HPI
- 232.0695
- Rent YoY
- —
- Metro
- —
- State GDP YoY
- ▲ 1.68%
- F500 in state
- 34
Industry mix (Fortune 500 HQ in PA)
| Industry | F500 HQs | Revenue |
|---|---|---|
| Healthcare | 2 | $309B |
|
||
| Insurance | 2 | $27B |
|
||
| Telecommunications / Media | 1 | $124B |
|
||
| Industrial Distribution | 1 | $22B |
|
||
| Financial Services | 1 | $20B |
|
||
| Chemicals / Materials | 1 | $18B |
|
||
Price history
-7.7% since first listed9 events — show timeline
- 2026-06-04 Sold (Public Records) $239,900 Public Records
- 2026-06-03 Sold (MLS) $239,900 BRIGHT MLS
- 2026-05-04 Pending — BRIGHT MLS
- 2026-04-25 Price Changed $239,900 BRIGHT MLS
- 2026-04-17 Listed $249,990 BRIGHT MLS
- 2026-04-15 Listing Removed — BRIGHT MLS
- 2026-04-06 Price Changed $249,900 BRIGHT MLS
- 2026-03-18 Listed $259,900 BRIGHT MLS
- 2026-03-11 Coming Soon — BRIGHT MLS
Property tax history
+15.4%/yrLatest (2026): $1,698 · +6.9% YoY. Source: county tax records.
Cash-flow waterfall
monthlySold comps — $/sqft
last 12 mo · ≤1 miLoading sold comps…