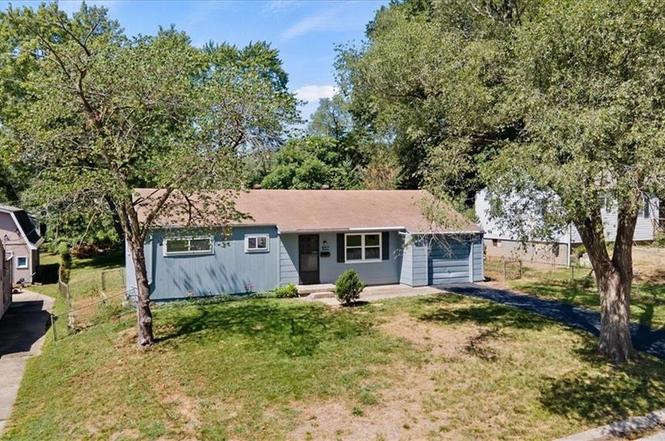
8614 Bristol Ave · Kansas City, MO
Flood risk 1/10 · Minimal
- FEMA flood zone
- X (unshaded)
- Chance of flooding over 30 yrs
- 0.0%
- Est. flood insurance / yr
- $507 – $1,088
Fire risk 1/10 · Minimal
- Est. fire insurance / yr
- $1,054 – $1,958
Heat risk 4/10 · Minor
- Hot days now (above 106°F)
- 7 days/yr
- Hot days in 30 yrs
- 17 days/yr
Wind risk 2/10 · Minimal
- Chance of severe wind over 30 yrs
- —
Air-quality risk 3/10 · Minor
- Unhealthy air days now
- 3 days/yr
- Unhealthy air days in 30 yrs
- 5 days/yr
Risk factors via First Street. Map © Google.
Why this score? — see what drove the D- grade
The composite is a weighted blend of 9 inputs, each scored 0–100. Each bar is that input's sub-score; the figure is the points it added to the 100-point composite (weight × sub-score).
- Cash flow +16.0/30.0
- DSCR +4.9/10.0
- Livability +3.9/5.0
- 1% rule +3.5/10.0
- Rent growth +3.3/5.0
- Condition / age +2.5/5.0
- Schools +1.1/10.0
- ARV discount +0.9/15.0
- Appreciation +0.0/10.0
$174,900
🖨 Deal sheet (PDF) 📄 Offer letter ✓ Due diligence
Listing remarks MLS
OFFER RECEIVED: Calling for highest and best by 6pm 8/29/2023 for offer to be considered! This Beautiful 3-bedroom ranch boasts new carpet and flooring throughout, an updated kitchen with brand new appliances(staying at no added value) and an updated bathroom! Newer windows in the common areas paired with new furnace, A/C as of 2018 makes for nice efficiency and water heater replaced at the same time makes all utilities only 5 years old. Recently upgraded electrical panel. Roof was inspected and given a thumbs up! Mudroom/ Laundry room off the garage leads to a nice sized and fully fenced back yard or into the kitchen. Mature trees provide great shading without branches hovering overhead. Perfect for a first time home buyer, someone downsizing or looking for all main-level living! Ask us about the awesome loan program opportunity for First Time Home Buyers (or buyers who haven't owned for over 3 years!).
Key facts
- New hot water tank
- Laundry mudroom
- Fenced backyard
Tags
Property features AI
Exterior
- Parking: Attached garage (1 car, garage faces front)
- Security: Smoke detector(s)
- Utilities: Public water; Public sewer
- Home design: Single-family residence; Residential property; Ranch style; Facing/front garage
- Construction: Frame construction; Composition roof; Crawl space foundation; Built approximately 51–75 years ago
- Exterior features: Metal fencing; Shed(s); City limits lot; Paved road access
Interior
- Kitchen: Dishwasher; Disposal; Exhaust fan; Refrigerator; Electric range; Eat-in kitchen
- Bedrooms: Three bedrooms on the main level (all carpet)
- Flooring: Carpet; Wood
- Bathrooms: One full bathroom (main level, all carpet)
- Heating & cooling: Natural gas heating; Electric cooling
- Interior features: Ranch floor plan; Smoke detector(s); Family room on main level; Main floor bedrooms
- Laundry & utility: Dryer hookup (electric) on main level
Neighborhood map
What this means for you Summary
Snapshot
- This is a 3-bed/1.0-bath single-family listed at $175k.
Deal economics
- At list price, monthly cash flow is $87 ($1k/yr) — positive.
- The deal already cash-flows at list — no discount required.
- To meet the 1% rule (rent ≥ 1% of price), the offer needs to be $148k (15.2% below list).
- Recommended offer: $148k (15.2% below list) — sets the bar for 1% rule.
- Cap rate 6.9% vs local median 3.9% in Kansas City — top-decile yield for the area; either an underpriced asset or a hidden risk that comps aren't pricing in. Stress-test before assuming the spread holds.
Location & tenants
- Location reads 78/100 on livability (#28 in MO, #2,671 nationally) — a middle-class / working-renter tenant base. Strengths: amenities A+, commute A+, cost of living A+; Watch: crime F.
- Hickman Mills C-1 (urban): math 8% / reading 18% proficiency, ranked #314 of 324 in MO (top 97%) — low school quality limits family demand, transient renter base, plan for 1-2y turnover; 78% free/reduced lunch — lower-income household profile, screen leases tightly.
- Zoned schools: Dobbs Elementary (math 8% / reading 17%, grade F, #1,007 of 1,115 statewide, top 91%, 322 students, 100% FRL); Smith-Hale Middle (math 7% / reading 19%, grade F, #368 of 391 statewide, top 94%, 770 students, 100% FRL); Ruskin High School (math 8% / reading 47%, grade F, #416 of 521 statewide, top 80%, 1,273 students, 100% FRL) — zoned schools average 100% FRL vs 78% district-wide (22 pts higher); higher-poverty schools than district average — tighter screening recommended.
- Market conditions: Rents rising (+3.1%/yr); 140 active listings in the ZIP; 25 comparable units currently listed for rent nearby; rentals at typical pace (median 19d on market — plan ~3-4 weeks tenant-placement turnaround); 4,002 units permitted in Jackson County in 2024 (2,271 in 5+ unit buildings).
- This rent runs 30% of the median local income ($59k/yr) — at the standard rent-burdened threshold; future hikes will face affordability resistance.
Forward outlook
- Local home prices are declining (-3.0%/yr); year-one equity from $1k of loan paydown is wiped out by about $5k of value loss. Plan a longer hold.
- Jackson County population projected at +4% by 2050 — modest demand growth; plan on rents tracking national, not racing it.
Negotiation context
- Only 4 days on market — expect competitive offers; lowballing is unlikely to land.
Risks & watch-outs
- Watch-outs: built in 1955 — expect roof / HVAC / electrical / plumbing capex.
Questions for the listing agent
- Built in 1955 — when were the roof, HVAC, electrical panel, plumbing, and water heater last replaced?
- Is there a deadline driving the sale (1031 exchange, divorce, estate, relocation)? That informs how much negotiation room exists.
- Crime grade is F in this area — have there been break-ins, vandalism, or insurance claims at this property in the last 3 years? What carrier currently insures it and at what premium?
- The area grade is low — what's the realistic commute time and amenity access for the typical tenant pool here? Any planned neighborhood developments (good or bad) we should know about?
- What's the average days-on-market for RENTAL listings here right now (not sales)? A rising rental-DOM trend means longer vacancies and softer asking-rent achievability than the comps imply.
- What's the recent tenant-quality profile in this submarket — average credit score on applications, eviction rate, late-payment / NSF rate, and stable-employment percentage? A property-management company in the area should have these aggregated.
- How much new for-sale + rental construction is in the pipeline within 1–3 miles? Heavy new supply typically softens prices + rents 12–24 months out; constrained supply supports both.
Investment metrics
- 1% rule
- 0.85% ✗
- Cap rate
- 6.89%
- Cash-on-cash
- 2.12%
- DSCR
- 1.09
- GRM
- 9.8
CMA / ARV
- ARV (on-the-fly)
- $152,520
- Comps found
- 12
Show comp detail 12 sales within ~0.75 mi
| Address | Dist | Beds/Ba | Sqft | Sold | Price | $/sf | Match |
|---|---|---|---|---|---|---|---|
| 7211 E 86th St | 0.15mi | 3/1.0 | 984 (0%) | 10mo | $120,000 | $122 | 85 |
| 8616 Winchester Ave | 0.06mi | 3/2.0 | 1,016 (+3%) | 12mo | $139,999 | $138 | 77 |
| 6906 E 86th St | 0.11mi | 3/1.5 | 1,050 (+7%) | 7mo | $170,000 | $162 | 75 |
| 8618 Corrington St | 0.07mi | 3/1.0 | 864 (-12%) | 4mo | $99,000 | $115 | 73 |
| 8703 Manchester Ave | 0.51mi | 3/1.0 | 1,000 (+2%) | 6mo | $130,000 | $130 | 69 |
| 8506 Crystal Ave | 0.22mi | 3/1.0 | 864 (-12%) | 10mo | $139,000 | $161 | 61 |
| 8803 Manchester Ave | 0.58mi | 3/1.0 | 1,040 (+6%) | 6mo | $175,000 | $168 | 59 |
| 8604 Corrington Ave | 0.08mi | 4/2.0 (+1) | 1,130 (+15%) | 6mo | $175,000 | $155 | 58 |
| 6802 E 86th St | 0.16mi | 3/2.0 | 1,128 (+15%) | 8mo | $190,000 | $168 | 58 |
| 8902 Manchester Ave | 0.68mi | 3/1.5 | 1,040 (+6%) | 7mo | $119,000 | $114 | 51 |
| 7718 E 90th Ter | 0.72mi | 3/1.5 | 1,120 (+14%) | 1mo | $165,000 | $147 | 41 |
| 8419 Blue Ridge Blvd | 0.65mi | 2/1.0 (-1) | 1,125 (+14%) | 11mo | $190,000 | $169 | 32 |
Match score weights: distance 35% · size 25% · config 20% · recency 20%. Top-matched comps best support the ARV.
Projected returns pro-forma
-3.0% appreciation · 3.07% rent growth · sell at horizon
- IRR
- -12.9%
- Equity multiple
- 0.54×
- Total profit
- $-22,768
- Equity at exit
- $26,078
- IRR
- -3.8%
- Equity multiple
- 0.74×
- Total profit
- $-12,502
- Equity at exit
- $15,122
Cash invested: $48,972 (down + closing). Projections, not guarantees.
Landlord ↔ Tenant lean methodology
- Overall (STATE)
- 81 Strongly Landlord-Friendly
- State Missouri
- 81 Strongly Landlord-Friendly · R+10
- County
- — inherits STATE
- City
- — inherits STATE
ZIP-level market 64138
- Rents YoY
- 3.1%
- Active inventory
- 140
- Price-to-rent
- 9.8×
Monthly cashflow live
- Estimated rent
- $1,483 high interval (Pro) →
- Mortgage (P&I)
- −$917
- Tax from tax record
- −$95 /mo · $1,141/yr
- Insurance
- −$73
- HOA
- −$0
- Vacancy / Maint / Mgmt
- −$312
- Net cashflow
- $87
Break-even live
Sensitivity live
| Price | -10% $186 | -5% $136 | +0% $87 | +5% $37 | +10% $-12 |
|---|---|---|---|---|---|
| Rent | -10% $-30 | -5% $28 | +0% $87 | +5% $145 | +10% $204 |
| Rate | -1.0pp $175 | -0.5pp $131 | base $87 | +0.5pp $41 | +1.0pp $-5 |
UW: 25.0% down · 7.5% · 30yr · 1.5% tax · 5.0% vac · 8.0% maint · 8.0% mgmt
Financing live
Cash to close
- Down payment
- $43,725
- Closing costs
- $5,247
- Reserves months
- —
- Total cash needed
- —
Loan-product check · same deal, 3 products live
Conventional
25% down · 7.5% · 30yr
- Down + closing
- —
- Monthly P&I
- —
- Monthly cashflow
- —
- DSCR
- —
- Eligible?
- —
Personal DTI + credit; lowest rate.
DSCR
20% down · 8.5% · 30yr
- Down + closing
- —
- Monthly P&I
- —
- Monthly cashflow
- —
- DSCR
- —
- Eligible?
- —
No personal income docs; deal must DSCR.
Hard money
10% down · 12.0% · 12mo
- Down + closing
- —
- Monthly P&I
- —
- Monthly cashflow
- —
- DSCR
- —
- Eligible?
- —
Short-term bridge; refi at stabilization.
Rent comps 25 comps
| Address | Beds | Baths | Sqft | Rent | $/sqft | DOM | Units | Dist |
|---|---|---|---|---|---|---|---|---|
| 8618 Corrington Ave Kansas City, MO | 3.0 | 1.0 | 864 | $1,500 | $1.74 | 6d | 1 | 0.08mi |
| 8608 Crystal Ave Kansas City, MO | 3.0 | 1.0 | 840 | $1,445 | $1.72 | 18d | 1 | 0.13mi |
| 7211 E 87th St Kansas City, MO | 2.0 | 1.0 | 988 | $1,306 | $1.32 | 6d | 1 | 0.17mi |
| 7510 E 85th Ter Kansas City, MO | 1.0–2.0 | 1.0 | 852 | $1,300 | $1.53 | 45d | 1 | 0.45mi |
| 8812 Manchester Ave Kansas City, MO | 3.0 | 1.0 | 1066 | $1,586 | $1.49 | 14d | 1 | 0.63mi |
| 8002 E 88th Pl Kansas City, MO | 3.0 | 2.0 | 984 | $1,495 | $1.52 | 45d | 1 | 0.70mi |
| 7902 E 89th Ter Kansas City, MO | 3.0 | 1.5 | 1068 | $1,516 | $1.42 | 19d | 1 | 0.74mi |
| 8001 E 89th Ter Kansas City, MO | 3.0 | 2.0 | 1014 | $1,545 | $1.52 | 45d | 1 | 0.77mi |
| 5600 E 84th Ter Kansas City, MO | 3.0 | 1.0–2.0 | 878 | $1,350 | $1.54 | 45d | 1 | 0.96mi |
| 9444 Newton Ave Kansas City, MO | 1.0–2.0 | 1.0–1.5 | 957 | $1,300 | $1.36 | 3d | 26 | 0.99mi |
| 9444 Newton Ave Unit 9446D Kansas City, MO | 2.0 | 1.0 | 882 | $1,025 | $1.16 | 19d | 1 | 1.03mi |
| 7929 Sycamore Ave Kansas City, MO | 2.0 | 1.0 | 1044 | $1,200 | $1.15 | 9d | 2 | 1.05mi |
| 9444 Newton Ave Unit 9400A Kansas City, MO | 2.0 | 1.0 | 1008 | $1,155 | $1.15 | 19d | 1 | 1.05mi |
| 9444 Newton Ave Unit 9329C Kansas City, MO | 2.0 | 1.5 | 954 | $1,155 | $1.21 | 19d | 1 | 1.05mi |
| 8600 Everett St Raytown, MO | 3.0 | 1.5 | 956 | $1,550 | $1.62 | 45d | 1 | 1.07mi |
| 8700 E 87th St Raytown, MO | 3.0 | 2.0 | 1032 | $1,481 | $1.44 | 19d | 1 | 1.16mi |
| 8506 E 91st Ter Kansas City, MO | 3.0 | 1.5 | 1020 | $1,450 | $1.42 | 18d | 1 | 1.18mi |
| 8501 E 92nd St Kansas City, MO | 3.0 | 1.5 | 1107 | $1,745 | $1.58 | 25d | 1 | 1.21mi |
| 820 E 93rd Ter Kansas City, MO | 1.0–2.0 | 1.0–2.0 | 1040 | $1,165 | $1.12 | 6d | 1 | 1.23mi |
| 8620 E Utopia Dr Raytown, MO | 1.0–3.0 | 1.0–2.0 | 854 | $1,249 | $1.46 | 3d | 10 | 1.42mi |
| 7704 E 75th Ter Kansas City, MO | 3.0 | 1.0 | 1016 | $1,325 | $1.30 | 18d | 1 | 1.43mi |
| 8713 E 92nd Pl Kansas City, MO | 3.0 | 2.0 | 1073 | $1,550 | $1.44 | 45d | 1 | 1.45mi |
| 8951 E 83rd St Raytown, MO | 4.0 | 2.0 | 926 | $1,516 | $1.64 | 25d | 1 | 1.46mi |
| 9214 Farley Ave Kansas City, MO | 3.0 | 2.0 | 1060 | $1,686 | $1.59 | 14d | 1 | 1.47mi |
| 8622 Lane Ave Unit C Raytown, MO | 2.0 | 1.0 | 872 | $995 | $1.14 | 45d | 1 | 1.49mi |
Listing history 4 events
-
2026-06-21days on market $174,900 Active 4 DOM
-
2026-06-18status $174,900 Active 1 DOM
-
2026-06-18remarks 699-char remark
-
2026-06-18$174,900 Coming Soon 1 DOM
ⓘ Source: listings_history table (triggers on properties + properties_extension) + one-shot
backfill from property_details.listing_events for pre-trigger history.
Tax reassessment forecast MO · Resets to sale price
- Current annual tax
- $1,141 · $95/mo
- Projected year-2 tax
- $1,697 · $141/mo
- Expected delta
- +$556/yr (+$46/mo · 48.7%)
ⓘ Screening estimate from a state-policy table — verify with the county assessor before closing.
Climate risk First Street
- Flood 1/10 Low FEMA zone X (unshaded) · 0% chance over 30 yrs
- Wildfire 1/10 Low
- Heat 4/10 Moderate 7 d/yr ≥106°F today · 17 d/yr by 30 yrs out
- Wind 2/10 Low
- Air quality 3/10 Moderate 3 unhealthy d/yr today · 5 by 30 yrs out
Nearby sold comps map
Loading sold comps map…
Walkable amenities ~0.75 mi
Loading nearby amenities…
Taxation est. · year 1
- Rental income
- $17,800
- − Mortgage interest
- −$9,797
- − Property taxes
- −$1,141
- − Insurance
- −$874
- − Repairs & maintenance
- −$1,424
- − Management
- −$1,424
- − Depreciation
- −$5,088
- Taxable loss
- −$1,948
- Est. tax savings @ 24.0%
- +$468
- After-tax cash flow
- $1,508/yr
For passive investors: Depreciation is non-cash, so a rental often shows a tax loss while cash-flowing — sheltering income. Rental losses are passive: they offset passive income freely, and up to $25,000/yr can offset ordinary (W-2) income if you actively participate and your MAGI is under $100k (phasing out to $0 by $150k); unused losses carry forward. On sale, claimed depreciation is recaptured at up to 25%, and gains may owe capital-gains tax (a 1031 exchange can defer both). Figures are a year-1 estimate at your 24.0% rate — not tax advice; consult a CPA.
Schools (NCES district)
- District
- Hickman Mills C-1
- NCES district ID
- 2914340
- Math proficiency
- 8% ▼ -8.00%
- Reading proficiency
- 18% ▼ -4.00%
- Median HH income
- $40,908
- Composite
- 11.2/100
- National rank
- #9725
- State rank
- #314 of 324 in MO
Livability — Kansas City
- Score
- 78/100
- State rank
- #28
- US rank
- #2671
Category grades
Schools grade is shown separately in the Schools card above.
Census & demographics
- Census place
- Kansas City, MO
- County
- Jackson County · 687,798 people
- City population
- 439,467
- Metro
- Kansas City, MO-KS
- Population (ZIP)
- 23,805
- Household income
- $58,638
- Rent vs Own
- Severe rent burden
- 810.0
Population outlook (Jackson County) Hauer SSP2
- Today (2025)
- 719,589 people
- By 2030
- 731,456 · +1.6%
- By 2040
- 746,689 · +3.8%
- By 2050
- 749,289 · +4.1%
- By 2075
- 736,227 · +2.3%
- By 2100
- 668,210 · -7.1%
Race, ethnicity, and origin ACS 2023
- Neighborhood character
- Diverse neighborhood (Simpson 0.61)
- Race & ethnicity
- Black 46% White 42% Two or more races 6% Hispanic / Latino 5% Asian 2%
- Common ancestry
- Slovak 2% Ukrainian 1% Italian 1%
- Foreign-born
- 6% · Canada, China
- Languages at home
- 91% English-only · Spanish 4% Arabic 3% Other Indo-European 1%
Political lean MEDSL · Jackson
- 2024 margin
- D (+19.3) · D 58.9% · R 39.5% · Other 1.6%
- 2008→2024 swing
- -6.1pp toward R · 2008: 25.4pp · 2024: 19.3pp
- All cycles
- 2024: D+19.3 2020: D+22.0 2016: D+16.6 2012: D+19.0 2008: D+25.4
Not yet ingested
- Civics
- —
Market trends
- HPI YoY
- ▼ -186.34%
- Current HPI
- 274.681
- Rent YoY
- ▲ 3.07%
- Metro
- Kansas City, MO-KS
- State GDP YoY
- ▲ 1.84%
- F500 in state
- 20
Industry mix (Fortune 500 HQ in MO)
| Industry | F500 HQs | Revenue |
|---|---|---|
| Healthcare | 1 | $163B |
|
||
| Insurance | 1 | $21B |
|
||
| Industrial Technology | 1 | $17B |
|
||
| Retail | 1 | $16B |
|
||
| Industrial Distribution | 1 | $10B |
|
||
| Utilities | 1 | $9B |
|
||
Price history
+11.4% since first listed5 events — show timeline
- 2026-06-17 Coming Soon $174,900 Heartland MLS as Distributed by MLS Grid
- 2023-09-20 Sold (Public Records) — Public Records
- 2023-09-19 Sold (MLS) — Heartland MLS as Distributed by MLS Grid
- 2023-08-30 Contingent — Heartland MLS as Distributed by MLS Grid
- 2023-08-18 Listed $156,950 Heartland MLS as Distributed by MLS Grid
Property tax history
+2.9%/yrLatest (2025): $1,141 · -2.5% YoY. Source: county tax records.
Cash-flow waterfall
monthlySold comps — $/sqft
last 12 mo · ≤1 miLoading sold comps…