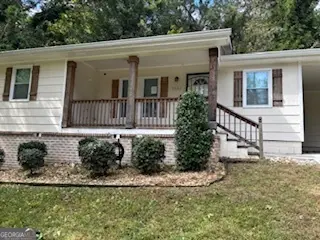
5552 Lakeside Dr · Union City, GA
Flood risk 1/10 · Minimal
- FEMA flood zone
- X (unshaded)
- Chance of flooding over 30 yrs
- 0.0%
- Est. flood insurance / yr
- $473 – $860
Fire risk 1/10 · Minimal
- Est. fire insurance / yr
- $963 – $1,789
Heat risk 5/10 · Moderate
- Hot days now (above 103°F)
- 7 days/yr
- Hot days in 30 yrs
- 18 days/yr
Wind risk 6/10 · Moderate
- Chance of severe wind over 30 yrs
- 27.0%
Air-quality risk 3/10 · Minor
- Unhealthy air days now
- 3 days/yr
- Unhealthy air days in 30 yrs
- 4 days/yr
Risk factors via First Street. Map © Google.
Why this score? — see what drove the A- grade
The composite is a weighted blend of 9 inputs, each scored 0–100. Each bar is that input's sub-score; the figure is the points it added to the 100-point composite (weight × sub-score).
- Cash flow +30.0/30.0
- 1% rule +10.0/10.0
- DSCR +10.0/10.0
- Appreciation +10.0/10.0
- ARV discount +7.5/15.0
- Schools +4.5/10.0
- Rent growth +3.1/5.0
- Livability +2.9/5.0
- Condition / age +2.5/5.0
$119,000
🖨 Deal sheet (PDF) 📄 Offer letter ✓ Due diligence
Listing remarks MLS
Charming and beautifully updated, this 2-bedroom, 2-bath ranch offers comfortable one-level living with modern touches throughout. The renovated kitchen features abundant cabinet storage, sleek stainless-steel appliances perfect for everyday cooking or entertaining. Both bedrooms are generously sized, and each full bath has been refreshed for a clean, contemporary feel. Conveniently located near Hartsfield-Jackson Airport, major interstates, shopping, and dining, this home provides easy access to everything while still offering a peaceful residential setting. Best of all, it's situated outside of an HOA community, giving you added flexibility and freedom.
Key facts
- Renovated kitchen
- 0.35 acre lot
- Parking
Tags
Property features AI
Finance
- HOA & community: Community features: Other
Exterior
- Parking: Carport (1 space)
- Utilities: Public water; Septic tank sewer; Electric service (other)
- Home design: One-level home
- Construction: Brick and other construction materials; Shingle roof; Resale condition
- Exterior features: Front porch; Paved road access
Interior
- Kitchen: Other kitchen features; Appliances listed as other
- Bedrooms: Two main-level bedrooms; Other bedroom features; Master bath with other features
- Flooring: Luxury vinyl flooring
- Bathrooms: Two full bathrooms, both on the main level
- Heating & cooling: Natural gas heat; Central air conditioning
- Interior features: Other interior features; No common walls; Crawl space basement
- Laundry & utility: Laundry located in a bathroom
Neighborhood map
What this means for you Summary
Snapshot
- This is a 2-bed/1.0-bath single-family listed at $119k.
Deal economics
- At list price, monthly cash flow is $699 ($8k/yr) — positive.
- The deal already cash-flows at list — no discount required.
- Meets the 1% rule at list price ($2k rent vs $119k).
- Cap rate 13.3% vs local median 5.4% in Union City — top-decile yield for the area; either an underpriced asset or a hidden risk that comps aren't pricing in. Stress-test before assuming the spread holds.
Location & tenants
- Location reads 58/100 on livability (#443 in GA) — a working-class tenant base; expect higher turnover. Strengths: cost of living A+, housing A+; Watch: crime D+, amenities F, commute F.
- Fulton County (suburban): math 49% / reading 53% proficiency, ranked #12 of 174 in GA (top 7%) — acceptable for families but not a draw, mixed tenant base, ~2y average lease.
- Zoned schools: Liberty Point Elementary School (math 37% / reading 31%, grade F, #554 of 1,228 statewide, top 46%, 694 students, 100% FRL); Camp Creek Middle School (math 17% / reading 32%, grade F, #301 of 470 statewide, top 66%, 644 students, 100% FRL); Langston Hughes High School (math 8% / reading 17%, grade F, #336 of 424 statewide, top 80%, 1,964 students, 65% FRL) — zoned schools average 88% FRL vs 41% district-wide (47 pts higher); higher-poverty schools than district average — tighter screening recommended.
- Zoned-school proficiency averages 24% at this address vs 51% district-wide (-27 pts) — the specific schools serving this property underperform the Fulton County average; the district grade overstates school quality for this exact location.
- Market conditions: Rents rising (+2.2%/yr); 167 active listings in the ZIP; 40 comparable units currently listed for rent nearby; rentals at typical pace (median 25d on market — plan ~3-4 weeks tenant-placement turnaround); 11,565 units permitted in Fulton County in 2024 (8,159 in 5+ unit buildings).
- This rent runs 45% of the median local income ($48k/yr) — at the standard rent-burdened threshold; future hikes will face affordability resistance.
Forward outlook
- In year one you build about $13k of equity ($823 loan paydown + $12k appreciation (10.0% local appreciation)).
- Fulton County population projected at +38% by 2050 — long-run rental-demand tailwind backs the buy-and-hold thesis.
- At projected returns (10.0% appreciation + 2.2% rent growth), your $33k cash investment doubles in ~2 years — after that, you're playing with house money.
- By year 3, paydown + projected appreciation supports a ~$32k cash-out refi (75% LTV) — recoverable capital for the next deal without selling this one.
Negotiation context
- Only 10 days on market — expect competitive offers; lowballing is unlikely to land.
- 14 sale attempts since 6y ago; this cycle's ask has dropped $20k (14%) from the opening price — seller is motivated, your offer sets the floor, not the list.
Risks & watch-outs
- Climate carrying-cost: major wind risk, 27% chance of damaging wind over 30y; extreme-heat days projected 7→18/yr by 2055 (HVAC capex compounding) — expect insurance premiums to compound above CPI over the hold.
Questions for the listing agent
- Built in 1964 — when were the roof, HVAC, electrical panel, plumbing, and water heater last replaced?
- Is there a deadline driving the sale (1031 exchange, divorce, estate, relocation)? That informs how much negotiation room exists.
- Schools are F-rated, which usually means shorter tenancies and higher turnover. Who's the typical renter profile here, and what's been the actual vacancy rate?
- Crime grade is D in this area — have there been break-ins, vandalism, or insurance claims at this property in the last 3 years? What carrier currently insures it and at what premium?
- What's the average days-on-market for RENTAL listings here right now (not sales)? A rising rental-DOM trend means longer vacancies and softer asking-rent achievability than the comps imply.
- What's the recent tenant-quality profile in this submarket — average credit score on applications, eviction rate, late-payment / NSF rate, and stable-employment percentage? A property-management company in the area should have these aggregated.
- How much new for-sale + rental construction is in the pipeline within 1–3 miles? Heavy new supply typically softens prices + rents 12–24 months out; constrained supply supports both.
Investment metrics
- 1% rule
- 1.51% ✓
- Cap rate
- 13.35%
- Cash-on-cash
- 25.19%
- DSCR
- 2.12
- GRM
- 5.5
CMA / ARV
- ARV (median comp)
- $265,024
- List price
- $119,000
- Delta
- -47.55%
- Verdict
- UNDERPRICED
- Comps
- 19 within 1.0 mi
Show comp detail 10 sales within ~0.75 mi
| Address | Dist | Beds/Ba | Sqft | Sold | Price | $/sf | Match |
|---|---|---|---|---|---|---|---|
| 5953 Armour Dr | 0.40mi | 3/2.5 (+1) | 1,536 (-3%) | 5mo | $229,000 | $149 | 61 |
| 5079 Alexander Ave | 0.48mi | 3/2.0 (+1) | 1,436 (-9%) | 7mo | $230,000 | $160 | 47 |
| 4690 Ravenwood Loop | 0.68mi | 3/2.5 (+1) | 1,568 (-1%) | 17mo | $209,000 | $133 | 42 |
| 5550 Union Pointe Pl | 0.48mi | 3/2.5 (+1) | 1,667 (+5%) | 21mo | $255,250 | $153 | 40 |
| 5581 Liberty Rd | 0.36mi | 3/2.0 (+1) | 1,360 (-14%) | 23mo | $244,845 | $180 | 32 |
| 3218 Diamond Blf | 0.66mi | 3/2.5 (+1) | 1,805 (+14%) | 4mo | $249,000 | $138 | 32 |
| 8300 Hunters Grove Rd | 0.45mi | 3/2.5 (+1) | 1,382 (-13%) | 22mo | $233,000 | $169 | 28 |
| 4420 Gladewood Run | 0.67mi | 3/2.5 (+1) | 1,723 (+9%) | 23mo | $258,500 | $150 | 24 |
| 6311 Byrd Rd | 0.59mi | 3/2.0 (+1) | 1,378 (-13%) | 22mo | $364,000 | $264 | 23 |
| 4676 Ravenwood Loop | 0.72mi | 3/2.5 (+1) | 1,817 (+15%) | 15mo | $255,000 | $140 | 18 |
Match score weights: distance 35% · size 25% · config 20% · recency 20%. Top-matched comps best support the ARV.
Projected returns pro-forma
10.0% appreciation · 2.2% rent growth · sell at horizon
- IRR
- 42.8%
- Equity multiple
- 4.24×
- Total profit
- $107,883
- Equity at exit
- $107,205
- IRR
- 36.7%
- Equity multiple
- 9.40×
- Total profit
- $279,782
- Equity at exit
- $231,191
Cash invested: $33,320 (down + closing). Projections, not guarantees.
Landlord ↔ Tenant lean methodology
- Overall (STATE)
- 90 Strongly Landlord-Friendly
- State Georgia
- 90 Strongly Landlord-Friendly · R+3
- County
- — inherits STATE
- City
- — inherits STATE
ZIP-level market 30291
- Home prices YoY
- 11.1%
- Rents YoY
- 2.2%
- Active inventory
- 167
- Price-to-rent
- 5.5×
Monthly cashflow live
- Estimated rent
- $1,793 high interval (Pro) →
- Mortgage (P&I)
- −$624
- Tax from tax record
- −$44 /mo · $526/yr
- Insurance
- −$50
- HOA
- −$0
- Vacancy / Maint / Mgmt
- −$377
- Net cashflow
- $699
Break-even live
Sensitivity live
| Price | -10% $767 | -5% $733 | +0% $699 | +5% $666 | +10% $632 |
|---|---|---|---|---|---|
| Rent | -10% $558 | -5% $629 | +0% $699 | +5% $770 | +10% $841 |
| Rate | -1.0pp $759 | -0.5pp $730 | base $699 | +0.5pp $669 | +1.0pp $637 |
UW: 25.0% down · 7.5% · 30yr · 1.5% tax · 5.0% vac · 8.0% maint · 8.0% mgmt
Financing live
Cash to close
- Down payment
- $29,750
- Closing costs
- $3,570
- Reserves months
- —
- Total cash needed
- —
Loan-product check · same deal, 3 products live
Conventional
25% down · 7.5% · 30yr
- Down + closing
- —
- Monthly P&I
- —
- Monthly cashflow
- —
- DSCR
- —
- Eligible?
- —
Personal DTI + credit; lowest rate.
DSCR
20% down · 8.5% · 30yr
- Down + closing
- —
- Monthly P&I
- —
- Monthly cashflow
- —
- DSCR
- —
- Eligible?
- —
No personal income docs; deal must DSCR.
Hard money
10% down · 12.0% · 12mo
- Down + closing
- —
- Monthly P&I
- —
- Monthly cashflow
- —
- DSCR
- —
- Eligible?
- —
Short-term bridge; refi at stabilization.
Rent comps 40 comps
| Address | Beds | Baths | Sqft | Rent | $/sqft | DOM | Units | Dist |
|---|---|---|---|---|---|---|---|---|
| 5207 Dixie Lake Rd Union City, GA | 3.0 | 2.0 | 1516 | $1,950 | $1.29 | 44d | 1 | 0.33mi |
| 5616 Union Pointe Dr Union City, GA | 2.0 | 2.5 | 1387 | $1,545 | $1.11 | 44d | 1 | 0.35mi |
| 6325 Raymond Ter Union City, GA | 2.0 | 1.0 | 1624 | $1,150 | $0.71 | 44d | 1 | 0.37mi |
| 5530 Union Pointe Pl Union City, GA | 3.0 | 2.0 | 1293 | $1,650 | $1.28 | 18d | 1 | 0.40mi |
| 5950 Stonewall Dr Unit 2 Union City, GA | 3.0 | 1.5 | 1320 | $1,495 | $1.13 | 16d | 1 | 0.43mi |
| 5950 Stonewall Dr Unit 4 Union City, GA | 3.0 | 1.0 | 1320 | $1,445 | $1.09 | 3d | 1 | 0.43mi |
| 5140 Highpoint Rd Apt 27 Union City, GA | 2.0 | 2.5 | 1290 | $1,295 | $1.00 | 13d | 1 | 0.44mi |
| 5458 Union Hill Ct Union City, GA | 3.0 | 2.5 | 1650 | $2,096 | $1.27 | 25d | 1 | 0.55mi |
| 4497 Ravenwood Dr Union City, GA | 3.0 | 2.5 | 1694 | $2,000 | $1.18 | 44d | 1 | 0.67mi |
| 4497 Ravenwood Dr Union City, GA | 3.0 | 2.5 | 1694 | $2,000 | $1.18 | 21d | 1 | 0.67mi |
| 6340 Westbrook Ave Union City, GA | 3.0 | 2.0 | 1800 | $2,100 | $1.17 | 44d | 1 | 0.83mi |
| 6540 Capitol Knl Fairburn, GA | 3.0 | 3.5 | 1458 | $1,920 | $1.32 | 6d | 1 | 0.93mi |
| 6045 Capitol Knl Fairburn, GA | 3.0 | 2.5 | 1366 | $1,600 | $1.17 | 44d | 1 | 0.95mi |
| 4037 Ravenwood Ct Union City, GA | 2.0 | 2.5 | 1394 | $1,595 | $1.14 | 16d | 1 | 1.01mi |
| 4037 Ravenwood Ct Union City, GA | 2.0 | 2.5 | 1394 | $1,595 | $1.14 | 2d | 1 | 1.01mi |
| 4037 Ravenwood Ct Union City, GA | 2.0 | 2.5 | 1394 | $1,625 | $1.17 | 44d | 1 | 1.01mi |
| 4037 Ravenwood Ct Union City, GA | 2.0 | 2.5 | 1394 | $1,595 | $1.14 | 25d | 1 | 1.01mi |
| 4509 Ravenwood Pl Union City, GA | 3.0 | 2.5 | 1394 | $1,970 | $1.41 | 13d | 1 | 1.02mi |
| 4122 Ravenwood Ct Union City, GA | 3.0 | 3.0 | 1394 | $1,849 | $1.33 | 25d | 1 | 1.05mi |
| 12076 Crosswicks Rd Union City, GA | 3.0–4.0 | 2.0–2.5 | 1617 | $2,731 | $1.69 | 2d | 6 | 1.12mi |
| 5201 Summer Brooke Ct Union City, GA | 3.0 | 2.5 | 1484 | $2,000 | $1.35 | 2d | 1 | 1.16mi |
| 4701 Flat Shoals Rd Union City, GA | 3.0 | 2.5–3.0 | 1600 | $1,775 | $1.11 | 3d | 1 | 1.26mi |
| 340 Parkway Rd #340 Union City, GA | 3.0 | 2.5 | 1456 | $1,750 | $1.20 | 4d | 1 | 1.32mi |
| 220 Splitwood Ln Fairburn, GA | 3.0 | 2.0 | 1424 | $1,850 | $1.30 | 6d | 1 | 1.34mi |
| 220 Splitwood Ln Fairburn, GA | 3.0 | 2.0 | 1424 | $1,850 | $1.30 | 21d | 1 | 1.34mi |
| 220 Splitwood Ln Fairburn, GA | 3.0 | 2.0 | 1424 | $1,850 | $1.30 | 44d | 1 | 1.34mi |
| 220 Splitwood Ln Fairburn, GA | 3.0 | 2.0 | 1424 | $1,850 | $1.30 | 25d | 1 | 1.34mi |
| 4659 Shannon Ct Union City, GA | 3.0 | 2.5 | 2030 | $1,945 | $0.96 | 44d | 1 | 1.34mi |
| 12006 Crosswicks Rd Unit 105 Union City, GA | 3.0 | 2.5 | 1413 | $2,455 | $1.74 | 44d | 1 | 1.34mi |
| 12006 Crosswicks Rd Union City, GA | 3.0 | 2.0 | 1413 | $2,545 | $1.80 | 16d | 1 | 1.34mi |
| 4056 Robin Cir Atlanta, GA | 3.0 | 2.5 | 1174 | $1,895 | $1.61 | 25d | 1 | 1.36mi |
| 4062 Robin Cir Atlanta, GA | 3.0 | 3.0 | 1874 | $1,910 | $1.02 | 25d | 1 | 1.37mi |
| 4812 Station Ln Atlanta, GA | 3.0 | 2.5 | 1695 | $2,100 | $1.24 | 2d | 1 | 1.37mi |
| 4223 Reeshemah St Atlanta, GA | 3.0 | 2.5 | 1843 | $1,995 | $1.08 | 6d | 1 | 1.38mi |
| 365 Elder St Fairburn, GA | 3.0 | 2.5 | 1084 | $1,625 | $1.50 | 25d | 1 | 1.38mi |
| 3416 Stonewall Ct Atlanta, GA | 3.0 | 2.5 | 1690 | $2,450 | $1.45 | 25d | 1 | 1.38mi |
| 4064 Robin Cir Atlanta, GA | 3.0 | 2.5 | 1874 | $1,895 | $1.01 | 25d | 1 | 1.38mi |
| 5200 Alexander St Union City, GA | 3.0 | 2.0 | 1221 | $1,695 | $1.39 | 44d | 1 | 1.40mi |
| 4420 Roche St Atlanta, GA | 3.0 | 2.5 | 1622 | $2,130 | $1.31 | 44d | 1 | 1.40mi |
| 5205 Alexander St Union City, GA | 3.0 | 2.0 | 1326 | $1,681 | $1.27 | 44d | 1 | 1.40mi |
Listing history 46 events
-
2026-06-18days on market $119,000 Active 10 DOM
-
2026-06-17days on market $119,000 Active 9 DOM
-
2026-06-16days on market $119,000 Active 8 DOM
-
2026-06-15days on market $119,000 Active 7 DOM
-
2026-06-13pricedays on market $119,000 Active 5 DOM
-
2026-06-08remarks 663-char remark
-
2026-06-08days on market $139,000 Active 1 DOM
-
2026-05-14status Back On Market 821-char remark
-
2026-04-16status Under Contract 821-char remark
-
2026-03-26status Back On Market 821-char remark
-
2026-03-17status Under Contract 821-char remark
-
2026-02-28price $149,000 821-char remark
-
2026-01-28price $158,000 821-char remark
-
2026-01-03price $168,000 821-char remark
-
2025-11-29price $178,000 821-char remark
-
2025-10-24$188,000 New 821-char remark
-
2022-12-08soldstatus $215,000
-
2022-12-01soldstatus $215,000 Closed 441-char remark
-
2022-12-01soldstatus $215,000 Sold
-
2022-10-31status Under Contract
-
2022-10-27$219,000 Active 441-char remark
-
2022-10-27$219,000 New
-
2021-10-19soldstatus $170,000
-
2021-09-27soldstatus $170,000 Closed
-
2021-09-27soldstatus $170,000 Sold
-
2021-09-27status Under Contract
-
2021-08-25status Under Contract
-
2021-08-25status Pending
-
2021-08-16status Active
-
2021-08-16status Back on Market
-
2021-08-12historical Active Under Contract
-
2021-08-12status Under Contract
-
2021-08-03$165,500 Active
-
2021-08-03$165,500 New
-
2021-03-04soldstatus $143,250
-
2021-02-12status Under Contract
-
2021-02-11soldstatus $143,250 Sold
-
2021-01-20$144,900 New
-
2020-10-27soldstatus $83,000
-
2020-10-20soldstatus $83,000 Closed
-
2020-10-20soldstatus $83,000 Sold
-
2020-10-16status Under Contract
-
2020-10-16status Pending
-
2020-09-11$89,900 Active
-
2020-09-11$89,900 New
-
2020-07-15soldstatus $50,000
ⓘ Source: listings_history table (triggers on properties + properties_extension) + one-shot
backfill from property_details.listing_events for pre-trigger history.
Tax reassessment forecast GA · Resets to sale price
- Current annual tax
- $526 · $44/mo
- Projected year-2 tax
- $1,095 · $91/mo
- Expected delta
- +$569/yr (+$47/mo · 108.0%)
ⓘ Screening estimate from a state-policy table — verify with the county assessor before closing.
Climate risk First Street
- Flood 1/10 Low FEMA zone X (unshaded) · 0% chance over 30 yrs
- Wildfire 1/10 Low
- Heat 5/10 Major 7 d/yr ≥103°F today · 18 d/yr by 30 yrs out
- Wind 6/10 Major 27% chance of damaging wind over 30 yrs
- Air quality 3/10 Moderate 3 unhealthy d/yr today · 4 by 30 yrs out
Nearby sold comps map
Loading sold comps map…
Walkable amenities ~0.75 mi
Loading nearby amenities…
Taxation est. · year 1
- Rental income
- $21,522
- − Mortgage interest
- −$6,666
- − Property taxes
- −$526
- − Insurance
- −$595
- − Repairs & maintenance
- −$1,722
- − Management
- −$1,722
- − Depreciation
- −$3,462
- Taxable income
- $6,829
- Est. tax owed @ 24.0%
- −$1,639
- After-tax cash flow
- $6,753/yr
For passive investors: Depreciation is non-cash, so a rental often shows a tax loss while cash-flowing — sheltering income. Rental losses are passive: they offset passive income freely, and up to $25,000/yr can offset ordinary (W-2) income if you actively participate and your MAGI is under $100k (phasing out to $0 by $150k); unused losses carry forward. On sale, claimed depreciation is recaptured at up to 25%, and gains may owe capital-gains tax (a 1031 exchange can defer both). Figures are a year-1 estimate at your 24.0% rate — not tax advice; consult a CPA.
Schools (NCES district)
- District
- Fulton County
- NCES district ID
- 1302280
- Math proficiency
- 49% ▼ -2.00%
- Reading proficiency
- 53% ▬ 0.00%
- Median HH income
- $68,035
- Composite
- 45.33/100
- National rank
- #2640
- State rank
- #12 of 174 in GA
Livability — Union City
- Score
- 58/100
- State rank
- #443
- US rank
- #21281
Category grades
Schools grade is shown separately in the Schools card above.
Census & demographics
- Census place
- Union City, GA
- County
- Fulton County · 1,094,430 people
- City population
- 25,130
- Metro
- Atlanta-Sandy Springs-Alpharetta, GA
- Population (ZIP)
- 25,130
- Household income
- $48,184
- Rent vs Own
- Severe rent burden
- 1778.0
Population outlook (Fulton County) Hauer SSP2
- Today (2025)
- 1,203,707 people
- By 2030
- 1,299,706 · +8.0%
- By 2040
- 1,488,256 · +23.6%
- By 2050
- 1,664,580 · +38.3%
- By 2075
- 2,036,072 · +69.2%
- By 2100
- 2,222,402 · +84.6%
Race, ethnicity, and origin ACS 2023
- Neighborhood character
- Predominantly Black (86%)
- Race & ethnicity
- Black 86% Hispanic / Latino 7% Two or more races 6% White 3%
- Hispanic origin (detail)
- Mexican 4%
- Common ancestry
- Italian 1%
- Foreign-born
- 5% · Canada
- Languages at home
- 92% English-only · Spanish 6%
Political lean MEDSL · Fulton
- 2024 margin
- Solid D (+44.9) · D 71.9% · R 27.0% · Other 1.1%
- 2008→2024 swing
- +9.8pp toward D · 2008: 35.0pp · 2024: 44.9pp
- All cycles
- 2024: D+44.9 2020: D+46.4 2016: D+42.1 2012: D+29.6 2008: D+35.0
Not yet ingested
- Civics
- —
Market trends
- HPI YoY
- ▲ 23.98%
- Current HPI
- 239.3471
- Rent YoY
- ▲ 2.20%
- Metro
- Atlanta-Sandy Springs-Alpharetta, GA
- State GDP YoY
- ▲ 2.66%
- F500 in state
- 28
Industry mix (Fortune 500 HQ in GA)
| Industry | F500 HQs | Revenue |
|---|---|---|
| Paper / Packaging | 2 | $29B |
|
||
| Retail | 1 | $160B |
|
||
| Transportation / Logistics | 1 | $91B |
|
||
| Airlines | 1 | $62B |
|
||
| Consumer Goods | 1 | $47B |
|
||
| Utilities | 1 | $25B |
|
||
Price history
+138.0% since first listed45 events — show timeline
- 2026-06-10 Price Changed $119,000 GAMLS
- 2026-06-10 Price Changed $119,000 FMLS
- 2026-06-04 Listed $139,000 FMLS
- 2026-06-04 Listed $139,000 GAMLS
- 2026-05-28 Listing Removed — GAMLS
- 2026-05-23 Price Changed $139,000 GAMLS
- 2026-05-14 Relisted — GAMLS
- 2026-04-16 Pending — GAMLS
- 2026-03-26 Relisted — GAMLS
- 2026-03-17 Pending — GAMLS
- 2026-02-28 Price Changed $149,000 GAMLS
- 2026-01-28 Price Changed $158,000 GAMLS
- 2026-01-03 Price Changed $168,000 GAMLS
- 2025-11-29 Price Changed $178,000 GAMLS
- 2025-10-24 Listed $188,000 GAMLS
- 2022-12-08 Sold (Public Records) $215,000 Public Records
- 2022-12-01 Sold (MLS) $215,000 GAMLS
- 2022-12-01 Sold (MLS) $215,000 FMLS
- 2022-10-31 Pending — GAMLS
- 2022-10-27 Listed $219,000 GAMLS
- 2022-10-27 Listed $219,000 FMLS
- 2021-10-19 Sold (Public Records) $170,000 Public Records
- 2021-09-27 Sold (MLS) $170,000 GAMLS
- 2021-09-27 Sold (MLS) $170,000 FMLS
- 2021-09-27 Pending — GAMLS
- 2021-08-25 Pending — GAMLS
- 2021-08-25 Pending — FMLS
- 2021-08-16 Relisted — FMLS
- 2021-08-16 Relisted — GAMLS
- 2021-08-12 Contingent — FMLS
- 2021-08-12 Pending — GAMLS
- 2021-08-03 Listed $165,500 GAMLS
- 2021-08-03 Listed $165,500 FMLS
- 2021-03-04 Sold (Public Records) $143,250 Public Records
- 2021-02-12 Pending — GAMLS
- 2021-02-11 Sold (MLS) $143,250 GAMLS
- 2021-01-20 Listed $144,900 GAMLS
- 2020-10-27 Sold (Public Records) $83,000 Public Records
- 2020-10-20 Sold (MLS) $83,000 GAMLS
- 2020-10-20 Sold (MLS) $83,000 FMLS
- 2020-10-16 Pending — GAMLS
- 2020-10-16 Pending — FMLS
- 2020-09-11 Listed $89,900 GAMLS
- 2020-09-11 Listed $89,900 FMLS
- 2020-07-15 Sold (Public Records) $50,000 Public Records
Property tax history
-0.2%/yrLatest (2025): $526 · +6128.0% YoY. Source: county tax records.
Cash-flow waterfall
monthlySold comps — $/sqft
last 12 mo · ≤1 miLoading sold comps…