 Multi-family
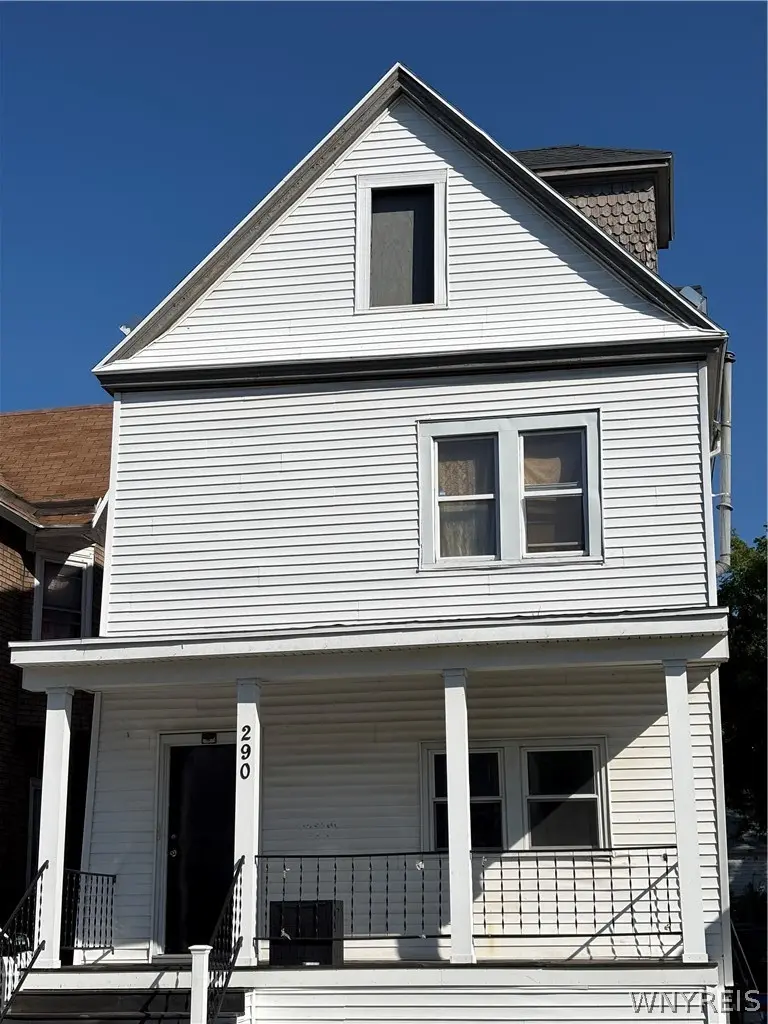
290 Massachusetts Ave · Buffalo, NY
Flood risk 7/10 · Major
- FEMA flood zone
- X (unshaded)
- Chance of flooding over 30 yrs
- 0.76%
- Est. flood insurance / yr
- $473 – $860
Fire risk 1/10 · Minimal
- Est. fire insurance / yr
- $691 – $1,283
Heat risk 3/10 · Minor
- Hot days now (above 91°F)
- 7 days/yr
- Hot days in 30 yrs
- 15 days/yr
Wind risk 1/10 · Minimal
- Chance of severe wind over 30 yrs
- —
Air-quality risk 4/10 · Minor
- Unhealthy air days now
- 4 days/yr
- Unhealthy air days in 30 yrs
- 9 days/yr
Risk factors via First Street. Map © Google.
Why this score? — see what drove the A grade
The composite is a weighted blend of 9 inputs, each scored 0–100. Each bar is that input's sub-score; the figure is the points it added to the 100-point composite (weight × sub-score).
- Cash flow +30.0/30.0
- ARV discount +15.0/15.0
- 1% rule +10.0/10.0
- DSCR +10.0/10.0
- Appreciation +8.8/10.0
- Livability +3.9/5.0
- Schools +3.3/10.0
- Condition / age +2.5/5.0
- Rent growth +2.4/5.0
$239,900
🖨 Deal sheet 📄 Offer letter ✓ Due diligence
Multi-family units
County records classify this as Multi-Family (2-4 Unit). Listing-text estimate: 1 unit. estimate disagrees with records
Listing remarks
* * * Turn Key investement oportunity. * * * * This fully rented with quality tenants building was fully renovated 4 years ago. New roof, new windows, new siding, new front porch, new hot water tanks, new space heaters in upper units, new hot water baseboard heat lower units, new bathrooms, new kitchens new flooring, updated elctrical, and much more. Don't miss out on this money maker opportunity or live in one unit and have the others pay your mortgage.
Key facts
- Fully renovated
- New siding
- New front porch
Tags
Property features AI
Finance
- Financial info: Owner pays grounds care, trash collection, and water; Operating expenses include maintenance, trash, and water/sewer; Rents: two 1-bed units at $750 each (one month-to-month, one leased through 3/31/2025), one 3-bed unit at $1,350 (leased through 12/31/2024)
Exterior
- Parking: No driveway
- Utilities: Public water connected; Sewer connected
- Home design: Two-story building; Resale property; Vinyl siding
- Construction: Vinyl siding construction
- Exterior features: Rectangular residential lot; City street frontage
Interior
- Kitchen: Dining area with kitchen in two of the units; Kitchens included in all units
- Bedrooms: Two 1-bedroom units; one 3-bedroom unit
- Flooring: Luxury vinyl
- Bathrooms: Three full bathrooms (one per unit)
- Heating & cooling: Gas heating; Baseboard heating; Radiant heating; Space heaters
- Interior features: Crawl space and partial basement; Luxury vinyl flooring; Gas water heater
- Laundry & utility: Separate gas meters for each unit; Separate electric meters for each unit
Neighborhood map
What this means for you Summary
Snapshot
- This is a 5-bed/3.0-bath multifamily listed at $240k.
Deal economics
- At list price, monthly cash flow is $2k ($19k/yr) — positive.
- The deal already cash-flows at list — no discount required.
- Meets the 1% rule at list price ($4k rent vs $240k).
- Cap rate 14.4% vs local median 8.0% in Buffalo — top-decile yield for the area; either an underpriced asset or a hidden risk that comps aren't pricing in. Stress-test before assuming the spread holds.
Location & tenants
- Location reads 77/100 on livability (#195 in NY, #3,011 nationally) — a middle-class / working-renter tenant base. Strengths: commute A+, housing A+, health & safety A+; Watch: crime F, employment D-.
- Buffalo City School District (urban): math 41% / reading 40% proficiency, ranked #535 of 590 in NY (top 91%) — families likely to look elsewhere, expect single-tenant / working-renter base with shorter leases; 75% free/reduced lunch — lower-income household profile, screen leases tightly.
- Market conditions: Rents soft (-0.5%/yr); 137 active listings in the ZIP; 4 comparable units currently listed for rent nearby; rentals lingering (median 44d on market — plan ~5-8 weeks vacancy on turnover, expect pricing pressure); 50% of comp listings sitting > 30 days — soft ceiling on asking rent; 1,244 units permitted in Erie County in 2024 (563 in 5+ unit buildings).
- At $3,849/mo this rent would consume 86% of the median local household income ($54k/yr) (locally 1501% of renters already pay >50% of income on rent) — very limited rent-growth headroom before tenants either downsize or default.
Forward outlook
- In year one you build about $20k of equity ($2k loan paydown + $18k appreciation (7.5% local appreciation)).
- At projected returns (7.5% appreciation + 0.0% rent growth), your $67k cash investment doubles in ~2 years — after that, you're playing with house money.
- By year 2, paydown + projected appreciation supports a ~$31k cash-out refi (75% LTV) — recoverable capital for the next deal without selling this one.
Negotiation context
- Only 14 days on market — expect competitive offers; lowballing is unlikely to land.
- 5 sale attempts since 11y ago with the ask held roughly flat each time — persistent listings suggest the price (not the market) is what's stuck; bring a comps-based counter.
- Current owner paid $35k; list at $240k implies a 585% gain — meaningful room to come down on a strong offer.
Risks & watch-outs
- Watch-outs: flood insurance adds $56/mo; built in 1875 — expect roof / HVAC / electrical / plumbing capex.
- Climate carrying-cost: major flood risk — expect insurance premiums to compound above CPI over the hold.
Questions for the listing agent
- Built in 1875 — when were the roof, HVAC, electrical panel, plumbing, and water heater last replaced?
- What's the actual annual flood-insurance premium (NFIP or private), and is the property in a SFHA with mandatory coverage?
- Is there a deadline driving the sale (1031 exchange, divorce, estate, relocation)? That informs how much negotiation room exists.
- Crime grade is F in this area — have there been break-ins, vandalism, or insurance claims at this property in the last 3 years? What carrier currently insures it and at what premium?
- What's the average days-on-market for RENTAL listings here right now (not sales)? A rising rental-DOM trend means longer vacancies and softer asking-rent achievability than the comps imply.
- What's the recent tenant-quality profile in this submarket — average credit score on applications, eviction rate, late-payment / NSF rate, and stable-employment percentage? A property-management company in the area should have these aggregated.
- How much new apartment / multifamily construction is in the pipeline within 1–3 miles? Heavy new supply (>2% of stock underway) typically softens rents 12–24 months out; light construction supports rent growth.
Investment metrics
- 1% rule
- 1.60% ✓
- Cap rate
- 14.38%
- Cash-on-cash
- 28.87%
- DSCR
- 2.28
- GRM
- 5.2
CMA / ARV
- ARV (on-the-fly)
- $319,424
- Comps found
- 12
Show comp detail 12 sales within ~0.75 mi
| Address | Dist | Beds/Ba | Sqft | Sold | Price | $/sf | Match |
|---|---|---|---|---|---|---|---|
| 715 Prospect Ave | 0.42mi | 6/2.0 (+1) | 2,867 (+0%) | 6mo | $232,500 | $81 | 65 |
| 288 14th St | 0.25mi | 5/2.0 | 2,616 (-8%) | 6mo | $260,000 | $99 | 65 |
| 215 Normal Ave | 0.39mi | 5/2.0 | 2,626 (-8%) | 7mo | $294,000 | $112 | 59 |
| 207 Rhode Island St | 0.26mi | 5/2.0 | 2,436 (-15%) | 2mo | $295,500 | $121 | 58 |
| 492 Normal Ave | 0.20mi | 4/2.0 (-1) | 2,530 (-11%) | 8mo | $120,000 | $47 | 57 |
| 395 Hampshire St | 0.29mi | 5/2.0 | 2,438 (-14%) | 3mo | $165,500 | $68 | 56 |
| 187 Auburn Ave | 0.49mi | 5/2.0 | 2,588 (-9%) | 7mo | $289,000 | $112 | 52 |
| 1130 West Ave | 0.73mi | 6/3.0 (+1) | 2,715 (-5%) | 8mo | $235,000 | $87 | 47 |
| 404 Jersey St | 0.66mi | 4/2.5 (-1) | 2,640 (-7%) | 6mo | $392,500 | $149 | 45 |
| 26 York St | 0.56mi | 6/2.0 (+1) | 2,519 (-12%) | 1mo | $199,900 | $79 | 44 |
| 324 West Ave | 0.74mi | 6/2.0 (+1) | 2,652 (-7%) | 5mo | $312,500 | $118 | 41 |
| 383 Summer St | 0.61mi | 5/2.0 | 2,468 (-14%) | 6mo | $492,000 | $199 | 40 |
Match score weights: distance 35% · size 25% · config 20% · recency 20%. Top-matched comps best support the ARV.
Projected returns pro-forma
7.51% appreciation · 0.0% rent growth · sell at horizon
- IRR
- 39.6%
- Equity multiple
- 3.67×
- Total profit
- $179,438
- Equity at exit
- $174,353
- IRR
- 34.4%
- Equity multiple
- 7.34×
- Total profit
- $425,961
- Equity at exit
- $338,809
Cash invested: $67,172 (down + closing). Projections, not guarantees.
Landlord ↔ Tenant lean methodology
- Overall (STATE)
- 15 Strongly Tenant-Friendly
- State New York
- 15 Strongly Tenant-Friendly · D+10
- County
- — inherits STATE
- City
- — inherits STATE
ZIP-level market 14213
- Home prices YoY
- 1.7%
- Rents YoY
- -0.5%
- Active inventory
- 137
- Price-to-rent
- 15.6×
Monthly cashflow live
- Estimated rent
- $3,849 high interval (Pro) →
- Mortgage (P&I)
- −$1,258
- Tax from tax record
- −$67 /mo · $802/yr
- Insurance
- −$100
- Flood insurance flood zone
- −$56 /mo · $666/yr
- HOA
- −$0
- Vacancy / Maint / Mgmt
- −$808
- Net cashflow
- $1,560
Break-even live
3-unit breakdown (identical units grouped — click to expand)
| Units | Beds | Baths | Est. rent |
|---|---|---|---|
| 3× units | 2 | 1 | $3,849 |
| #1 | 2 | 1 | $1,283 |
| #2 | 2 | 1 | $1,283 |
| #3 | 2 | 1 | $1,283 |
| Total (3 units) | $3,849 | ||
UW: 25.0% down · 7.5% · 30yr · 1.5% tax · 5.0% vac · 8.0% maint · 8.0% mgmt
Financing live
Cash to close
- Down payment
- $59,975
- Closing costs
- $7,197
- Reserves months
- —
- Total cash needed
- —
Loan-product check · same deal, 3 products live
Conventional
25% down · 7.5% · 30yr
- Down + closing
- —
- Monthly P&I
- —
- Monthly cashflow
- —
- DSCR
- —
- Eligible?
- —
Personal DTI + credit; lowest rate.
DSCR
20% down · 8.5% · 30yr
- Down + closing
- —
- Monthly P&I
- —
- Monthly cashflow
- —
- DSCR
- —
- Eligible?
- —
No personal income docs; deal must DSCR.
Hard money
10% down · 12.0% · 12mo
- Down + closing
- —
- Monthly P&I
- —
- Monthly cashflow
- —
- DSCR
- —
- Eligible?
- —
Short-term bridge; refi at stabilization.
Rent comps 4 comps
| Address | Beds | Baths | Sqft | Rent | $/sqft | DOM | Units | Dist |
|---|---|---|---|---|---|---|---|---|
| 11 Hoyt St Buffalo, NY | 4.0 | 1.0 | 2848 | $1,775 | $0.62 | 14d | 1 | 0.40mi |
| 184 14th St Buffalo, NY | 4.0 | 2.0 | 1950 | $4,400 | $2.26 | 23d | 1 | 0.42mi |
| 664 Auburn Ave Unit 1 Buffalo, NY | 4.0 | 2.5 | 3500 | $5,000 | $1.43 | 43d | 1 | 0.94mi |
| 836 Richmond Ave Buffalo, NY | 4.0 | 3.5 | 1982 | $4,500 | $2.27 | 43d | 1 | 1.16mi |
Listing history 11 events
-
2026-06-18days on market $239,900 Active 14 DOM
-
2026-06-17days on market $239,900 Active 13 DOM
-
2026-06-16days on market $239,900 Active 12 DOM
-
2026-06-15days on market $239,900 Active 11 DOM
-
2026-06-13days on market $239,900 Active 9 DOM
-
2026-06-13days on market $239,900 Active 8 DOM
-
2026-06-10days on market $239,900 Active 6 DOM
-
2026-06-09days on market $239,900 Active 5 DOM
-
2026-06-08days on market $239,900 Active 4 DOM
-
2026-06-07remarks 464-char remark
-
2026-06-07$239,900 Active 3 DOM
ⓘ Source: listings_history table (triggers on properties + properties_extension) + one-shot
backfill from property_details.listing_events for pre-trigger history.
Tax reassessment forecast NY · Partial reset (capped growth)
- Current annual tax
- $802 · $67/mo
- Projected year-2 tax
- $2,428 · $202/mo
- Expected delta
- +$1,626/yr (+$135/mo · 202.6%)
ⓘ Screening estimate from a state-policy table — verify with the county assessor before closing.
Climate risk First Street
- Flood 7/10 Severe FEMA zone X (unshaded) · 76% chance over 30 yrs
- Wildfire 1/10 Low
- Heat 3/10 Moderate 7 d/yr ≥91°F today · 15 d/yr by 30 yrs out
- Wind 1/10 Low
- Air quality 4/10 Moderate 4 unhealthy d/yr today · 9 by 30 yrs out
Nearby sold comps map
Loading sold comps map…
Walkable amenities ~0.75 mi
Loading nearby amenities…
Taxation est. · year 1
- Rental income
- $46,188
- − Mortgage interest
- −$13,438
- − Property taxes
- −$802
- − Insurance
- −$1,866
- − Repairs & maintenance
- −$3,695
- − Management
- −$3,695
- − Depreciation
- −$6,979
- Taxable income
- $15,712
- Est. tax owed @ 24.0%
- −$3,771
- After-tax cash flow
- $14,952/yr
For passive investors: Depreciation is non-cash, so a rental often shows a tax loss while cash-flowing — sheltering income. Rental losses are passive: they offset passive income freely, and up to $25,000/yr can offset ordinary (W-2) income if you actively participate and your MAGI is under $100k (phasing out to $0 by $150k); unused losses carry forward. On sale, claimed depreciation is recaptured at up to 25%, and gains may owe capital-gains tax (a 1031 exchange can defer both). Figures are a year-1 estimate at your 24.0% rate — not tax advice; consult a CPA.
Schools (NCES district)
- District
- Buffalo City School District
- NCES district ID
- 3605850
- Math proficiency
- 41% ▲ 11.00%
- Reading proficiency
- 40% ▲ 7.00%
- Median HH income
- $31,665
- Composite
- 33.17/100
- National rank
- #5544
- State rank
- #535 of 590 in NY
Livability — Buffalo
- Score
- 77/100
- State rank
- #195
- US rank
- #3011
Category grades
Schools grade is shown separately in the Schools card above.
Census & demographics
- Census place
- Buffalo, NY
- County
- Erie County · 714,559 people
- City population
- 440,021
- Metro
- Buffalo-Cheektowaga, NY
- Population (ZIP)
- 24,107
- Household income
- $53,870
- Rent vs Own
- Severe rent burden
- 1501.0
Population outlook (Erie County) Hauer SSP2
- Today (2025)
- 933,037 people
- By 2030
- 935,181 · +0.2%
- By 2040
- 928,531 · -0.5%
- By 2050
- 905,725 · -2.9%
- By 2075
- 834,037 · -10.6%
- By 2100
- 708,033 · -24.1%
Race, ethnicity, and origin ACS 2023
- Neighborhood character
- Highly diverse neighborhood (Simpson 0.70)
- Race & ethnicity
- White 46% Hispanic / Latino 20% Black 18% Asian 12% Two or more races 10%
- Hispanic origin (detail)
- Mexican 1% Puerto Rican 16% Dominican 1%
- Common ancestry
- Romanian 6% Slovak 3% Lithuanian 3%
- Foreign-born
- 16% · Philippines, Canada, India
- Languages at home
- 68% English-only · Spanish 12% Other Asian/Pacific 7% Arabic 3%
Political lean MEDSL · Erie
- 2024 margin
- Lean D (+9.7) · D 54.8% · R 45.2%
- 2008→2024 swing
- -7.9pp toward R · 2008: 17.5pp · 2024: 9.7pp
- All cycles
- 2024: D+9.7 2020: D+14.7 2016: D+4.8 2012: D+15.6 2008: D+17.5
Not yet ingested
- Civics
- —
Market trends
- HPI YoY
- ▲ 7.51%
- Current HPI
- 448.4879
- Rent YoY
- ▼ -0.49%
- Metro
- Buffalo-Cheektowaga, NY
- State GDP YoY
- ▲ 2.60%
- F500 in state
- 92
Industry mix (Fortune 500 HQ in NY)
| Industry | F500 HQs | Revenue |
|---|---|---|
| Financial Services | 10 | $950B |
|
||
| Consumer Goods | 9 | $162B |
|
||
| Insurance | 4 | $225B |
|
||
| Telecommunications | 2 | $144B |
|
||
| Pharmaceuticals | 2 | $112B |
|
||
| Media / Entertainment | 2 | $69B |
|
||
Price history
+434.3% since first listed10 events — show timeline
- 2026-06-04 Listed $239,900 WNYREIS
- 2025-11-12 Listing Removed — WNYREIS
- 2025-09-19 Listed $239,900 WNYREIS
- 2025-06-17 Listing Removed — WNYREIS
- 2025-04-03 Listed $279,900 WNYREIS
- 2024-11-21 Listing Removed — WNYREIS
- 2024-06-24 Listed $299,900 WNYREIS
- 2015-06-05 Sold (Public Records) $35,000 Public Records
- 2015-06-05 Sold (MLS) $35,000 WNYREIS
- 2015-01-22 Listed $44,900 WNYREIS
Property tax history
+12.0%/yrLatest (2025): $802 · +10.1% YoY. Source: county tax records.
Cash-flow waterfall
monthlySold comps — $/sqft
last 12 mo · ≤1 miLoading sold comps…