20065 County Road 628 · Montmorency, MI
Flood risk 1/10 · Minimal
- FEMA flood zone
- —
- Chance of flooding over 30 yrs
- 0.0%
- Est. flood insurance / yr
- —
Fire risk 4/10 · Minor
- Est. fire insurance / yr
- $784 – $1,456
Heat risk 1/10 · Minimal
- Hot days now (above 94°F)
- 7 days/yr
- Hot days in 30 yrs
- 13 days/yr
Wind risk 1/10 · Minimal
- Chance of severe wind over 30 yrs
- —
Air-quality risk 1/10 · Minimal
- Unhealthy air days now
- 0 days/yr
- Unhealthy air days in 30 yrs
- 0 days/yr
Risk factors via First Street. Map © Google.
Why this score? — see what drove the C- grade
The composite is a weighted blend of 9 inputs, each scored 0–100. Each bar is that input's sub-score; the figure is the points it added to the 100-point composite (weight × sub-score).
- ARV discount +15.0/15.0
- Cash flow +10.1/30.0
- Appreciation +10.0/10.0
- DSCR +2.9/10.0
- Schools +2.6/10.0
- Rent growth +2.5/5.0
- Livability +2.5/5.0
- Condition / age +2.5/5.0
- 1% rule +2.0/10.0
$140,000
🖨 Deal sheet (PDF) 📄 Offer letter ✓ Due diligence
Listing remarks
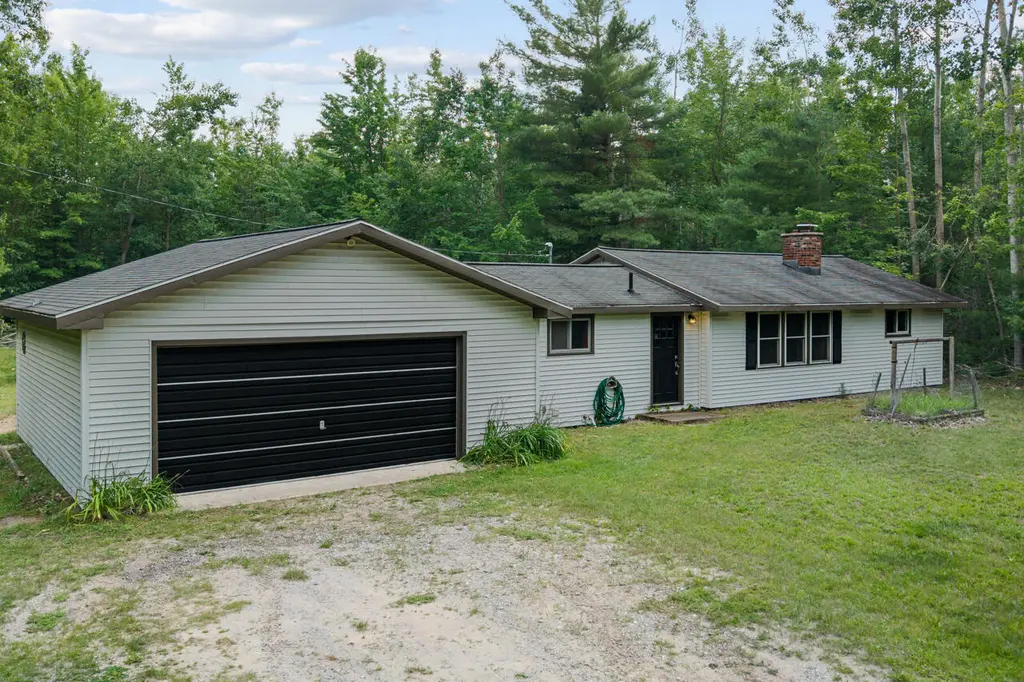
Back on the market after some repairs is this CHARMING 2-bedroom, 1.5 bath, 1 acre home featuring an open floor plan, attached garage and main level laundry! Enjoy relaxing in the spacious living area with a beautiful wood-burning fireplace and large windows to take in all the nature. Offering a seamless flow into the kitchen and dining area perfect for entertaining. With plenty of closets for storage this home is practical as it is peaceful. Outdoors you'll find your own shooting range, plus 1,100 acres of state land less than a half mile away! Multiple public lakes just minutes away, this home is dream for outdoor lovers. Square footage is approximate and should be verified by the buyer o
Key facts
- Open floor plan
- Main level laundry
- Public lakes
Tags
Property features AI
Exterior
- Parking: Attached garage; 2 garage spaces
- Utilities: Well water; Septic tank
- Home design: Single family residence; Residential property
- Construction: Crawl space / no basement
- Exterior features: Dirt road access; 1-acre lot; Lot dimensions approximately 200 x 397 x 200 x 399; Zoned residential
Interior
- Kitchen: Oven; Range; Microwave; Refrigerator; Dishwasher
- Bathrooms: 1 full bathroom; 1 half bathroom
- Heating & cooling: Baseboard heating; Wood heating; Additional heating details: see remarks; Ceiling fan(s) for cooling
- Interior features: Fireplace; Ceiling fan(s)
- Laundry & utility: Washer; Dryer; Laundry on main level
Neighborhood map
What this means for you Summary
Snapshot
- This is a 2-bed/1.5-bath single-family listed at $140k.
Deal economics
- At list price, monthly cash flow is $-81 ($-970/yr) — negative.
- To cash-flow at today's rent, offer at most $126k (10.2% below list).
- To meet the 1% rule (rent ≥ 1% of price), the offer needs to be $98k (30.1% below list).
- Recommended offer: $98k (30.1% below list) — sets the bar for 1% rule.
Location & tenants
- Location reads: area grade C — affects rentability + tenant quality, not the cash-flow math above.
- Hillman Community Schools (rural): math 22% / reading 40% proficiency, ranked #361 of 540 in MI (top 67%) — families likely to look elsewhere, expect single-tenant / working-renter base with shorter leases.
- Zoned schools: Hillman Elementary School (math 17% / reading 27%, grade F, #1,035 of 1,397 statewide, top 77%, 187 students, 61% FRL); Hillman Community Jrsr High School (math 27% / reading 47%, grade F, #334 of 713 statewide, top 51%, 228 students, 50% FRL) — zoned schools at 55% FRL track the district average.
- Market conditions: 38 active listings in the ZIP.
Forward outlook
- In year one you build about $15k of equity ($968 loan paydown + $14k appreciation (10.0% local appreciation)).
- Montmorency County population projected at -38% by 2050 — secular population decline; favor cash flow + early exit over multi-decade hold.
- At projected returns (10.0% appreciation + 3.0% rent growth), your $39k cash investment doubles in ~3 years — after that, you're playing with house money.
- By year 3, paydown + projected appreciation supports a ~$38k cash-out refi (75% LTV) — recoverable capital for the next deal without selling this one.
Negotiation context
- It's been on market 32 days — a 3% lower offer ($136k) is reasonable based on typical stale-listing flexibility.
- Current owner paid $65k; list at $140k implies a 115% gain — meaningful room to come down on a strong offer.
Questions for the listing agent
- What do current leases actually rent for vs. the listed asking? Can we see a recent rent roll and the last 12 months of T-12 income?
- It's been on market 32 days. Have you received any prior offers? Is the seller open to a 30% concession, seller financing, or rate buy-down credit?
- Is there a deadline driving the sale (1031 exchange, divorce, estate, relocation)? That informs how much negotiation room exists.
- What's the average days-on-market for RENTAL listings here right now (not sales)? A rising rental-DOM trend means longer vacancies and softer asking-rent achievability than the comps imply.
- What's the recent tenant-quality profile in this submarket — average credit score on applications, eviction rate, late-payment / NSF rate, and stable-employment percentage? A property-management company in the area should have these aggregated.
- How much new for-sale + rental construction is in the pipeline within 1–3 miles? Heavy new supply typically softens prices + rents 12–24 months out; constrained supply supports both.
Investment metrics
- 1% rule
- 0.70% ✗
- Cap rate
- 5.60%
- Cash-on-cash
- -2.47%
- DSCR
- 0.89
- GRM
- 11.9
CMA / ARV
- ARV (on-the-fly)
- $247,632
- Comps found
- 2
Show comp detail 2 sales within ~0.75 mi
| Address | Dist | Beds/Ba | Sqft | Sold | Price | $/sf | Match |
|---|---|---|---|---|---|---|---|
| 21379 Buckridge Rd | 0.10mi | 2/1.0 | 960 (-10%) | 21mo | $222,000 | $231 | 58 |
| 20745 Valley Ct | 0.67mi | 2/1.0 | 993 (-7%) | 14mo | $120,000 | $121 | 43 |
Match score weights: distance 35% · size 25% · config 20% · recency 20%. Top-matched comps best support the ARV.
Projected returns pro-forma
10.0% appreciation · 3.0% rent growth · sell at horizon
- IRR
- 22.5%
- Equity multiple
- 2.81×
- Total profit
- $71,046
- Equity at exit
- $126,123
- IRR
- 20.1%
- Equity multiple
- 6.44×
- Total profit
- $213,156
- Equity at exit
- $271,989
Cash invested: $39,200 (down + closing). Projections, not guarantees.
Landlord ↔ Tenant lean methodology
- Overall (STATE)
- 62 Landlord-Friendly
- State Michigan
- 62 Landlord-Friendly · EVEN
- County
- — inherits STATE
- City
- — inherits STATE
ZIP-level market 49746
- Home prices YoY
- 5.7%
- Active inventory
- 38
- Price-to-rent
- 11.9×
Monthly cashflow live
- Estimated rent
- $978 medium interval (Pro) →
- Mortgage (P&I)
- −$734
- Tax from tax record
- −$61 /mo · $733/yr
- Insurance
- −$58
- HOA
- −$0
- Vacancy / Maint / Mgmt
- −$205
- Net cashflow
- $-81
Break-even live
Sensitivity live
| Price | -10% $-2 | -5% $-41 | +0% $-81 | +5% $-120 | +10% $-160 |
|---|---|---|---|---|---|
| Rent | -10% $-158 | -5% $-119 | +0% $-81 | +5% $-42 | +10% $-4 |
| Rate | -1.0pp $-10 | -0.5pp $-45 | base $-81 | +0.5pp $-117 | +1.0pp $-154 |
UW: 25.0% down · 7.5% · 30yr · 1.5% tax · 5.0% vac · 8.0% maint · 8.0% mgmt
Financing live
Cash to close
- Down payment
- $35,000
- Closing costs
- $4,200
- Reserves months
- —
- Total cash needed
- —
Loan-product check · same deal, 3 products live
Conventional
25% down · 7.5% · 30yr
- Down + closing
- —
- Monthly P&I
- —
- Monthly cashflow
- —
- DSCR
- —
- Eligible?
- —
Personal DTI + credit; lowest rate.
DSCR
20% down · 8.5% · 30yr
- Down + closing
- —
- Monthly P&I
- —
- Monthly cashflow
- —
- DSCR
- —
- Eligible?
- —
No personal income docs; deal must DSCR.
Hard money
10% down · 12.0% · 12mo
- Down + closing
- —
- Monthly P&I
- —
- Monthly cashflow
- —
- DSCR
- —
- Eligible?
- —
Short-term bridge; refi at stabilization.
Listing history 21 events
-
2026-06-21days on market $140,000 Active 32 DOM
-
2026-06-21days on market $140,000 Active 31 DOM
-
2026-06-18days on market $140,000 Active 29 DOM
-
2026-06-17days on market $140,000 Active 28 DOM
-
2026-06-16days on market $140,000 Active 27 DOM
-
2026-06-15days on market $140,000 Active 26 DOM
-
2026-06-13days on market $140,000 Active 24 DOM
-
2026-06-12days on market $140,000 Active 23 DOM
-
2026-06-09days on market $140,000 Active 20 DOM
-
2026-06-08days on market $140,000 Active 19 DOM
-
2026-06-07days on market $140,000 Active 18 DOM
-
2026-06-07days on market $140,000 Active 17 DOM
-
2026-06-04days on market $140,000 Active 14 DOM
-
2026-06-02days on market $140,000 Active 13 DOM
-
2026-06-01days on market $140,000 Active 12 DOM
-
2026-05-31days on market $140,000 Active 11 DOM
-
2026-05-31days on market $140,000 Active 10 DOM
-
2026-05-20$140,000 Active
-
2020-11-20soldstatus $65,000
-
2012-10-02soldstatus $40,000
-
2007-03-07soldstatus $20,000
ⓘ Source: listings_history table (triggers on properties + properties_extension) + one-shot
backfill from property_details.listing_events for pre-trigger history.
Tax reassessment forecast MI · Partial reset (capped growth)
- Current annual tax
- $733 · $61/mo
- Projected year-2 tax
- $1,444 · $120/mo
- Expected delta
- +$712/yr (+$59/mo · 97.1%)
ⓘ Screening estimate from a state-policy table — verify with the county assessor before closing.
Climate risk First Street
- Flood 1/10 Low 0% chance over 30 yrs
- Wildfire 4/10 Moderate
- Heat 1/10 Low 7 d/yr ≥94°F today · 13 d/yr by 30 yrs out
- Wind 1/10 Low
- Air quality 1/10 Low 0 unhealthy d/yr today · 0 by 30 yrs out
Nearby sold comps map
Loading sold comps map…
Walkable amenities ~0.75 mi
Loading nearby amenities…
Taxation est. · year 1
- Rental income
- $11,738
- − Mortgage interest
- −$7,842
- − Property taxes
- −$733
- − Insurance
- −$700
- − Repairs & maintenance
- −$939
- − Management
- −$939
- − Depreciation
- −$4,073
- Taxable loss
- −$3,488
- Est. tax savings @ 24.0%
- +$837
- After-tax cash flow
- $-133/yr
For passive investors: Depreciation is non-cash, so a rental often shows a tax loss while cash-flowing — sheltering income. Rental losses are passive: they offset passive income freely, and up to $25,000/yr can offset ordinary (W-2) income if you actively participate and your MAGI is under $100k (phasing out to $0 by $150k); unused losses carry forward. On sale, claimed depreciation is recaptured at up to 25%, and gains may owe capital-gains tax (a 1031 exchange can defer both). Figures are a year-1 estimate at your 24.0% rate — not tax advice; consult a CPA.
Schools (NCES district)
- District
- Hillman Community Schools
- NCES district ID
- 2618360
- Math proficiency
- 22% ▬ 0.00%
- Reading proficiency
- 40% ▲ 3.00%
- Median HH income
- $37,668
- Composite
- 25.78/100
- National rank
- #7368
- State rank
- #361 of 540 in MI
Livability — Montmorency
No livability data for this city. (Only ~50 U.S. cities are tracked.)
Census & demographics
- Population (ZIP)
- 3,502
Population outlook (Montmorency County) Hauer SSP2
- Today (2025)
- 8,233 people
- By 2030
- 7,575 · -8.0%
- By 2040
- 6,202 · -24.7%
- By 2050
- 5,081 · -38.3%
- By 2075
- 3,119 · -62.1%
- By 2100
- 1,923 · -76.6%
Race, ethnicity, and origin ACS 2023
- Neighborhood character
- Predominantly White (95%)
- Race & ethnicity
- White 95% Two or more races 3% Hispanic / Latino 1% Native American 1%
- Common ancestry
- Romanian 9% Lithuanian 6% Slovak 2%
- Foreign-born
- 1% · Canada
Political lean MEDSL · Montmorency
- 2024 margin
- Solid R (+45.3) · D 26.6% · R 72.0% · Other 1.4%
- 2008→2024 swing
- -37.2pp toward R · 2008: -8.2pp · 2024: -45.3pp
- All cycles
- 2024: R+45.3 2020: R+43.4 2016: R+44.2 2012: R+17.4 2008: R+8.2
Not yet ingested
- Civics
- —
Market trends
- HPI YoY
- ▲ 11.19%
- Current HPI
- 208.751
- Rent YoY
- —
- Metro
- —
- State GDP YoY
- ▲ 1.37%
- F500 in state
- 28
Industry mix (Fortune 500 HQ in MI)
| Industry | F500 HQs | Revenue |
|---|---|---|
| Automotive Parts | 3 | $48B |
|
||
| Automotive | 2 | $372B |
|
||
| Chemicals | 1 | $45B |
|
||
| Automotive Retail | 1 | $29B |
|
||
| Healthcare / Medical Devices | 1 | $23B |
|
||
| Automotive Technology | 1 | $20B |
|
||
Price history
+600.0% since first listed4 events — show timeline
- 2026-05-20 Listed $140,000 WWMLS
- 2020-11-20 Sold (Public Records) $65,000 Public Records
- 2012-10-02 Sold (Public Records) $40,000 Public Records
- 2007-03-07 Sold (Public Records) $20,000 Public Records
Property tax history
+17.7%/yrLatest (2023): $733 · +52.1% YoY. Source: county tax records.
Cash-flow waterfall
monthlySold comps — $/sqft
last 12 mo · ≤1 miLoading sold comps…