 Fourplex
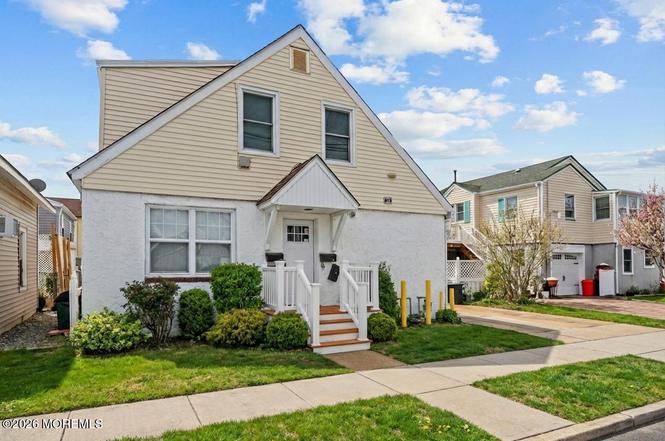
610 Barnegat Ave #4 · Seaside Heights, NJ
Flood risk 9/10 · Severe
- FEMA flood zone
- AE
- Chance of flooding over 30 yrs
- 0.99%
- Est. flood insurance / yr
- $1,737 – $8,500
Fire risk 1/10 · Minimal
- Est. fire insurance / yr
- $526 – $976
Heat risk 8/10 · Major
- Hot days now (above 95°F)
- 7 days/yr
- Hot days in 30 yrs
- 15 days/yr
Wind risk 8/10 · Major
- Chance of severe wind over 30 yrs
- 80.0%
Air-quality risk 3/10 · Minor
- Unhealthy air days now
- 3 days/yr
- Unhealthy air days in 30 yrs
- 3 days/yr
Risk factors via First Street. Map © Google.
Why this score? — see what drove the D+ grade
The composite is a weighted blend of 9 inputs, each scored 0–100. Each bar is that input's sub-score; the figure is the points it added to the 100-point composite (weight × sub-score).
- Cash flow +19.2/30.0
- ARV discount +7.5/15.0
- DSCR +6.0/10.0
- 1% rule +5.1/10.0
- Condition / age +4.0/5.0
- Livability +3.0/5.0
- Schools +2.6/10.0
- Rent growth +2.5/5.0
- Appreciation +0.0/10.0
$849,000
🖨 Deal sheet (PDF) 📄 Offer letter ✓ Due diligence
Multi-family units
County records classify this as Multi-Family (2-4 Unit). Listing-text estimate: 4 units. confirmed
Listing remarks
If you are looking for an income producing property with low taxes this is for you. This super clean 4 family could be an amazing short term rental, a mix 1 bedrooms, and studios, you can rent each one for $1500 per week during the summer months, then rent for the winter months for $1400 per month, coin-op Washer and Dryer onsite. You can generate over 100K per year in rentals, this could be a cash machine, or buy it to enjoy the current cash flow. All units are separately metered for gas and electric. Existing tenants would stay if you want them. Walk to the beach, boardwalk, rides, restaurants and shopping. 1 Hr from NYC, AC & Philly off Parkway Exit 82. Financing available to quali
Key facts
- Short term rental
- Walk to the beach
- Boardwalk
Tags
Property features AI
Exterior
- Parking: Garage present (garage spaces listed as 0)
- Utilities: Public sewer
- Home design: Individually owned
- Exterior features: Shingle roof
Interior
- Bedrooms: 4 bedrooms
- Flooring: Ceramic tile
- Bathrooms: 4 full bathrooms
- Heating & cooling: Cooling system present (type: Other)
- Interior features: Ceramic tile flooring; No fireplaces; Crawl space basement
Neighborhood map
What this means for you Summary
Snapshot
- This is a 4 × 1-bed/1.0-bath units multifamily listed at $849k. Condition is rated good.
Deal economics
- At list price, monthly cash flow is $484 ($6k/yr) — positive. Per door: $121/mo.
- The deal already cash-flows at list — no discount required.
- Meets the 1% rule at list price ($9k rent vs $849k).
- Recommended offer: $773k (9.0% below list) — sets the bar for market timing.
- Cap rate 7.6% vs local median 2.9% in Seaside Heights — top-decile yield for the area; either an underpriced asset or a hidden risk that comps aren't pricing in. Stress-test before assuming the spread holds.
Location & tenants
- Location reads 60/100 on livability (#483 in NJ) — a middle-class / working-renter tenant base. Strengths: housing A+, health & safety A+, crime A; Watch: commute F, employment F, cost of living F.
- Central Regional School District (suburban): math 17% / reading 43% proficiency, ranked #357 of 472 in NJ (top 76%) — families likely to look elsewhere, expect single-tenant / working-renter base with shorter leases.
- Zoned schools: Hugh J. Boyd Jr. Elementary School (math 8% / reading 22%, grade F, #1,124 of 1,303 statewide, top 88%, 202 students, 76% FRL); Central Regional Middle School (math 19% / reading 46%, grade F, #279 of 431 statewide, top 66%, 716 students, 37% FRL); Central Regional High School (math 15% / reading 39%, grade F, #312 of 399 statewide, top 79%, 1,606 students, 36% FRL) — zoned schools average 49% FRL vs 28% district-wide (22 pts higher); higher-poverty schools than district average — tighter screening recommended.
- Market conditions: 196 active listings in the ZIP; 4,434 units permitted in Ocean County in 2024 (868 in 5+ unit buildings).
Forward outlook
- Local home prices are declining (-3.0%/yr); year-one equity from $6k of loan paydown is wiped out by about $25k of value loss. Plan a longer hold.
- Ocean County population projected to shrink 8% by 2050 — rents likely to lag national; underwrite the cash flow, not the appreciation.
Negotiation context
- It's been on market 113 days — a 9% lower offer ($773k) is reasonable based on typical stale-listing flexibility.
Risks & watch-outs
- Watch-outs: flood insurance adds $427/mo.
- Climate carrying-cost: in FEMA flood zone AE (mandatory federal flood insurance); severe wind risk, 80% chance of damaging wind over 30y; extreme-heat days projected 7→15/yr by 2055 (HVAC capex compounding) — expect insurance premiums to compound above CPI over the hold.
Questions for the listing agent
- It's been on market 113 days. Have you received any prior offers? Is the seller open to a 9% concession, seller financing, or rate buy-down credit?
- Can we see the unit-by-unit rent roll, current vacancy, and any below-market leases? What's the average tenancy length?
- What capital expenditures (roof, boiler, parking lot, exteriors) have been made in the last 5 years, and what's planned in the next 2?
- What's the actual annual flood-insurance premium (NFIP or private), and is the property in a SFHA with mandatory coverage?
- Why hasn't it sold? Are there any deal-killer items the seller is aware of (foundation, flood, title, zoning, code violations)?
- Is there a deadline driving the sale (1031 exchange, divorce, estate, relocation)? That informs how much negotiation room exists.
- Schools are F-rated, which usually means shorter tenancies and higher turnover. Who's the typical renter profile here, and what's been the actual vacancy rate?
- The area grade is low — what's the realistic commute time and amenity access for the typical tenant pool here? Any planned neighborhood developments (good or bad) we should know about?
- What's the average days-on-market for RENTAL listings here right now (not sales)? A rising rental-DOM trend means longer vacancies and softer asking-rent achievability than the comps imply.
- What's the recent tenant-quality profile in this submarket — average credit score on applications, eviction rate, late-payment / NSF rate, and stable-employment percentage? A property-management company in the area should have these aggregated.
- How much new apartment / multifamily construction is in the pipeline within 1–3 miles? Heavy new supply (>2% of stock underway) typically softens rents 12–24 months out; light construction supports rent growth.
Investment metrics
- 1% rule
- 1.01% ✓
- Cap rate
- 7.58%
- Cash-on-cash
- 4.60%
- DSCR
- 1.20
- GRM
- 8.2
CMA / ARV
No comps found within radius.
Projected returns pro-forma
-3.0% appreciation · 3.0% rent growth · sell at horizon
- IRR
- -12.4%
- Equity multiple
- 0.55×
- Total profit
- $-106,331
- Equity at exit
- $126,589
- IRR
- -3.2%
- Equity multiple
- 0.78×
- Total profit
- $-51,273
- Equity at exit
- $73,406
Cash invested: $237,720 (down + closing). Projections, not guarantees.
Landlord ↔ Tenant lean methodology
- Overall (STATE)
- 21 Tenant-Leaning
- State New Jersey
- 21 Tenant-Leaning · D+6
- County
- — inherits STATE
- City
- — inherits STATE
ZIP-level market 08751
- Home prices YoY
- -34.8%
- Active inventory
- 196
- Price-to-rent
- 33.0×
Monthly cashflow live
- Estimated rent
- $8,580 high interval (Pro) →
- Mortgage (P&I)
- −$4,452
- Tax est. 1.5%
- −$1,061 /mo · $12,735/yr
- Insurance
- −$354
- Flood insurance flood zone
- −$427 /mo · $5,118/yr
- HOA
- −$0
- Lot rent
- −$0
- Vacancy / Maint / Mgmt
- −$1,802
- Net cashflow
- $484
Break-even live
Sensitivity live
| Price | -10% $1,071 | -5% $778 | +0% $484 | +5% $191 | +10% $-102 |
|---|---|---|---|---|---|
| Rent | -10% $-193 | -5% $145 | +0% $484 | +5% $823 | +10% $1,162 |
| Rate | -1.0pp $912 | -0.5pp $700 | base $484 | +0.5pp $264 | +1.0pp $41 |
4-unit breakdown (identical units grouped — click to expand)
| Units | Beds | Baths | Est. rent |
|---|---|---|---|
| 4× units | 1 | 1 | $8,580 |
| #1 | 1 | 1 | $2,145 |
| #2 | 1 | 1 | $2,145 |
| #3 | 1 | 1 | $2,145 |
| #4 | 1 | 1 | $2,145 |
| Total (4 units) | $8,580 | ||
UW: 25.0% down · 7.5% · 30yr · 1.5% tax · 5.0% vac · 8.0% maint · 8.0% mgmt
Financing live
Cash to close
- Down payment
- $212,250
- Closing costs
- $25,470
- Reserves months
- —
- Total cash needed
- —
Loan-product check · same deal, 3 products live
Conventional
25% down · 7.5% · 30yr
- Down + closing
- —
- Monthly P&I
- —
- Monthly cashflow
- —
- DSCR
- —
- Eligible?
- —
Personal DTI + credit; lowest rate.
DSCR
20% down · 8.5% · 30yr
- Down + closing
- —
- Monthly P&I
- —
- Monthly cashflow
- —
- DSCR
- —
- Eligible?
- —
No personal income docs; deal must DSCR.
Hard money
10% down · 12.0% · 12mo
- Down + closing
- —
- Monthly P&I
- —
- Monthly cashflow
- —
- DSCR
- —
- Eligible?
- —
Short-term bridge; refi at stabilization.
Listing history 19 events
-
2026-06-22days on market $849,000 Active 113 DOM
-
2026-06-21days on market $849,000 Active 112 DOM
-
2026-06-21days on market $849,000 Active 111 DOM
-
2026-06-18days on market $849,000 Active 109 DOM
-
2026-06-17days on market $849,000 Active 108 DOM
-
2026-06-16days on market $849,000 Active 107 DOM
-
2026-06-15days on market $849,000 Active 106 DOM
-
2026-06-13days on market $849,000 Active 104 DOM
-
2026-06-12days on market $849,000 Active 103 DOM
-
2026-06-09days on market $849,000 Active 100 DOM
-
2026-06-08days on market $849,000 Active 99 DOM
-
2026-06-07days on market $849,000 Active 98 DOM
-
2026-06-07days on market $849,000 Active 97 DOM
-
2026-06-04days on market $849,000 Active 95 DOM
-
2026-06-03days on market $849,000 Active 94 DOM
-
2026-06-02days on market $849,000 Active 93 DOM
-
2026-06-01days on market $849,000 Active 92 DOM
-
2026-05-31days on market $849,000 Active 91 DOM
-
2026-02-27$849,000 Active
ⓘ Source: listings_history table (triggers on properties + properties_extension) + one-shot
backfill from property_details.listing_events for pre-trigger history.
Climate risk First Street
- Flood 9/10 Extreme FEMA zone AE · 99% chance over 30 yrs
- Wildfire 1/10 Low
- Heat 8/10 Severe 7 d/yr ≥95°F today · 15 d/yr by 30 yrs out
- Wind 8/10 Severe 80% chance of damaging wind over 30 yrs
- Air quality 3/10 Moderate 3 unhealthy d/yr today · 3 by 30 yrs out
Nearby sold comps map
Loading sold comps map…
Walkable amenities ~0.75 mi
Loading nearby amenities…
Taxation est. · year 1
- Rental income
- $102,960
- − Mortgage interest
- −$47,557
- − Property taxes
- −$12,735
- − Insurance
- −$9,364
- − Repairs & maintenance
- −$8,237
- − Management
- −$8,237
- − Depreciation
- −$24,698
- Taxable loss
- −$7,867
- Est. tax savings @ 24.0%
- +$1,888
- After-tax cash flow
- $7,701/yr
For passive investors: Depreciation is non-cash, so a rental often shows a tax loss while cash-flowing — sheltering income. Rental losses are passive: they offset passive income freely, and up to $25,000/yr can offset ordinary (W-2) income if you actively participate and your MAGI is under $100k (phasing out to $0 by $150k); unused losses carry forward. On sale, claimed depreciation is recaptured at up to 25%, and gains may owe capital-gains tax (a 1031 exchange can defer both). Figures are a year-1 estimate at your 24.0% rate — not tax advice; consult a CPA.
Condition & rehab AI · 14 photos
This multi-family property is in good condition with minimal repairs needed. Painting the exterior siding and cleaning the windows and HVAC system would significantly enhance its curb appeal and rental value.
Value-add opportunities
- Both Paint the exterior siding — Fresh paint will enhance the curb appeal and increase the property's value.
- Both Clean the windows — Clean windows will improve the property's appearance and increase its rental value.
- Both Inspect and clean the HVAC system — A clean and functioning HVAC system will improve comfort and energy efficiency, increasing both resale and rental value.
Renovation cost estimate screening
Value-add ROI direction
- Both Paint the exterior siding — Fresh paint will enhance the curb appeal and increase the property's value. ↑
- Both Clean the windows — Clean windows will improve the property's appearance and increase its rental value. ↑
- Both Inspect and clean the HVAC system — A clean and functioning HVAC system will improve comfort and energy efficiency, increasing both resale and rental value. ↑
ⓘ Cost ranges are severity-bucket heuristics (US national rule-of-thumb). Get contractor quotes + a written scope before underwriting a rehab budget.
Schools (NCES district)
- District
- Central Regional School District
- NCES district ID
- 3402910
- Math proficiency
- 17% ▼ -14.00%
- Reading proficiency
- 43% ▲ 7.00%
- Median HH income
- $44,676
- Composite
- 25.59/100
- National rank
- #7422
- State rank
- #357 of 472 in NJ
Livability — Seaside Heights
- Score
- 60/100
- State rank
- #483
- US rank
- #19128
Category grades
Schools grade is shown separately in the Schools card above.
Census & demographics
- Census place
- Seaside Heights, NJ
- Population (ZIP)
- 3,625
Population outlook (Ocean County) Hauer SSP2
- Today (2025)
- 586,991 people
- By 2030
- 581,403 · -1.0%
- By 2040
- 564,913 · -3.8%
- By 2050
- 538,149 · -8.3%
- By 2075
- 468,845 · -20.1%
- By 2100
- 350,297 · -40.3%
Race, ethnicity, and origin ACS 2023
- Neighborhood character
- Predominantly White (86%)
- Race & ethnicity
- White 86% Hispanic / Latino 11% Two or more races 6%
- Hispanic origin (detail)
- Mexican 2% Puerto Rican 5%
- Common ancestry
- Romanian 7% Iranian 1% Subsaharan African 1%
- Foreign-born
- 7% · Canada, Jamaica
- Languages at home
- 91% English-only · Spanish 6% Other Indo-European 2% Russian/Polish/Slavic 1%
Political lean MEDSL · Ocean
- 2024 margin
- Solid R (+36.0) · D 31.4% · R 67.4% · Other 1.2%
- 2008→2024 swing
- -17.6pp toward R · 2008: -18.4pp · 2024: -36.0pp
- All cycles
- 2024: R+36.0 2020: R+28.7 2016: R+34.0 2012: R+17.7 2008: R+18.4
Not yet ingested
- Civics
- —
Market trends
- HPI YoY
- ▼ -301.05%
- Current HPI
- 564.3566
- Rent YoY
- —
- Metro
- —
- State GDP YoY
- ▲ 2.05%
- F500 in state
- 34
Industry mix (Fortune 500 HQ in NJ)
| Industry | F500 HQs | Revenue |
|---|---|---|
| Consumer Goods | 3 | $31B |
|
||
| Pharmaceuticals | 2 | $153B |
|
||
| Technology | 2 | $21B |
|
||
| Insurance | 2 | $20B |
|
||
| Healthcare | 2 | $19B |
|
||
| Financial Services | 1 | $70B |
|
||
Price history
1 event — show timeline
- 2026-02-27 Listed $849,000 MOMLS
Cash-flow waterfall
monthlySold comps — $/sqft
last 12 mo · ≤1 miLoading sold comps…