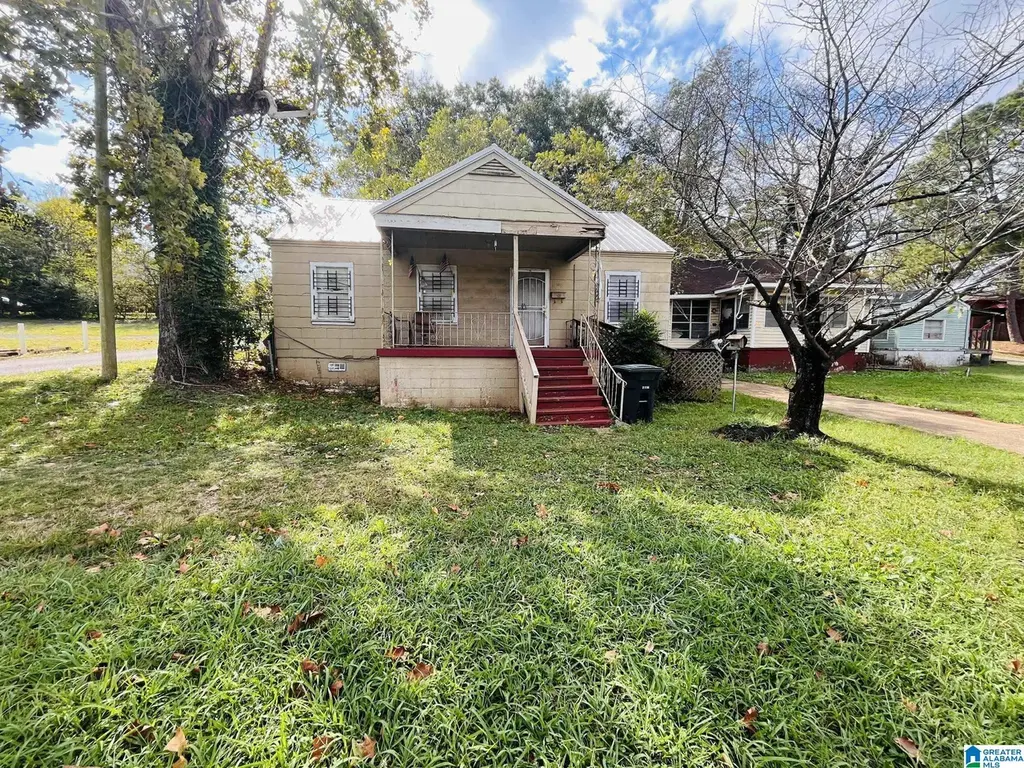
1813 Jefferson Ave SW · Birmingham, AL
Flood risk 4/10 · Minor
- FEMA flood zone
- X (unshaded)
- Chance of flooding over 30 yrs
- 0.24%
- Est. flood insurance / yr
- $507 – $1,088
Fire risk 1/10 · Minimal
- Est. fire insurance / yr
- $916 – $1,700
Heat risk 6/10 · Moderate
- Hot days now (above 106°F)
- 7 days/yr
- Hot days in 30 yrs
- 19 days/yr
Wind risk 6/10 · Moderate
- Chance of severe wind over 30 yrs
- 27.0%
Air-quality risk 4/10 · Minor
- Unhealthy air days now
- 5 days/yr
- Unhealthy air days in 30 yrs
- 5 days/yr
Risk factors via First Street. Map © Google.
Why this score? — see what drove the B grade
The composite is a weighted blend of 9 inputs, each scored 0–100. Each bar is that input's sub-score; the figure is the points it added to the 100-point composite (weight × sub-score).
- Cash flow +30.0/30.0
- ARV discount +14.9/15.0
- 1% rule +10.0/10.0
- DSCR +10.0/10.0
- Livability +3.4/5.0
- Rent growth +2.5/5.0
- Condition / age +2.5/5.0
- Schools +0.9/10.0
- Appreciation +0.0/10.0
$45,000
🖨 Deal sheet 📄 Offer letter ✓ Due diligence
Listing remarks MLS
This 2-bedroom, 1 bath home is perfect for a first-time homeowner or an investor looking to add to their portfolio. Real low maintenance and ready for its new owner. Set up your private showing today.
Key facts
- 4,791 sq ft lot
- Built 1948
- Listed 223 days
Neighborhood map
What this means for you Summary
Snapshot
- This is a 2-bed/1.0-bath single-family listed at $45k.
Deal economics
- At list price, monthly cash flow is $517 ($6k/yr) — positive.
- The deal already cash-flows at list — no discount required.
- Meets the 1% rule at list price ($1k rent vs $45k).
- Recommended offer: $40k (12.0% below list) — sets the bar for market timing.
- Cap rate 20.1% vs local median 6.2% in Birmingham — top-decile yield for the area; either an underpriced asset or a hidden risk that comps aren't pricing in. Stress-test before assuming the spread holds.
Location & tenants
- Location reads 67/100 on livability (#78 in AL) — a middle-class / working-renter tenant base. Strengths: commute A+, cost of living A+, housing A+; Watch: amenities C-, schools F, crime F.
- Birmingham City (urban): math 4% / reading 20% proficiency, ranked #116 of 129 in AL (top 90%) — low school quality limits family demand, transient renter base, plan for 1-2y turnover; 82% free/reduced lunch — lower-income household profile, screen leases tightly.
- Market conditions: Rents soft (-0.0%/yr); 152 active listings in the ZIP; 40 comparable units currently listed for rent nearby; rentals lingering (median 44d on market — plan ~5-8 weeks vacancy on turnover, expect pricing pressure); 50% of comp listings sitting > 30 days — soft ceiling on asking rent; lower-income renter base — watch delinquency; 2,114 units permitted in Jefferson County in 2024 (556 in 5+ unit buildings).
- This rent runs 36% of the median local income ($35k/yr) — at the standard rent-burdened threshold; future hikes will face affordability resistance.
Forward outlook
- Local home prices are declining (-3.0%/yr); year-one equity from $311 of loan paydown is wiped out by about $1k of value loss. Plan a longer hold.
- Jefferson County population projected to shrink 4% by 2050 — rents likely to lag national; underwrite the cash flow, not the appreciation.
- At projected returns (-3.0% appreciation + 0.0% rent growth), your $13k cash investment doubles in ~3 years — after that, you're playing with house money.
Negotiation context
- It's been on market 224 days — a 12% lower offer ($40k) is reasonable based on typical stale-listing flexibility.
- 4 sale attempts since 3y ago; this cycle's ask has dropped $10k (18%) from the opening price — seller is motivated, your offer sets the floor, not the list.
Risks & watch-outs
- Watch-outs: built in 1948 — expect roof / HVAC / electrical / plumbing capex.
- Climate carrying-cost: major wind risk, 27% chance of damaging wind over 30y; extreme-heat days projected 7→19/yr by 2055 (HVAC capex compounding) — expect insurance premiums to compound above CPI over the hold.
Questions for the listing agent
- It's been on market 224 days. Have you received any prior offers? Is the seller open to a 12% concession, seller financing, or rate buy-down credit?
- Built in 1948 — when were the roof, HVAC, electrical panel, plumbing, and water heater last replaced?
- Why hasn't it sold? Are there any deal-killer items the seller is aware of (foundation, flood, title, zoning, code violations)?
- Is there a deadline driving the sale (1031 exchange, divorce, estate, relocation)? That informs how much negotiation room exists.
- Schools are F-rated, which usually means shorter tenancies and higher turnover. Who's the typical renter profile here, and what's been the actual vacancy rate?
- Crime grade is F in this area — have there been break-ins, vandalism, or insurance claims at this property in the last 3 years? What carrier currently insures it and at what premium?
- What's the average days-on-market for RENTAL listings here right now (not sales)? A rising rental-DOM trend means longer vacancies and softer asking-rent achievability than the comps imply.
- What's the recent tenant-quality profile in this submarket — average credit score on applications, eviction rate, late-payment / NSF rate, and stable-employment percentage? A property-management company in the area should have these aggregated.
- How much new for-sale + rental construction is in the pipeline within 1–3 miles? Heavy new supply typically softens prices + rents 12–24 months out; constrained supply supports both.
Investment metrics
- 1% rule
- 2.33% ✓
- Cap rate
- 20.07%
- Cash-on-cash
- 49.21%
- DSCR
- 3.19
- GRM
- 3.6
CMA / ARV
- ARV (median comp)
- $53,898
- List price
- $45,000
- Delta
- -16.51%
- Verdict
- UNDERPRICED
- Comps
- 20 within 1.0 mi
Show comp detail 12 sales within ~0.75 mi
| Address | Dist | Beds/Ba | Sqft | Sold | Price | $/sf | Match |
|---|---|---|---|---|---|---|---|
| 1813 Jefferson Ave SW | 0.00mi | 2/1.0 | 816 (0%) | 0mo | $47,500 | $58 | 100 |
| 914 21st St SW | 0.32mi | 3/1.0 (+1) | 784 (-4%) | 5mo | $25,000 | $32 | 69 |
| 1324 19th St SW | 0.29mi | 2/2.0 | 864 (+6%) | 6mo | $83,500 | $97 | 68 |
| 340 SW 22nd St SW | 0.49mi | 2/1.0 | 846 (+4%) | 8mo | $25,000 | $30 | 64 |
| 1736 Jefferson Ave SW | 0.29mi | 3/1.0 (+1) | 871 (+7%) | 11mo | $116,000 | $133 | 61 |
| 1776 Alemeda Ave SW | 0.14mi | 2/1.0 | 702 (-14%) | 12mo | $46,000 | $66 | 60 |
| 901 22nd St SW | 0.36mi | 2/1.0 | 768 (-6%) | 17mo | $11,000 | $14 | 59 |
| 1928 Princeton Ct | 0.75mi | 2/1.0 | 850 (+4%) | 2mo | $26,000 | $31 | 57 |
| 1545 17th Pl SW | 0.42mi | 3/1.0 (+1) | 920 (+13%) | 4mo | $35,000 | $38 | 51 |
| 208 22nd St SW | 0.69mi | 2/1.0 | 926 (+14%) | 1mo | $57,000 | $62 | 44 |
| 1509 20th Pl SW | 0.67mi | 2/1.0 | 696 (-15%) | 6mo | $32,500 | $47 | 39 |
| 1657 SW 18th Way | 0.64mi | 3/1.0 (+1) | 912 (+12%) | 9mo | $90,000 | $99 | 38 |
Match score weights: distance 35% · size 25% · config 20% · recency 20%. Top-matched comps best support the ARV.
Projected returns pro-forma
-3.0% appreciation · 0.0% rent growth · sell at horizon
- IRR
- 43.4%
- Equity multiple
- 2.79×
- Total profit
- $22,559
- Equity at exit
- $6,710
- IRR
- 48.0%
- Equity multiple
- 4.98×
- Total profit
- $50,205
- Equity at exit
- $3,891
Cash invested: $12,600 (down + closing). Projections, not guarantees.
Landlord ↔ Tenant lean methodology
- Overall (STATE)
- 90 Strongly Landlord-Friendly
- State Alabama
- 90 Strongly Landlord-Friendly · R+15
- County
- — inherits STATE
- City
- — inherits STATE
ZIP-level market 35211
- Rents YoY
- -0.0%
- Active inventory
- 152
- Price-to-rent
- 3.6×
Monthly cashflow live
- Estimated rent
- $1,049 high interval (Pro) →
- Mortgage (P&I)
- −$236
- Tax from tax record
- −$57 /mo · $687/yr
- Insurance
- −$19
- HOA
- −$0
- Vacancy / Maint / Mgmt
- −$220
- Net cashflow
- $517
Break-even live
UW: 25.0% down · 7.5% · 30yr · 1.5% tax · 5.0% vac · 8.0% maint · 8.0% mgmt
Financing live
Cash to close
- Down payment
- $11,250
- Closing costs
- $1,350
- Reserves months
- —
- Total cash needed
- —
Loan-product check · same deal, 3 products live
Conventional
25% down · 7.5% · 30yr
- Down + closing
- —
- Monthly P&I
- —
- Monthly cashflow
- —
- DSCR
- —
- Eligible?
- —
Personal DTI + credit; lowest rate.
DSCR
20% down · 8.5% · 30yr
- Down + closing
- —
- Monthly P&I
- —
- Monthly cashflow
- —
- DSCR
- —
- Eligible?
- —
No personal income docs; deal must DSCR.
Hard money
10% down · 12.0% · 12mo
- Down + closing
- —
- Monthly P&I
- —
- Monthly cashflow
- —
- DSCR
- —
- Eligible?
- —
Short-term bridge; refi at stabilization.
Rent comps 40 comps
| Address | Beds | Baths | Sqft | Rent | $/sqft | DOM | Units | Dist |
|---|---|---|---|---|---|---|---|---|
| 1252 18th Pl SW Birmingham, AL | 3.0 | 1.0 | 950 | $1,000 | $1.05 | 16d | 1 | 0.11mi |
| 1209 19th Pl SW Birmingham, AL | 3.0 | 1.0 | 1050 | $1,275 | $1.21 | 43d | 1 | 0.22mi |
| 1228 19th Pl SW Birmingham, AL | 3.0 | 2.0 | 978 | $1,195 | $1.22 | 3d | 1 | 0.27mi |
| 914 21st St SW Birmingham, AL | 3.0 | 1.0 | 784 | $1,200 | $1.53 | 21d | 1 | 0.32mi |
| 1520 17th Way SW Birmingham, AL | 3.0 | 1.0 | 900 | $900 | $1.00 | 11d | 1 | 0.43mi |
| 1520 17th Way SW Birmingham, AL | 3.0 | 1.0 | 900 | $900 | $1.00 | 21d | 1 | 0.43mi |
| 1537 18th St SW Birmingham, AL | 3.0 | 1.0 | 1049 | $1,130 | $1.08 | 43d | 1 | 0.45mi |
| 1544 18th St SW Birmingham, AL | 3.0 | 1.0 | 950 | $1,130 | $1.19 | 43d | 1 | 0.47mi |
| 407 S Park Rd SW Birmingham, AL | 3.0 | 1.0 | 1050 | $900 | $0.86 | 43d | 1 | 0.51mi |
| 2216 Lee Ave SW Birmingham, AL | 3.0 | 1.0 | 902 | $900 | $1.00 | 23d | 1 | 0.59mi |
| 2028 Lee Ter SW Birmingham, AL | 2.0 | 1.0 | 884 | $695 | $0.79 | 43d | 1 | 0.66mi |
| 612 26th St SW Birmingham, AL | 2.0 | 1.0 | 988 | $825 | $0.84 | 43d | 1 | 0.67mi |
| 208 22nd St SW Birmingham, AL | 2.0 | 1.0 | 926 | $1,050 | $1.13 | 3d | 1 | 0.69mi |
| 2519 Saint Charles Ave SW Birmingham, AL | 2.0 | 1.0 | 990 | $975 | $0.98 | 44d | 1 | 0.70mi |
| 1233 15th Way SW Birmingham, AL | 3.0 | 1.0 | 1119 | $1,050 | $0.94 | 43d | 1 | 0.84mi |
| 1933 Saint Charles Ct SW Birmingham, AL | 3.0 | 1.0 | 1106 | $1,050 | $0.95 | 23d | 1 | 0.85mi |
| 224 E Ann Dr SW Birmingham, AL | 3.0 | 1.0 | 1026 | $1,050 | $1.02 | 23d | 1 | 0.88mi |
| 1845 Henry Crumpton Dr Birmingham, AL | 3.0 | 1.0 | 1000 | $895 | $0.90 | 3d | 1 | 0.90mi |
| 249 Gloria Rd SW Birmingham, AL | 2.0 | 1.0 | 624 | $800 | $1.28 | 43d | 1 | 0.92mi |
| 2709 Powderly Ave SW Birmingham, AL | 3.0 | 2.0 | 1056 | $950 | $0.90 | 23d | 1 | 0.94mi |
| 1332 15th Pl SW Birmingham, AL | 2.0 | 1.0 | 1115 | $950 | $0.85 | 3d | 1 | 0.94mi |
| 521 16th St SW Unit 523 Birmingham, AL | 2.0 | 1.0 | 800 | $800 | $1.00 | 43d | 1 | 0.96mi |
| 4929 Avenue R Unit R Birmingham, AL | 2.0 | 1.0 | 962 | $950 | $0.99 | 43d | 1 | 1.00mi |
| 1508 Dennison Ave SW Birmingham, AL | 2.0 | 1.0 | 924 | $890 | $0.96 | 43d | 1 | 1.02mi |
| 914 14th St SW Unit B Birmingham, AL | 1.0 | 1.0 | 580 | $600 | $1.03 | 11d | 1 | 1.07mi |
| 914 14th St SW Unit A Birmingham, AL | 1.0 | 1.0 | 577 | $600 | $1.04 | 23d | 1 | 1.07mi |
| 914 14th St SW Unit B Birmingham, AL | 1.0 | 1.0 | 577 | $700 | $1.21 | 23d | 1 | 1.07mi |
| 132 17th St SW Birmingham, AL | 2.0 | 1.0 | 738 | $945 | $1.28 | 43d | 1 | 1.07mi |
| 916 14th St SW Unit A Birmingham, AL | 2.0 | 1.0 | 870 | $800 | $0.92 | 23d | 1 | 1.08mi |
| 916 14th St SW Unit F Birmingham, AL | 2.0 | 1.0 | 800 | $800 | $1.00 | 11d | 1 | 1.08mi |
| 916 14th St SW Unit F Birmingham, AL | 2.0 | 1.0 | 870 | $800 | $0.92 | 43d | 1 | 1.08mi |
| 1781 51st Street Ensley Unit ENSLEY Birmingham, AL | 3.0 | 1.5 | 1069 | $950 | $0.89 | 43d | 1 | 1.08mi |
| 4813 Court S Birmingham, AL | 3.0 | 2.0 | 1118 | $1,125 | $1.01 | 43d | 1 | 1.09mi |
| 5211 Ter Q Unit Q Birmingham, AL | 2.0 | 1.0 | 756 | $775 | $1.03 | 43d | 1 | 1.13mi |
| 5320 Ter Q Unit Q Birmingham, AL | 3.0 | 2.0 | 1116 | $1,250 | $1.12 | 43d | 1 | 1.15mi |
| 5219 Court Q Birmingham, AL | 3.0 | 2.0 | 1082 | $1,200 | $1.11 | 19d | 1 | 1.20mi |
| 5820 Court Q Birmingham, AL | 3.0 | 1.0 | 902 | $1,200 | $1.33 | 43d | 1 | 1.21mi |
| 1012 33rd St SW Birmingham, AL | 1.0–2.0 | 1.0–2.0 | 800 | $750 | $0.94 | 3d | 1 | 1.22mi |
| 4724 Court R Birmingham, AL | 2.0 | 1.0 | 1016 | $895 | $0.88 | 14d | 1 | 1.23mi |
| 5832 Court Q Birmingham, AL | 3.0 | 1.0 | 912 | $950 | $1.04 | 44d | 1 | 1.23mi |
Listing history 20 events
-
2026-06-03days on market $45,000 Active 224 DOM
-
2026-06-02days on market $45,000 Active 223 DOM
-
2026-06-01days on market $45,000 Active 222 DOM
-
2026-05-31days on market $45,000 Active 221 DOM
-
2026-04-30price $45,000 200-char remark
Show marketing remark (200 chars)
This 2-bedroom, 1 bath home is perfect for a first-time homeowner or an investor looking to add to their portfolio. Real low maintenance and ready for its new owner. Set up your private showing today.
-
2026-01-16price $50,000 200-char remark
Show marketing remark (200 chars)
This 2-bedroom, 1 bath home is perfect for a first-time homeowner or an investor looking to add to their portfolio. Real low maintenance and ready for its new owner. Set up your private showing today.
-
2025-10-22$55,000 Active 200-char remark
Show marketing remark (200 chars)
This 2-bedroom, 1 bath home is perfect for a first-time homeowner or an investor looking to add to their portfolio. Real low maintenance and ready for its new owner. Set up your private showing today.
-
2025-08-17historical $1,200
-
2025-07-26$1,200
-
2024-11-15soldstatus $42,000
-
2024-11-14soldstatus $42,000 Sold 297-char remark
Show marketing remark (297 chars)
ATTN INVESTORS: This property is part of a 4 Home Portfolio. This property will make a great addition to your portfolio. 2 bedroom / 1 full bath home, currently rented! Package Includes this property PLUS MLS Listings: 21394513,21389549,21388776. Sellers are also willing to sell units separately.
-
2024-11-13status Pending 297-char remark
Show marketing remark (297 chars)
ATTN INVESTORS: This property is part of a 4 Home Portfolio. This property will make a great addition to your portfolio. 2 bedroom / 1 full bath home, currently rented! Package Includes this property PLUS MLS Listings: 21394513,21389549,21388776. Sellers are also willing to sell units separately.
-
2024-08-18$53,900 Active 297-char remark
Show marketing remark (297 chars)
ATTN INVESTORS: This property is part of a 4 Home Portfolio. This property will make a great addition to your portfolio. 2 bedroom / 1 full bath home, currently rented! Package Includes this property PLUS MLS Listings: 21394513,21389549,21388776. Sellers are also willing to sell units separately.
-
2023-12-01soldstatus $44,000
-
2023-11-28soldstatus $44,000 Sold
-
2023-11-21status Pending
-
2023-11-13historical Contingent
-
2023-11-07$44,000 Active
-
2011-03-31soldstatus $48,000
-
1986-08-01soldstatus $20,000
ⓘ Source: listings_history table (triggers on properties + properties_extension) + one-shot
backfill from property_details.listing_events for pre-trigger history.
Tax reassessment forecast AL · Resets to sale price
- Current annual tax
- $687 · $57/mo
- Projected year-2 tax
- $687 · $57/mo
- Expected delta
- $0/yr ($0/mo · 0.0%)
ⓘ Screening estimate from a state-policy table — verify with the county assessor before closing.
Climate risk First Street
- Flood 4/10 Moderate FEMA zone X (unshaded) · 24% chance over 30 yrs
- Wildfire 1/10 Low
- Heat 6/10 Major 7 d/yr ≥106°F today · 19 d/yr by 30 yrs out
- Wind 6/10 Major 27% chance of damaging wind over 30 yrs
- Air quality 4/10 Moderate 5 unhealthy d/yr today · 5 by 30 yrs out
Nearby sold comps map
Loading sold comps map…
Walkable amenities ~0.75 mi
Loading nearby amenities…
Taxation est. · year 1
- Rental income
- $12,588
- − Mortgage interest
- −$2,521
- − Property taxes
- −$687
- − Insurance
- −$225
- − Repairs & maintenance
- −$1,007
- − Management
- −$1,007
- − Depreciation
- −$1,309
- Taxable income
- $5,832
- Est. tax owed @ 24.0%
- −$1,400
- After-tax cash flow
- $4,801/yr
For passive investors: Depreciation is non-cash, so a rental often shows a tax loss while cash-flowing — sheltering income. Rental losses are passive: they offset passive income freely, and up to $25,000/yr can offset ordinary (W-2) income if you actively participate and your MAGI is under $100k (phasing out to $0 by $150k); unused losses carry forward. On sale, claimed depreciation is recaptured at up to 25%, and gains may owe capital-gains tax (a 1031 exchange can defer both). Figures are a year-1 estimate at your 24.0% rate — not tax advice; consult a CPA.
Schools (NCES district)
- District
- Birmingham City
- NCES district ID
- 0100390
- Math proficiency
- 4% ▼ -17.00%
- Reading proficiency
- 20% ▼ -4.00%
- Median HH income
- $31,988
- Composite
- 9.49/100
- National rank
- #9850
- State rank
- #116 of 129 in AL
Livability — Birmingham
- Score
- 67/100
- State rank
- #78
- US rank
- #10412
Category grades
Schools grade is shown separately in the Schools card above.
Census & demographics
- Census place
- Birmingham, AL
- County
- Jefferson County · 527,445 people
- City population
- 210,422
- Metro
- Birmingham-Hoover, AL
- Population (ZIP)
- 24,924
- Household income
- $34,884
- Rent vs Own
- Severe rent burden
- 2161.0
Population outlook (Jefferson County) Hauer SSP2
- Today (2025)
- 669,185 people
- By 2030
- 669,694 · +0.1%
- By 2040
- 661,388 · -1.2%
- By 2050
- 643,086 · -3.9%
- By 2075
- 577,267 · -13.7%
- By 2100
- 474,758 · -29.1%
Race, ethnicity, and origin ACS 2023
- Neighborhood character
- Predominantly Black (77%)
- Race & ethnicity
- Black 77% White 10% Hispanic / Latino 10% Two or more races 4%
- Hispanic origin (detail)
- Mexican 7%
- Foreign-born
- 6% · Canada
- Languages at home
- 91% English-only · Spanish 8% French/Haitian/Cajun 1%
Political lean MEDSL · Jefferson
- 2024 margin
- D (+10.4) · D 54.6% · R 44.2% · Other 1.2%
- 2008→2024 swing
- +5.4pp toward D · 2008: 5.1pp · 2024: 10.4pp
- All cycles
- 2024: D+10.4 2020: D+13.2 2016: D+7.2 2012: D+6.0 2008: D+5.1
Not yet ingested
- Civics
- —
Market trends
- HPI YoY
- ▼ -49.29%
- Current HPI
- 91.2903
- Rent YoY
- ▬ -0.01%
- Metro
- Birmingham-Hoover, AL
- State GDP YoY
- ▲ 2.94%
- F500 in state
- 4
Industry mix (Fortune 500 HQ in AL)
| Industry | F500 HQs | Revenue |
|---|---|---|
| Financial Services | 1 | $8B |
|
||
| Healthcare | 1 | $5B |
|
||
Price history
+125.0% since first listed16 events — show timeline
- 2026-04-30 Price Changed $45,000 Greater Alabama MLS
- 2026-01-16 Price Changed $50,000 Greater Alabama MLS
- 2025-10-22 Listed $55,000 Greater Alabama MLS
- 2025-08-17 Rental Removed $1,200 BUILDIUM
- 2025-07-26 Listed for Rent $1,200 BUILDIUM
- 2024-11-15 Sold (Public Records) $42,000 Public Records
- 2024-11-14 Sold (MLS) $42,000 Greater Alabama MLS
- 2024-11-13 Pending — Greater Alabama MLS
- 2024-08-18 Listed $53,900 Greater Alabama MLS
- 2023-12-01 Sold (Public Records) $44,000 Public Records
- 2023-11-28 Sold (MLS) $44,000 Greater Alabama MLS
- 2023-11-21 Pending — Greater Alabama MLS
- 2023-11-13 Contingent — Greater Alabama MLS
- 2023-11-07 Listed $44,000 Greater Alabama MLS
- 2011-03-31 Sold (Public Records) $48,000 Public Records
- 1986-08-01 Sold (Public Records) $20,000 Public Records
Property tax history
+4.0%/yrLatest (2025): $687 · -23.5% YoY. Source: county tax records.
Cash-flow waterfall
monthlySold comps — $/sqft
last 12 mo · ≤1 miLoading sold comps…