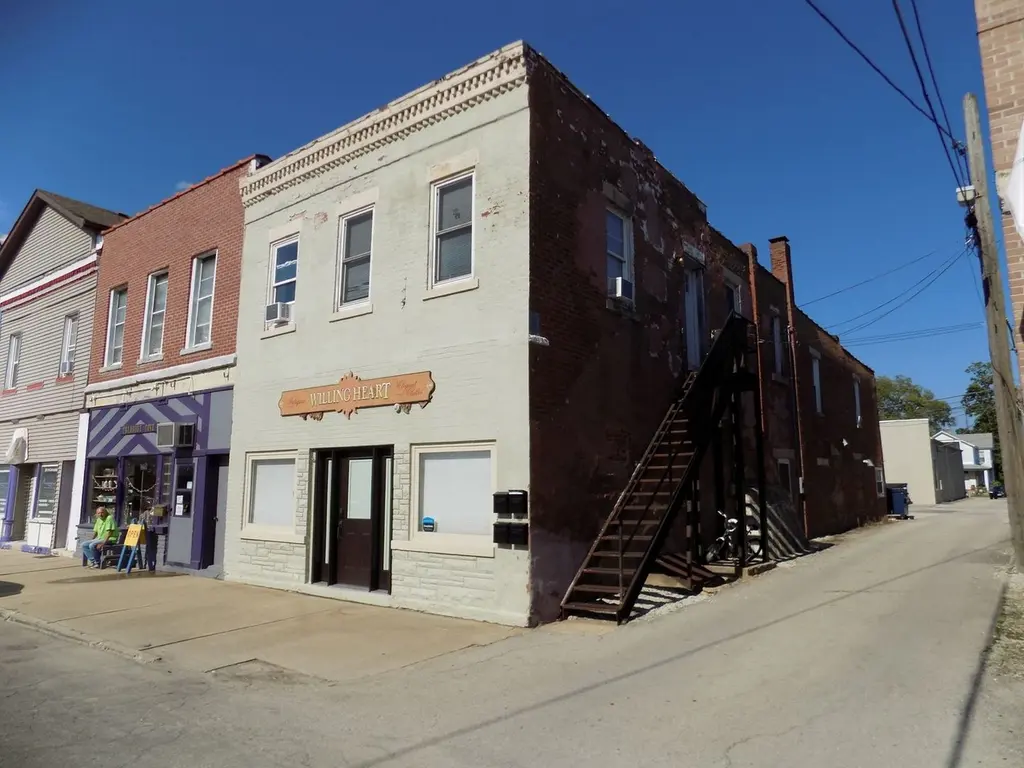
213 N Water St · Wilmington, IL
Flood risk No data
- FEMA flood zone
- —
- Chance of flooding over 30 yrs
- —
- Est. flood insurance / yr
- —
Fire risk No data
- Est. fire insurance / yr
- —
Heat risk No data
- Hot days now (above threshold)
- —
- Hot days in 30 yrs
- —
Wind risk No data
- Chance of severe wind over 30 yrs
- —
Air-quality risk No data
- Unhealthy air days now
- —
- Unhealthy air days in 30 yrs
- —
Risk factors via First Street. Map © Google.
Why this score? — see what drove the F grade
The composite is a weighted blend of 9 inputs, each scored 0–100. Each bar is that input's sub-score; the figure is the points it added to the 100-point composite (weight × sub-score).
- ARV discount +7.5/15.0
- Livability +3.7/5.0
- Schools +3.6/10.0
- Rent growth +2.5/5.0
- Condition / age +2.5/5.0
- Cash flow +0.0/30.0
- 1% rule +0.0/10.0
- DSCR +0.0/10.0
- Appreciation +0.0/10.0
$325,000
🖨 Deal sheet 📄 Offer letter ✓ Due diligence
Listing remarks
Two story commercial building with 2 second floor apartments. All in good condition. Each apartment is 2 bedroom, 1 bath approx 800 sqft each, Down stairs (1-2 units) is approx 1600 sgft, 2 full baths, laundry room, and store room.
Key facts
- 2,860 sq ft lot
- Built 1890
- Listed 10 days
Property features AI
Finance
- Other: Water and sewer expense listed; Trash and insurance expenses listed; Possession at closing with tenant rights
- Financial info: Four-unit building; Gross income approximately $35,000/year; Total monthly income approximately $2,900; Gross rent multiplier 9.28; Annual tax amount listed
Exterior
- Utilities: Circuit breaker electrical service; Separate electrical meters; Service capacity up to 200 amps; 120V power
- Home design: Mixed-use property; Limited Liability Corporation ownership
- Construction: Brick construction; Stone foundation; Rubber flat roof; Built before 1978
- Exterior features: City street frontage; Lot dimensions approximately 22 x 130; Zoned RTAIL
Interior
- Flooring: Wood
- Heating & cooling: Central heat with individual controls; Electric and gas forced air; Chiller cooling; Four window AC units
- Interior features: Wood flooring
- Laundry & utility: One washer and one dryer; Two ranges
Neighborhood map
What this means for you Summary
Snapshot
- This is a condo listed at $325k.
Deal economics
- At list price, monthly cash flow is $-2k ($-27k/yr) — negative.
- Rent doesn't cover operating costs at any purchase price — skip.
Location & tenants
- Location reads 74/100 on livability (#252 in IL, #4,676 nationally) — a middle-class / working-renter tenant base. Strengths: cost of living A+, housing A+, health & safety A+; Watch: schools D, amenities F, commute F.
- Wilmington CUSD 209U (town): math 35% / reading 48% proficiency, ranked #127 of 620 in IL (top 20%) — families likely to look elsewhere, expect single-tenant / working-renter base with shorter leases.
- Market conditions: 81 active listings in the ZIP; 2,028 units permitted in Will County in 2024 (530 in 5+ unit buildings).
Forward outlook
- Local home prices are declining (-3.0%/yr); year-one equity from $2k of loan paydown is wiped out by about $10k of value loss. Plan a longer hold.
- Will County population projected to shrink 4% by 2050 — rents likely to lag national; underwrite the cash flow, not the appreciation.
Negotiation context
- Only 10 days on market — expect competitive offers; lowballing is unlikely to land.
- 3 sale attempts since 15y ago with the ask held roughly flat each time — persistent listings suggest the price (not the market) is what's stuck; bring a comps-based counter.
Risks & watch-outs
- Watch-outs: built in 1890 — expect roof / HVAC / electrical / plumbing capex.
Questions for the listing agent
- What do current leases actually rent for vs. the listed asking? Can we see a recent rent roll and the last 12 months of T-12 income?
- Built in 1890 — when were the roof, HVAC, electrical panel, plumbing, and water heater last replaced?
- Any open or pending special assessments — roof, HVAC, plumbing, elevator, façade? What's the per-unit balance and payoff schedule, and is the seller paying it off at close or rolling it to the buyer?
- Is there a deadline driving the sale (1031 exchange, divorce, estate, relocation)? That informs how much negotiation room exists.
- Schools are D-rated, which usually means shorter tenancies and higher turnover. Who's the typical renter profile here, and what's been the actual vacancy rate?
- The area grade is low — what's the realistic commute time and amenity access for the typical tenant pool here? Any planned neighborhood developments (good or bad) we should know about?
- What's the average days-on-market for RENTAL listings here right now (not sales)? A rising rental-DOM trend means longer vacancies and softer asking-rent achievability than the comps imply.
- What's the recent tenant-quality profile in this submarket — average credit score on applications, eviction rate, late-payment / NSF rate, and stable-employment percentage? A property-management company in the area should have these aggregated.
- How much new apartment / multifamily construction is in the pipeline within 1–3 miles? Heavy new supply (>2% of stock underway) typically softens rents 12–24 months out; light construction supports rent growth.
Investment metrics
- 1% rule
- 0.00% ✗
- Cap rate
- -2.00%
- Cash-on-cash
- -29.62%
- DSCR
- -0.32
- GRM
- 0.0
CMA / ARV
No comps found within radius.
Projected returns pro-forma
-3.0% appreciation · 3.0% rent growth · sell at horizon
- IRR
- -87.0%
- Equity multiple
- -1.15×
- Total profit
- $-195,713
- Equity at exit
- $48,459
- IRR
- —
- Equity multiple
- -2.90×
- Total profit
- $-354,622
- Equity at exit
- $28,100
Cash invested: $91,000 (down + closing). Projections, not guarantees.
Landlord ↔ Tenant lean methodology
- Overall (STATE)
- 43 Moderately Tenant-Leaning
- State Illinois
- 43 Moderately Tenant-Leaning · D+7
- County
- — inherits STATE
- City
- — inherits STATE
ZIP-level market 60481
- Active inventory
- 81
Monthly cashflow live
- Estimated rent
- $0 none
- Mortgage (P&I)
- −$1,704
- Tax est. 1.5%
- −$406 /mo · $4,875/yr
- Insurance
- −$135
- HOA
- −$0
- Vacancy / Maint / Mgmt
- −$0
- Net cashflow
- $-2,246
Break-even live
UW: 25.0% down · 7.5% · 30yr · 1.5% tax · 5.0% vac · 8.0% maint · 8.0% mgmt
Financing live
Cash to close
- Down payment
- $81,250
- Closing costs
- $9,750
- Reserves months
- —
- Total cash needed
- —
Loan-product check · same deal, 3 products live
Conventional
25% down · 7.5% · 30yr
- Down + closing
- —
- Monthly P&I
- —
- Monthly cashflow
- —
- DSCR
- —
- Eligible?
- —
Personal DTI + credit; lowest rate.
DSCR
20% down · 8.5% · 30yr
- Down + closing
- —
- Monthly P&I
- —
- Monthly cashflow
- —
- DSCR
- —
- Eligible?
- —
No personal income docs; deal must DSCR.
Hard money
10% down · 12.0% · 12mo
- Down + closing
- —
- Monthly P&I
- —
- Monthly cashflow
- —
- DSCR
- —
- Eligible?
- —
Short-term bridge; refi at stabilization.
HOA detail condo
- Monthly dues
- $0 · $0/yr
- Assessments
- None detected in remarks — confirm with the listing agent.
Listing history 8 events
-
2026-06-18days on market $325,000 Active 10 DOM
-
2026-06-17days on market $325,000 Active 9 DOM
-
2026-06-16days on market $325,000 Active 8 DOM
-
2026-06-15days on market $325,000 Active 7 DOM
-
2026-06-13days on market $325,000 Active 5 DOM
-
2026-06-13days on market $325,000 Active 4 DOM
-
2026-06-08remarks 231-char remark
-
2026-06-08$325,000 Active 1 DOM
ⓘ Source: listings_history table (triggers on properties + properties_extension) + one-shot
backfill from property_details.listing_events for pre-trigger history.
Nearby sold comps map
Loading sold comps map…
Walkable amenities ~0.75 mi
Loading nearby amenities…
Taxation est. · year 1
- Rental income
- $0
- − Mortgage interest
- −$18,205
- − Property taxes
- −$4,875
- − Insurance
- −$1,625
- − Repairs & maintenance
- −$0
- − Management
- −$0
- − Depreciation
- −$9,455
- Taxable loss
- −$34,160
- Est. tax savings @ 24.0%
- +$8,198
- After-tax cash flow
- $-18,754/yr
For passive investors: Depreciation is non-cash, so a rental often shows a tax loss while cash-flowing — sheltering income. Rental losses are passive: they offset passive income freely, and up to $25,000/yr can offset ordinary (W-2) income if you actively participate and your MAGI is under $100k (phasing out to $0 by $150k); unused losses carry forward. On sale, claimed depreciation is recaptured at up to 25%, and gains may owe capital-gains tax (a 1031 exchange can defer both). Figures are a year-1 estimate at your 24.0% rate — not tax advice; consult a CPA.
Schools (NCES district)
- District
- Wilmington CUSD 209U
- NCES district ID
- 1742630
- Math proficiency
- 35% ▼ -3.00%
- Reading proficiency
- 48% ▼ -6.00%
- Median HH income
- $58,261
- Composite
- 36.48/100
- National rank
- #4654
- State rank
- #127 of 620 in IL
Livability — Wilmington
- Score
- 74/100
- State rank
- #252
- US rank
- #4676
Category grades
Schools grade is shown separately in the Schools card above.
Census & demographics
- Census place
- Wilmington, IL
- Population (ZIP)
- 11,277
Population outlook (Will County) Hauer SSP2
- Today (2025)
- 705,368 people
- By 2030
- 708,154 · +0.4%
- By 2040
- 702,692 · -0.4%
- By 2050
- 680,249 · -3.6%
- By 2075
- 611,990 · -13.2%
- By 2100
- 516,215 · -26.8%
Race, ethnicity, and origin ACS 2023
- Neighborhood character
- Predominantly White (88%)
- Race & ethnicity
- White 88% Hispanic / Latino 7% Two or more races 4% Black 2%
- Hispanic origin (detail)
- Mexican 5%
- Common ancestry
- Romanian 6% Iranian 3% Lithuanian 2%
- Foreign-born
- 4% · Canada, Dominican Republic
- Languages at home
- 94% English-only · Spanish 4%
Political lean MEDSL · Will
- 2024 margin
- Toss-up / Even · D 50.1% · R 48.5% · Other 1.4%
- 2008→2024 swing
- -11.6pp toward R · 2008: 13.2pp · 2024: 1.6pp
- All cycles
- 2024: D+1.6 2020: D+8.3 2016: D+5.7 2012: D+3.7 2008: D+13.2
Not yet ingested
- Civics
- —
Market trends
- HPI YoY
- ▼ -224.12%
- Current HPI
- 230.6346
- Rent YoY
- —
- Metro
- —
- State GDP YoY
- ▲ 1.59%
- F500 in state
- 60
Industry mix (Fortune 500 HQ in IL)
| Industry | F500 HQs | Revenue |
|---|---|---|
| Insurance | 4 | $201B |
|
||
| Consumer Goods | 4 | $87B |
|
||
| Industrial Machinery | 3 | $64B |
|
||
| Healthcare | 2 | $55B |
|
||
| Retail / Pharmacy | 1 | $148B |
|
||
| Agriculture / Food | 1 | $86B |
|
||
Price history
6 events — show timeline
- 2026-06-08 Listed $325,000 MRED as Distributed by MLS Grid
- 2025-04-16 Rental Removed $950 RENTALBEAST
- 2025-04-03 Listed for Rent $950 RENTALBEAST
- 2011-06-21 Listing Removed — MRED as Distributed by MLS Grid
- 2011-04-26 Contingent — MRED as Distributed by MLS Grid
- 2011-01-24 Listed — MRED as Distributed by MLS Grid
Cash-flow waterfall
monthlySold comps — $/sqft
last 12 mo · ≤1 miLoading sold comps…