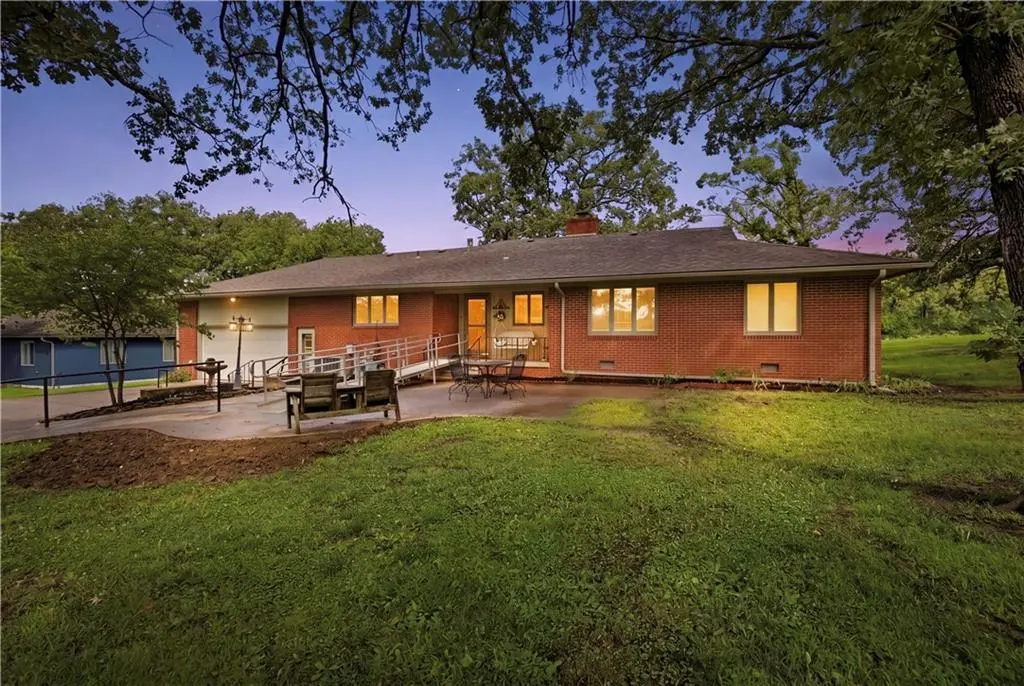
914 N 11th St · Neodesha, KS
Flood risk 1/10 · Minimal
- FEMA flood zone
- X (unshaded)
- Chance of flooding over 30 yrs
- 0.0%
- Est. flood insurance / yr
- $507 – $1,088
Fire risk 4/10 · Minor
- Est. fire insurance / yr
- $1,154 – $2,142
Heat risk 5/10 · Moderate
- Hot days now (above 108°F)
- 7 days/yr
- Hot days in 30 yrs
- 19 days/yr
Wind risk 2/10 · Minimal
- Chance of severe wind over 30 yrs
- 1.0%
Air-quality risk 2/10 · Minimal
- Unhealthy air days now
- 2 days/yr
- Unhealthy air days in 30 yrs
- 2 days/yr
Risk factors via First Street. Map © Google.
Why this score? — see what drove the D grade
The composite is a weighted blend of 9 inputs, each scored 0–100. Each bar is that input's sub-score; the figure is the points it added to the 100-point composite (weight × sub-score).
- Cash flow +13.6/30.0
- ARV discount +7.5/15.0
- Appreciation +4.8/10.0
- DSCR +4.1/10.0
- 1% rule +3.8/10.0
- Livability +3.5/5.0
- Rent growth +2.5/5.0
- Condition / age +2.5/5.0
- Schools +2.4/10.0
$95,000
🖨 Deal sheet (PDF) 📄 Offer letter ✓ Due diligence
Key facts
- 0.41 acre lot
- Garage
- Built 1925
Property features AI
Finance
- Other: Living area reported as 755 (above grade finished area)
Exterior
- Parking: Detached 1-car garage
- Utilities: Public water
- Home design: Single-family residence; Residential property type
- Construction: Frame construction; Composition roof; About 101+ years old
- Exterior features: Lot approximately 0.41 acres; Not in a flood plain; Directions: Heading east on Hwy 75 (Main Street) turn north on 11th Street; home on the east side of the road
Interior
- Bedrooms: 2 bedrooms
- Bathrooms: 1 full bathroom
- Heating & cooling: Natural gas heating; Electric cooling (central)
- Interior features: Bungalow floor plan; Crawl space basement
Neighborhood map
What this means for you Summary
Snapshot
- This is a 2-bed/1.0-bath single-family listed at $95k.
Deal economics
- At list price, monthly cash flow is $5 ($60/yr) — positive.
- The deal already cash-flows at list — no discount required.
- To meet the 1% rule (rent ≥ 1% of price), the offer needs to be $84k (11.9% below list).
- Recommended offer: $84k (11.9% below list) — sets the bar for 1% rule.
Location & tenants
- Location reads 69/100 on livability (#196 in KS) — a middle-class / working-renter tenant base. Strengths: cost of living A+, housing A+, crime A-; Watch: employment D+, amenities F, commute F.
- Neodesha (town): math 25% / reading 30% proficiency, ranked #121 of 169 in KS (top 72%) — low school quality limits family demand, transient renter base, plan for 1-2y turnover.
- Zoned schools: Heller Elem (math 54% / reading 44%, grade D, #165 of 684 statewide, top 28%, 257 students, 69% FRL); North Lawn Elem (math 22% / reading 37%, grade F, #463 of 684 statewide, top 73%, 178 students, 64% FRL); Neodesha High (math 17% / reading 17%, grade F, #235 of 327 statewide, top 74%, 341 students, 55% FRL) — zoned schools average 63% FRL vs 46% district-wide (17 pts higher); higher-poverty schools than district average — tighter screening recommended.
- Market conditions: 22 active listings in the ZIP; 16 units permitted in Wilson County in 2024 (0 in 5+ unit buildings).
Forward outlook
- In year one you build about $264 of equity ($657 loan paydown + $-393 appreciation (-0.4% local appreciation)).
- Wilson County population projected at -25% by 2050 — secular population decline; favor cash flow + early exit over multi-decade hold.
Negotiation context
- Only 1 days on market — expect competitive offers; lowballing is unlikely to land.
Risks & watch-outs
- Watch-outs: built in 1925 — expect roof / HVAC / electrical / plumbing capex.
- Climate carrying-cost: extreme-heat days projected 7→19/yr by 2055 (HVAC capex compounding) — expect insurance premiums to compound above CPI over the hold.
Questions for the listing agent
- Built in 1925 — when were the roof, HVAC, electrical panel, plumbing, and water heater last replaced?
- Is there a deadline driving the sale (1031 exchange, divorce, estate, relocation)? That informs how much negotiation room exists.
- Schools are D-rated, which usually means shorter tenancies and higher turnover. Who's the typical renter profile here, and what's been the actual vacancy rate?
- The area grade is low — what's the realistic commute time and amenity access for the typical tenant pool here? Any planned neighborhood developments (good or bad) we should know about?
- What's the average days-on-market for RENTAL listings here right now (not sales)? A rising rental-DOM trend means longer vacancies and softer asking-rent achievability than the comps imply.
- What's the recent tenant-quality profile in this submarket — average credit score on applications, eviction rate, late-payment / NSF rate, and stable-employment percentage? A property-management company in the area should have these aggregated.
- How much new for-sale + rental construction is in the pipeline within 1–3 miles? Heavy new supply typically softens prices + rents 12–24 months out; constrained supply supports both.
Investment metrics
- 1% rule
- 0.88% ✗
- Cap rate
- 6.36%
- Cash-on-cash
- 0.23%
- DSCR
- 1.01
- GRM
- 9.5
CMA / ARV
No comps found within radius.
Projected returns pro-forma
-0.41% appreciation · 3.0% rent growth · sell at horizon
- IRR
- -3.5%
- Equity multiple
- 0.84×
- Total profit
- $-4,279
- Equity at exit
- $25,635
- IRR
- 2.6%
- Equity multiple
- 1.27×
- Total profit
- $7,168
- Equity at exit
- $29,298
Cash invested: $26,600 (down + closing). Projections, not guarantees.
Landlord ↔ Tenant lean methodology
- Overall (STATE)
- 83 Strongly Landlord-Friendly
- State Kansas
- 83 Strongly Landlord-Friendly · R+10
- County
- — inherits STATE
- City
- — inherits STATE
ZIP-level market 66757
- Home prices YoY
- -0.3%
- Active inventory
- 22
- Price-to-rent
- 9.5×
Monthly cashflow live
- Estimated rent
- $837 medium interval (Pro) →
- Mortgage (P&I)
- −$498
- Tax est. 1.5%
- −$119 /mo · $1,425/yr
- Insurance
- −$40
- HOA
- −$0
- Vacancy / Maint / Mgmt
- −$176
- Net cashflow
- $5
Break-even live
Sensitivity live
| Price | -10% $71 | -5% $38 | +0% $5 | +5% $-28 | +10% $-61 |
|---|---|---|---|---|---|
| Rent | -10% $-61 | -5% $-28 | +0% $5 | +5% $38 | +10% $71 |
| Rate | -1.0pp $53 | -0.5pp $29 | base $5 | +0.5pp $-20 | +1.0pp $-45 |
UW: 25.0% down · 7.5% · 30yr · 1.5% tax · 5.0% vac · 8.0% maint · 8.0% mgmt
Financing live
Cash to close
- Down payment
- $23,750
- Closing costs
- $2,850
- Reserves months
- —
- Total cash needed
- —
Loan-product check · same deal, 3 products live
Conventional
25% down · 7.5% · 30yr
- Down + closing
- —
- Monthly P&I
- —
- Monthly cashflow
- —
- DSCR
- —
- Eligible?
- —
Personal DTI + credit; lowest rate.
DSCR
20% down · 8.5% · 30yr
- Down + closing
- —
- Monthly P&I
- —
- Monthly cashflow
- —
- DSCR
- —
- Eligible?
- —
No personal income docs; deal must DSCR.
Hard money
10% down · 12.0% · 12mo
- Down + closing
- —
- Monthly P&I
- —
- Monthly cashflow
- —
- DSCR
- —
- Eligible?
- —
Short-term bridge; refi at stabilization.
Listing history 9 events
-
2026-06-21statusdays on market $95,000 Active 1 DOM
-
2026-06-21days on market $95,000 Coming Soon 12 DOM
-
2026-06-18days on market $95,000 Coming Soon 10 DOM
-
2026-06-17days on market $95,000 Coming Soon 9 DOM
-
2026-06-16days on market $95,000 Coming Soon 8 DOM
-
2026-06-15days on market $95,000 Coming Soon 7 DOM
-
2026-06-13days on market $95,000 Coming Soon 5 DOM
-
2026-06-12days on market $95,000 Coming Soon 4 DOM
-
2026-06-09$95,000 Coming Soon 1 DOM
ⓘ Source: listings_history table (triggers on properties + properties_extension) + one-shot
backfill from property_details.listing_events for pre-trigger history.
Climate risk First Street
- Flood 1/10 Low FEMA zone X (unshaded) · 0% chance over 30 yrs
- Wildfire 4/10 Moderate
- Heat 5/10 Major 7 d/yr ≥108°F today · 19 d/yr by 30 yrs out
- Wind 2/10 Low 100% chance of damaging wind over 30 yrs
- Air quality 2/10 Low 2 unhealthy d/yr today · 2 by 30 yrs out
Nearby sold comps map
Loading sold comps map…
Walkable amenities ~0.75 mi
Loading nearby amenities…
Taxation est. · year 1
- Rental income
- $10,049
- − Mortgage interest
- −$5,321
- − Property taxes
- −$1,425
- − Insurance
- −$475
- − Repairs & maintenance
- −$804
- − Management
- −$804
- − Depreciation
- −$2,764
- Taxable loss
- −$1,544
- Est. tax savings @ 24.0%
- +$371
- After-tax cash flow
- $431/yr
For passive investors: Depreciation is non-cash, so a rental often shows a tax loss while cash-flowing — sheltering income. Rental losses are passive: they offset passive income freely, and up to $25,000/yr can offset ordinary (W-2) income if you actively participate and your MAGI is under $100k (phasing out to $0 by $150k); unused losses carry forward. On sale, claimed depreciation is recaptured at up to 25%, and gains may owe capital-gains tax (a 1031 exchange can defer both). Figures are a year-1 estimate at your 24.0% rate — not tax advice; consult a CPA.
Schools (NCES district)
- District
- Neodesha
- NCES district ID
- 2009900
- Math proficiency
- 25% ▼ -6.00%
- Reading proficiency
- 30% ▼ -4.00%
- Median HH income
- $43,989
- Composite
- 23.54/100
- National rank
- #7863
- State rank
- #121 of 169 in KS
Livability — Neodesha
- Score
- 69/100
- State rank
- #196
- US rank
- #8894
Category grades
Schools grade is shown separately in the Schools card above.
Census & demographics
- Census place
- Neodesha, KS
- Population (ZIP)
- 3,225
Population outlook (Wilson County) Hauer SSP2
- Today (2025)
- 7,872 people
- By 2030
- 7,383 · -6.2%
- By 2040
- 6,533 · -17.0%
- By 2050
- 5,923 · -24.8%
- By 2075
- 5,134 · -34.8%
- By 2100
- 4,788 · -39.2%
Race, ethnicity, and origin ACS 2023
- Neighborhood character
- Predominantly White (89%)
- Race & ethnicity
- White 89% Two or more races 6% Hispanic / Latino 4%
- Common ancestry
- Italian 7% Lithuanian 1% Slovak 1%
- Foreign-born
- 1% · Canada
- Languages at home
- 98% English-only · Spanish 1%
Political lean MEDSL · Wilson
- 2024 margin
- Solid R (+62.4) · D 18.0% · R 80.3% · Other 1.7%
- 2008→2024 swing
- -21.6pp toward R · 2008: -40.8pp · 2024: -62.4pp
- All cycles
- 2024: R+62.4 2020: R+61.5 2016: R+63.1 2012: R+54.0 2008: R+40.8
Not yet ingested
- Civics
- —
Market trends
- HPI YoY
- ▼ -0.41%
- Current HPI
- 131.4107
- Rent YoY
- —
- Metro
- —
- State GDP YoY
- —
- F500 in state
- 0
Price history
1 event — show timeline
- 2026-06-09 Coming Soon $95,000 Heartland MLS as Distributed by MLS Grid
Cash-flow waterfall
monthlySold comps — $/sqft
last 12 mo · ≤1 miLoading sold comps…