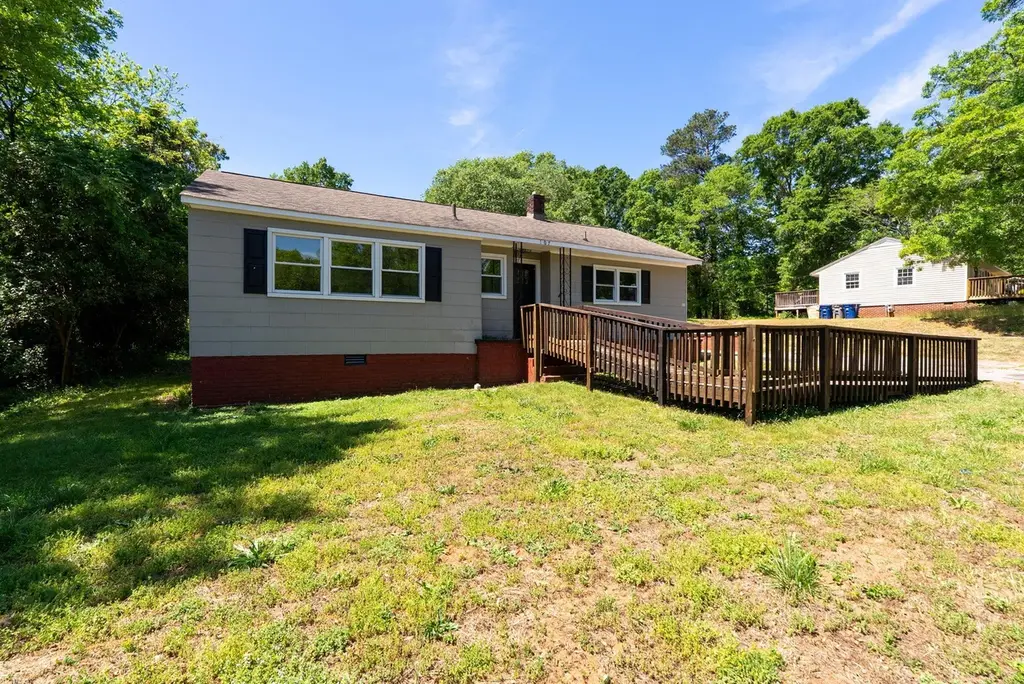
107 Whitener Ave · Spartanburg, SC
Flood risk 1/10 · Minimal
- FEMA flood zone
- X (unshaded)
- Chance of flooding over 30 yrs
- 0.0%
- Est. flood insurance / yr
- $507 – $1,088
Fire risk 3/10 · Minor
- Est. fire insurance / yr
- $783 – $1,453
Heat risk 6/10 · Moderate
- Hot days now (above 105°F)
- 7 days/yr
- Hot days in 30 yrs
- 16 days/yr
Wind risk 2/10 · Minimal
- Chance of severe wind over 30 yrs
- 2.0%
Air-quality risk 4/10 · Minor
- Unhealthy air days now
- 4 days/yr
- Unhealthy air days in 30 yrs
- 4 days/yr
Risk factors via First Street. Map © Google.
Why this score? — see what drove the D grade
The composite is a weighted blend of 9 inputs, each scored 0–100. Each bar is that input's sub-score; the figure is the points it added to the 100-point composite (weight × sub-score).
- Cash flow +13.1/30.0
- ARV discount +8.7/15.0
- DSCR +3.9/10.0
- Livability +3.8/5.0
- Rent growth +3.4/5.0
- 1% rule +3.1/10.0
- Schools +3.1/10.0
- Condition / age +2.5/5.0
- Appreciation +0.0/10.0
$168,700
🖨 Deal sheet (PDF) 📄 Offer letter ✓ Due diligence
Listing remarks
Move In and Make It Yours! The seller is providing a credit at closing to offset your upfront fees, freeing up your budget for personalization. Use the savings to fund your furniture or upgrades right away. Nestled in the desirable Duncan Park community, 107 Whitener Avenue is a beautifully renovated three-bedroom, one-bathroom home designed for modern comfort and accessibility. The interior features a fresh, cohesive palette with upgraded fixtures and high-performance flooring, highlighted by a large living room that boasts abundant natural light and a charming arched entryway. At the heart of the home, the stylish kitchen offers a perfect blend of form and function with elegant countertop
Key facts
- Elegant countertops
- Ample cabinetry
- Stylish kitchen
Tags
Property features AI
Exterior
- Parking: Paved driveway
- Utilities: Public water; Public sewer
- Home design: Single-family residence; One story
- Construction: Vinyl siding; Composition roof; Slab foundation; Built as a residential single-family home
- Exterior features: Corner lot; Level lot; Wooded lot
Interior
- Kitchen: Dishwasher; Microwave; Free-standing range; Refrigerator
- Bedrooms: 3 bedrooms on the main level
- Flooring: Vinyl flooring
- Bathrooms: 1 full bathroom (main level)
- Heating & cooling: Electric heating; Ceiling fan cooling
- Interior features: Ceiling fans; Built-in bookcases
- Laundry & utility: Washer and dryer area in the kitchen on the main level; Electric water heater
Neighborhood map
What this means for you Summary
Snapshot
- This is a 3-bed/1.0-bath single-family listed at $169k.
Deal economics
- At list price, monthly cash flow is $-6 ($-67/yr) — negative.
- To cash-flow at today's rent, offer at most $168k (0.6% below list).
- To meet the 1% rule (rent ≥ 1% of price), the offer needs to be $137k (18.7% below list).
- Recommended offer: $137k (18.7% below list) — sets the bar for 1% rule.
- Cap rate 6.3% vs local median 3.9% in Spartanburg — top-decile yield for the area; either an underpriced asset or a hidden risk that comps aren't pricing in. Stress-test before assuming the spread holds.
Location & tenants
- Location reads 76/100 on livability (#24 in SC, #3,679 nationally) — a middle-class / working-renter tenant base. Strengths: amenities A+, commute A+, cost of living A+; Watch: crime F, employment F.
- Spartanburg 07 (urban): math 34% / reading 41% proficiency, ranked #39 of 80 in SC (top 49%) — families likely to look elsewhere, expect single-tenant / working-renter base with shorter leases; 62% free/reduced lunch — lower-income household profile, screen leases tightly.
- Zoned schools: E. P. Todd School (math 18% / reading 29%, grade F, #467 of 597 statewide, top 78%, 576 students, 100% FRL); Spartanburg High (math 67% / reading 79%, grade B+, #44 of 196 statewide, top 23%, 2,056 students, 85% FRL) — zoned schools average 93% FRL vs 62% district-wide (31 pts higher); higher-poverty schools than district average — tighter screening recommended.
- Market conditions: Rents rising (+3.5%/yr); 236 active listings in the ZIP; 13 comparable units currently listed for rent nearby; rentals at typical pace (median 23d on market — plan ~3-4 weeks tenant-placement turnaround); lower-income renter base — watch delinquency; 3,129 units permitted in Spartanburg County in 2024 (40 in 5+ unit buildings).
- This rent runs 40% of the median local income ($41k/yr) — at the standard rent-burdened threshold; future hikes will face affordability resistance.
Forward outlook
- Local home prices are declining (-3.0%/yr); year-one equity from $1k of loan paydown is wiped out by about $5k of value loss. Plan a longer hold.
- Spartanburg County population projected at +18% by 2050 — long-run rental-demand tailwind backs the buy-and-hold thesis.
Negotiation context
- It's been on market 57 days — a 3% lower offer ($164k) is reasonable based on typical stale-listing flexibility.
- Current owner paid $97k; list at $169k implies a 75% gain — meaningful room to come down on a strong offer.
Risks & watch-outs
- Watch-outs: built in 1958 — expect roof / HVAC / electrical / plumbing capex.
- Climate carrying-cost: extreme-heat days projected 7→16/yr by 2055 (HVAC capex compounding) — expect insurance premiums to compound above CPI over the hold.
Questions for the listing agent
- What do current leases actually rent for vs. the listed asking? Can we see a recent rent roll and the last 12 months of T-12 income?
- It's been on market 57 days. Have you received any prior offers? Is the seller open to a 19% concession, seller financing, or rate buy-down credit?
- Built in 1958 — when were the roof, HVAC, electrical panel, plumbing, and water heater last replaced?
- Is there a deadline driving the sale (1031 exchange, divorce, estate, relocation)? That informs how much negotiation room exists.
- Schools are D-rated, which usually means shorter tenancies and higher turnover. Who's the typical renter profile here, and what's been the actual vacancy rate?
- Crime grade is F in this area — have there been break-ins, vandalism, or insurance claims at this property in the last 3 years? What carrier currently insures it and at what premium?
- The area grade is low — what's the realistic commute time and amenity access for the typical tenant pool here? Any planned neighborhood developments (good or bad) we should know about?
- What's the average days-on-market for RENTAL listings here right now (not sales)? A rising rental-DOM trend means longer vacancies and softer asking-rent achievability than the comps imply.
- What's the recent tenant-quality profile in this submarket — average credit score on applications, eviction rate, late-payment / NSF rate, and stable-employment percentage? A property-management company in the area should have these aggregated.
- How much new for-sale + rental construction is in the pipeline within 1–3 miles? Heavy new supply typically softens prices + rents 12–24 months out; constrained supply supports both.
Investment metrics
- 1% rule
- 0.81% ✗
- Cap rate
- 6.25%
- Cash-on-cash
- -0.14%
- DSCR
- 0.99
- GRM
- 10.2
CMA / ARV
- ARV (on-the-fly)
- $173,280
- Comps found
- 12
Show comp detail 12 sales within ~0.75 mi
| Address | Dist | Beds/Ba | Sqft | Sold | Price | $/sf | Match |
|---|---|---|---|---|---|---|---|
| 136 Prospect Ave | 0.44mi | 3/2.0 | 1,097 (+1%) | 2mo | $180,600 | $165 | 72 |
| 106 Nevada St | 0.51mi | 3/1.0 | 1,041 (-4%) | 1mo | $119,900 | $115 | 69 |
| 201 South Carolina Ave | 0.40mi | 2/1.5 (-1) | 1,050 (-3%) | 4mo | $167,000 | $159 | 66 |
| 205 High St | 0.27mi | 3/1.0 | 1,176 (+9%) | 9mo | $135,000 | $115 | 66 |
| 382 Caulder Ave Ave | 0.50mi | 2/1.0 (-1) | 1,080 (-0%) | 9mo | $72,500 | $67 | 64 |
| 524 Caulder Ave | 0.20mi | 3/2.0 | 1,240 (+14%) | 1mo | $252,000 | $203 | 62 |
| 120 First Ave Ave | 0.67mi | 3/2.0 | 1,100 (+2%) | 2mo | $135,000 | $123 | 60 |
| 208B Collins Ave | 0.35mi | 2/2.0 (-1) | 954 (-12%) | 1mo | $166,000 | $174 | 54 |
| 128 Owens St | 0.48mi | 3/2.0 | 960 (-11%) | 10mo | $155,000 | $161 | 46 |
| 213 Loring St | 0.54mi | 3/2.0 | 1,230 (+14%) | 10mo | $197,000 | $160 | 40 |
| 218 Caulder Cir | 0.65mi | 3/2.0 | 1,237 (+14%) | 10mo | $199,990 | $162 | 34 |
| 216 Caulder Cir | 0.66mi | 3/2.0 | 1,237 (+14%) | 10mo | $194,990 | $158 | 33 |
Match score weights: distance 35% · size 25% · config 20% · recency 20%. Top-matched comps best support the ARV.
Projected returns pro-forma
-3.0% appreciation · 3.46% rent growth · sell at horizon
- IRR
- -16.1%
- Equity multiple
- 0.43×
- Total profit
- $-27,080
- Equity at exit
- $25,154
- IRR
- -7.0%
- Equity multiple
- 0.54×
- Total profit
- $-21,503
- Equity at exit
- $14,586
Cash invested: $47,236 (down + closing). Projections, not guarantees.
Landlord ↔ Tenant lean methodology
- Overall (STATE)
- 90 Strongly Landlord-Friendly
- State South Carolina
- 90 Strongly Landlord-Friendly · R+6
- County
- — inherits STATE
- City
- — inherits STATE
ZIP-level market 29306
- Home prices YoY
- -29.9%
- Rents YoY
- 3.5%
- Active inventory
- 236
- Price-to-rent
- 10.2×
Monthly cashflow live
- Estimated rent
- $1,372 high interval (Pro) →
- Mortgage (P&I)
- −$885
- Tax from tax record
- −$134 /mo · $1,612/yr
- Insurance
- −$70
- HOA
- −$0
- Vacancy / Maint / Mgmt
- −$288
- Net cashflow
- $-6
Break-even live
Sensitivity live
| Price | -10% $90 | -5% $42 | +0% $-6 | +5% $-53 | +10% $-101 |
|---|---|---|---|---|---|
| Rent | -10% $-114 | -5% $-60 | +0% $-6 | +5% $49 | +10% $103 |
| Rate | -1.0pp $79 | -0.5pp $37 | base $-6 | +0.5pp $-49 | +1.0pp $-94 |
UW: 25.0% down · 7.5% · 30yr · 1.5% tax · 5.0% vac · 8.0% maint · 8.0% mgmt
Financing live
Cash to close
- Down payment
- $42,175
- Closing costs
- $5,061
- Reserves months
- —
- Total cash needed
- —
Loan-product check · same deal, 3 products live
Conventional
25% down · 7.5% · 30yr
- Down + closing
- —
- Monthly P&I
- —
- Monthly cashflow
- —
- DSCR
- —
- Eligible?
- —
Personal DTI + credit; lowest rate.
DSCR
20% down · 8.5% · 30yr
- Down + closing
- —
- Monthly P&I
- —
- Monthly cashflow
- —
- DSCR
- —
- Eligible?
- —
No personal income docs; deal must DSCR.
Hard money
10% down · 12.0% · 12mo
- Down + closing
- —
- Monthly P&I
- —
- Monthly cashflow
- —
- DSCR
- —
- Eligible?
- —
Short-term bridge; refi at stabilization.
Rent comps 13 comps
| Address | Beds | Baths | Sqft | Rent | $/sqft | DOM | Units | Dist |
|---|---|---|---|---|---|---|---|---|
| 88 W Park Dr Unit H Spartanburg, SC | 2.0 | 1.0 | 950 | $875 | $0.92 | 23d | 1 | 0.57mi |
| 102 Harvard Dr Spartanburg, SC | 2.0 | 1.0 | 1000 | $1,300 | $1.30 | 15d | 1 | 0.77mi |
| 938 Logan St Unit A Spartanburg, SC | 2.0 | 2.5 | 980 | $1,600 | $1.63 | 23d | 1 | 0.79mi |
| 630 S Converse St Spartanburg, SC | 2.0 | 1.0 | 912 | $995 | $1.09 | 23d | 1 | 0.84mi |
| 1097 Union St Spartanburg, SC | 1.0–2.0 | 1.0–2.0 | 951 | $2,009 | $2.11 | 15d | 21 | 0.98mi |
| 249 E Hampton Ave Spartanburg, SC | 3.0 | 2.0 | 1450 | $1,475 | $1.02 | 23d | 1 | 1.06mi |
| 318 Alexander Ave Spartanburg, SC | 4.0 | 2.0 | 1480 | $1,695 | $1.15 | 23d | 1 | 1.08mi |
| 118 Morningside Dr Spartanburg, SC | 2.0 | 1.0 | 800 | $850 | $1.06 | 23d | 1 | 1.18mi |
| 116 Morningside Dr Spartanburg, SC | 2.0 | 1.0 | 800 | $850 | $1.06 | 23d | 1 | 1.18mi |
| 624 Crescent Ave Unit 1 Spartanburg, SC | 2.0 | 1.0 | 819 | $1,000 | $1.22 | 23d | 1 | 1.33mi |
| 717 Connecticut Ave Spartanburg, SC | 3.0 | 1.0 | 1320 | $1,895 | $1.44 | 15d | 1 | 1.37mi |
| 111 Timothy St Spartanburg, SC | 2.0 | 1.0 | 1100 | $1,600 | $1.45 | 23d | 1 | 1.40mi |
| 334 W Hampton Ave Unit 1 Spartanburg, SC | 2.0 | 1.0 | 895 | $1,100 | $1.23 | 23d | 1 | 1.42mi |
Listing history 20 events
-
2026-06-18days on market $168,700 Active 57 DOM
-
2026-06-17days on market $168,700 Active 56 DOM
-
2026-06-16days on market $168,700 Active 55 DOM
-
2026-06-15days on market $168,700 Active 54 DOM
-
2026-06-14days on market $168,700 Active 52 DOM
-
2026-06-13days on market $168,700 Active 51 DOM
-
2026-06-10days on market $168,700 Active 49 DOM
-
2026-06-09days on market $168,700 Active 48 DOM
-
2026-06-08days on market $168,700 Active 47 DOM
-
2026-06-07days on market $168,700 Active 46 DOM
-
2026-06-02days on market $168,700 Active 41 DOM
-
2026-06-01days on market $168,700 Active 40 DOM
-
2026-05-31days on market $168,700 Active 39 DOM
-
2026-05-30days on market $168,700 Active 38 DOM
-
2026-05-13price $171,500
-
2026-04-22$174,500 Active
-
2025-10-30soldstatus $96,667
-
2022-03-15price $1,050
-
2021-12-31soldstatus $3,050,000
-
1992-06-01soldstatus $30,415
ⓘ Source: listings_history table (triggers on properties + properties_extension) + one-shot
backfill from property_details.listing_events for pre-trigger history.
Tax reassessment forecast SC · Resets to sale price
- Current annual tax
- $1,612 · $134/mo
- Projected year-2 tax
- $1,612 · $134/mo
- Expected delta
- $0/yr ($0/mo · 0.0%)
ⓘ Screening estimate from a state-policy table — verify with the county assessor before closing.
Climate risk First Street
- Flood 1/10 Low FEMA zone X (unshaded) · 0% chance over 30 yrs
- Wildfire 3/10 Moderate
- Heat 6/10 Major 7 d/yr ≥105°F today · 16 d/yr by 30 yrs out
- Wind 2/10 Low 2% chance of damaging wind over 30 yrs
- Air quality 4/10 Moderate 4 unhealthy d/yr today · 4 by 30 yrs out
Nearby sold comps map
Loading sold comps map…
Walkable amenities ~0.75 mi
Loading nearby amenities…
Taxation est. · year 1
- Rental income
- $16,462
- − Mortgage interest
- −$9,450
- − Property taxes
- −$1,612
- − Insurance
- −$844
- − Repairs & maintenance
- −$1,317
- − Management
- −$1,317
- − Depreciation
- −$4,908
- Taxable loss
- −$2,985
- Est. tax savings @ 24.0%
- +$716
- After-tax cash flow
- $650/yr
For passive investors: Depreciation is non-cash, so a rental often shows a tax loss while cash-flowing — sheltering income. Rental losses are passive: they offset passive income freely, and up to $25,000/yr can offset ordinary (W-2) income if you actively participate and your MAGI is under $100k (phasing out to $0 by $150k); unused losses carry forward. On sale, claimed depreciation is recaptured at up to 25%, and gains may owe capital-gains tax (a 1031 exchange can defer both). Figures are a year-1 estimate at your 24.0% rate — not tax advice; consult a CPA.
Schools (NCES district)
- District
- Spartanburg 07
- NCES district ID
- 4503660
- Math proficiency
- 34% ▼ -1.00%
- Reading proficiency
- 41% ▼ -1.00%
- Median HH income
- $35,825
- Composite
- 31.04/100
- National rank
- #6087
- State rank
- #39 of 80 in SC
Livability — Spartanburg
- Score
- 76/100
- State rank
- #24
- US rank
- #3679
Category grades
Schools grade is shown separately in the Schools card above.
Census & demographics
- Census place
- Spartanburg, SC
- County
- Spartanburg County · 258,607 people
- City population
- 120,406
- Metro
- Spartanburg, SC
- Population (ZIP)
- 16,714
- Household income
- $41,356
- Rent vs Own
- Severe rent burden
- 1064.0
Population outlook (Spartanburg County) Hauer SSP2
- Today (2025)
- 325,495 people
- By 2030
- 338,800 · +4.1%
- By 2040
- 363,471 · +11.7%
- By 2050
- 384,156 · +18.0%
- By 2075
- 430,137 · +32.1%
- By 2100
- 442,733 · +36.0%
Race, ethnicity, and origin ACS 2023
- Neighborhood character
- Diverse neighborhood (Simpson 0.61)
- Race & ethnicity
- Black 50% White 36% Hispanic / Latino 10% Two or more races 9% Asian 1%
- Hispanic origin (detail)
- Mexican 7% Puerto Rican 2%
- Common ancestry
- Slovak 1% Serbian 1% Iranian 1%
- Foreign-born
- 7% · Canada
- Languages at home
- 90% English-only · Spanish 7% Other Indo-European 2%
Political lean MEDSL · Spartanburg
- 2024 margin
- Solid R (+33.6) · D 32.6% · R 66.2% · Other 1.2%
- 2008→2024 swing
- -12.0pp toward R · 2008: -21.6pp · 2024: -33.6pp
- All cycles
- 2024: R+33.6 2020: R+27.3 2016: R+30.0 2012: R+23.1 2008: R+21.6
Not yet ingested
- Civics
- —
Market trends
- HPI YoY
- ▼ -90.67%
- Current HPI
- 213.1266
- Rent YoY
- ▲ 3.46%
- Metro
- Spartanburg, SC
- State GDP YoY
- ▲ 4.51%
- F500 in state
- 2
Industry mix (Fortune 500 HQ in SC)
| Industry | F500 HQs | Revenue |
|---|---|---|
| Packaging | 1 | $7B |
|
||
Price history
+463.9% since first listed6 events — show timeline
- 2026-05-13 Price Changed $171,500 SPMLS
- 2026-04-22 Listed $174,500 SPMLS
- 2025-10-30 Sold (Public Records) $96,667 Public Records
- 2022-03-15 Price Changed $1,050 RENT.
- 2021-12-31 Sold (Public Records) $3,050,000 Public Records
- 1992-06-01 Sold (Public Records) $30,415 Public Records
Property tax history
+6.1%/yrLatest (2025): $1,612 · +0.8% YoY. Source: county tax records.
Cash-flow waterfall
monthlySold comps — $/sqft
last 12 mo · ≤1 miLoading sold comps…