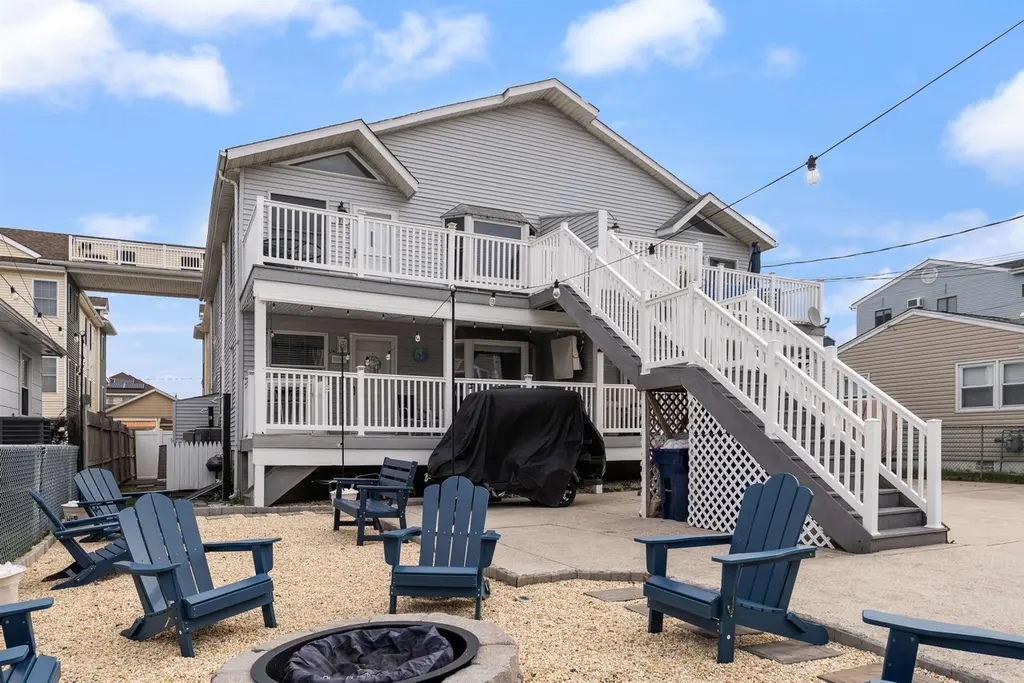
111 E Magnolia Ave Unit C · Wildwood, NJ
Flood risk 9/10 · Severe
- FEMA flood zone
- AE
- Chance of flooding over 30 yrs
- 0.99%
- Est. flood insurance / yr
- $1,737 – $8,500
Fire risk 1/10 · Minimal
- Est. fire insurance / yr
- $526 – $976
Heat risk 8/10 · Major
- Hot days now (above 95°F)
- 7 days/yr
- Hot days in 30 yrs
- 18 days/yr
Wind risk 8/10 · Major
- Chance of severe wind over 30 yrs
- 80.0%
Air-quality risk 2/10 · Minimal
- Unhealthy air days now
- 1 days/yr
- Unhealthy air days in 30 yrs
- 1 days/yr
Risk factors via First Street. Map © Google.
Why this score? — see what drove the C- grade
The composite is a weighted blend of 9 inputs, each scored 0–100. Each bar is that input's sub-score; the figure is the points it added to the 100-point composite (weight × sub-score).
- Cash flow +23.0/30.0
- ARV discount +7.5/15.0
- DSCR +7.4/10.0
- 1% rule +5.8/10.0
- Livability +3.7/5.0
- Rent growth +2.5/5.0
- Condition / age +2.5/5.0
- Schools +1.6/10.0
- Appreciation +0.0/10.0
$525,000
🖨 Deal sheet 📄 Offer letter ✓ Due diligence
Listing remarks MLS
Beautifully maintained and completely re-done 2nd floor condo featuring 3 bedrooms and two baths. Condo also includes an exterior storage closet for beach gear, plus inside storage in attic. Assigned, off street, stacked parking for 2 cars. Watch the Friday night fireworks all summer from the private deck. Condo fee includes insurance, water & sewer. Easy walking distance to the beach & boardwalk.
Key facts
- Built-in dining nook
- Private front deck
- Updated kitchen
Tags
Property features AI
Finance
- HOA & community: Condo fee of $375
Exterior
- Parking: Assigned parking for 2 cars; Concrete driveway
- Utilities: City water; City sewer; Electric hot water
- Home design: Unit C
- Exterior features: Outside shower; Year-round use; Owners allowed pets; Approximately 3 blocks to the beach
Interior
- Kitchen: Range; Oven; Self-cleaning oven; Microwave; Refrigerator; Dishwasher
- Bedrooms: 3 bedrooms
- Bathrooms: 2 full bathrooms
- Heating & cooling: Electric forced-air heating; Central air conditioning
- Interior features: Living room; Eat-in kitchen; Other rooms as noted
- Laundry & utility: Washer; Dryer; Laundry/utility room
Neighborhood map
What this means for you Summary
Snapshot
- This is a 3-bed/2.0-bath condo listed at $525k.
Deal economics
- At list price, monthly cash flow is $508 ($6k/yr) — positive.
- The deal already cash-flows at list — no discount required.
- Meets the 1% rule at list price ($6k rent vs $525k).
- Recommended offer: $517k (1.5% below list) — sets the bar for market timing.
- Cap rate 8.4% vs local median 5.6% in Wildwood — top-decile yield for the area; either an underpriced asset or a hidden risk that comps aren't pricing in. Stress-test before assuming the spread holds.
Location & tenants
- Location reads 74/100 on livability (#176 in NJ, #4,679 nationally) — a middle-class / working-renter tenant base. Strengths: amenities A+, commute A+, health & safety A+; Watch: employment D, schools F, crime F.
- Wildwood City School District (suburban): math 12% / reading 27% proficiency, ranked #442 of 472 in NJ (top 94%) — low school quality limits family demand, transient renter base, plan for 1-2y turnover; 80% free/reduced lunch — lower-income household profile, screen leases tightly.
- Market conditions: 431 active listings in the ZIP; 4 comparable units currently listed for rent nearby; rentals lingering (median 44d on market — plan ~5-8 weeks vacancy on turnover, expect pricing pressure); 100% of comp listings sitting > 30 days — soft ceiling on asking rent; 877 units permitted in Cape May County in 2024 (35 in 5+ unit buildings).
Forward outlook
- Local home prices are declining (-3.0%/yr); year-one equity from $4k of loan paydown is wiped out by about $16k of value loss. Plan a longer hold.
- Cape May County population projected at -24% by 2050 — secular population decline; favor cash flow + early exit over multi-decade hold.
Negotiation context
- It's been on market 17 days — a 2% lower offer ($517k) is reasonable based on typical stale-listing flexibility.
- 4 sale attempts since 25y ago with the ask held roughly flat each time — persistent listings suggest the price (not the market) is what's stuck; bring a comps-based counter.
- Current owner paid $190k; list at $525k implies a 176% gain — meaningful room to come down on a strong offer.
Risks & watch-outs
- Watch-outs: flood insurance adds $427/mo.
- Climate carrying-cost: in FEMA flood zone AE (mandatory federal flood insurance); severe wind risk, 80% chance of damaging wind over 30y; extreme-heat days projected 7→18/yr by 2055 (HVAC capex compounding) — expect insurance premiums to compound above CPI over the hold.
Questions for the listing agent
- What's the actual annual flood-insurance premium (NFIP or private), and is the property in a SFHA with mandatory coverage?
- What does the HOA fee cover, when was the last increase, and are there any pending special assessments or reserve-fund shortfalls?
- Any open or pending special assessments — roof, HVAC, plumbing, elevator, façade? What's the per-unit balance and payoff schedule, and is the seller paying it off at close or rolling it to the buyer?
- Is there a deadline driving the sale (1031 exchange, divorce, estate, relocation)? That informs how much negotiation room exists.
- Schools are F-rated, which usually means shorter tenancies and higher turnover. Who's the typical renter profile here, and what's been the actual vacancy rate?
- Crime grade is F in this area — have there been break-ins, vandalism, or insurance claims at this property in the last 3 years? What carrier currently insures it and at what premium?
- What's the average days-on-market for RENTAL listings here right now (not sales)? A rising rental-DOM trend means longer vacancies and softer asking-rent achievability than the comps imply.
- What's the recent tenant-quality profile in this submarket — average credit score on applications, eviction rate, late-payment / NSF rate, and stable-employment percentage? A property-management company in the area should have these aggregated.
- How much new apartment / multifamily construction is in the pipeline within 1–3 miles? Heavy new supply (>2% of stock underway) typically softens rents 12–24 months out; light construction supports rent growth.
Investment metrics
- 1% rule
- 1.08% ✓
- Cap rate
- 8.43%
- Cash-on-cash
- 7.63%
- DSCR
- 1.34
- GRM
- 7.7
CMA / ARV
No comps found within radius.
Projected returns pro-forma
-3.0% appreciation · 3.0% rent growth · sell at horizon
- IRR
- -9.7%
- Equity multiple
- 0.64×
- Total profit
- $-52,389
- Equity at exit
- $78,279
- IRR
- -0.3%
- Equity multiple
- 0.98×
- Total profit
- $-2,683
- Equity at exit
- $45,392
Cash invested: $147,000 (down + closing). Projections, not guarantees.
Landlord ↔ Tenant lean methodology
- Overall (STATE)
- 21 Tenant-Leaning
- State New Jersey
- 21 Tenant-Leaning · D+6
- County
- — inherits STATE
- City
- — inherits STATE
ZIP-level market 08260
- Home prices YoY
- -30.7%
- Active inventory
- 431
- Price-to-rent
- 7.7×
Monthly cashflow live
- Estimated rent
- $5,691 medium interval (Pro) →
- Mortgage (P&I)
- −$2,753
- Tax from tax record
- −$441 /mo · $5,292/yr
- Insurance
- −$219
- Flood insurance flood zone
- −$427 /mo · $5,118/yr
- HOA est. from 2 same-building comps
- −$148
- Vacancy / Maint / Mgmt
- −$1,195
- Net cashflow
- $508
Break-even live
UW: 25.0% down · 7.5% · 30yr · 1.5% tax · 5.0% vac · 8.0% maint · 8.0% mgmt
Financing live
Cash to close
- Down payment
- $131,250
- Closing costs
- $15,750
- Reserves months
- —
- Total cash needed
- —
Loan-product check · same deal, 3 products live
Conventional
25% down · 7.5% · 30yr
- Down + closing
- —
- Monthly P&I
- —
- Monthly cashflow
- —
- DSCR
- —
- Eligible?
- —
Personal DTI + credit; lowest rate.
DSCR
20% down · 8.5% · 30yr
- Down + closing
- —
- Monthly P&I
- —
- Monthly cashflow
- —
- DSCR
- —
- Eligible?
- —
No personal income docs; deal must DSCR.
Hard money
10% down · 12.0% · 12mo
- Down + closing
- —
- Monthly P&I
- —
- Monthly cashflow
- —
- DSCR
- —
- Eligible?
- —
Short-term bridge; refi at stabilization.
Rent comps 4 comps
| Address | Beds | Baths | Sqft | Rent | $/sqft | DOM | Units | Dist |
|---|---|---|---|---|---|---|---|---|
| 154 E Lincoln Ave #104 Wildwood, NJ | 3.0 | 2.5 | 1500 | $4,750 | $3.17 | 43d | 1 | 0.38mi |
| 206 W Spencer Ave Wildwood, NJ | 2.0 | 1.0 | 750 | $2,000 | $2.67 | 44d | 1 | 0.56mi |
| 142 E Youngs Ave Unit 1309014P Wildwood, NJ | 3.0 | 1.5 | 1194 | $5,873 | $4.92 | 43d | 1 | 0.58mi |
| 611 W Burk Ave Unit A Wildwood, NJ | 2.0 | 1.5 | 1248 | $12,000 | $9.62 | 43d | 1 | 1.01mi |
HOA detail condo
- Monthly dues
- $0 · $0/yr
- Likely covers
- watersewer
- Assessments
- None detected in remarks — confirm with the listing agent.
Listing history 13 events
-
2026-06-18days on market $525,000 Active 17 DOM
-
2026-06-17days on market $525,000 Active 16 DOM
-
2026-06-16days on market $525,000 Active 15 DOM
-
2026-06-15days on market $525,000 Active 14 DOM
-
2026-06-13days on market $525,000 Active 12 DOM
-
2026-06-12days on market $525,000 Active 11 DOM
-
2026-06-09days on market $525,000 Active 8 DOM
-
2026-06-08days on market $525,000 Active 7 DOM
-
2026-06-07days on market $525,000 Active 6 DOM
-
2026-06-07days on market $525,000 Active 5 DOM
-
2026-06-04days on market $525,000 Active 2 DOM
-
2026-06-01remarks 699-char remark
-
2026-06-01$525,000 Active 1 DOM
ⓘ Source: listings_history table (triggers on properties + properties_extension) + one-shot
backfill from property_details.listing_events for pre-trigger history.
Tax reassessment forecast NJ · Partial reset (capped growth)
- Current annual tax
- $5,292 · $441/mo
- Projected year-2 tax
- $9,182 · $765/mo
- Expected delta
- +$3,890/yr (+$324/mo · 73.5%)
ⓘ Screening estimate from a state-policy table — verify with the county assessor before closing.
Climate risk First Street
- Flood 9/10 Extreme FEMA zone AE · 99% chance over 30 yrs
- Wildfire 1/10 Low
- Heat 8/10 Severe 7 d/yr ≥95°F today · 18 d/yr by 30 yrs out
- Wind 8/10 Severe 80% chance of damaging wind over 30 yrs
- Air quality 2/10 Low 1 unhealthy d/yr today · 1 by 30 yrs out
Nearby sold comps map
Loading sold comps map…
Walkable amenities ~0.75 mi
Loading nearby amenities…
Taxation est. · year 1
- Rental income
- $68,291
- − Mortgage interest
- −$29,408
- − Property taxes
- −$5,292
- − Insurance
- −$7,744
- − Repairs & maintenance
- −$5,463
- − Management
- −$5,463
- − HOA
- −$1,776
- − Depreciation
- −$15,273
- Taxable loss
- −$2,128
- Est. tax savings @ 24.0%
- +$511
- After-tax cash flow
- $6,611/yr
For passive investors: Depreciation is non-cash, so a rental often shows a tax loss while cash-flowing — sheltering income. Rental losses are passive: they offset passive income freely, and up to $25,000/yr can offset ordinary (W-2) income if you actively participate and your MAGI is under $100k (phasing out to $0 by $150k); unused losses carry forward. On sale, claimed depreciation is recaptured at up to 25%, and gains may owe capital-gains tax (a 1031 exchange can defer both). Figures are a year-1 estimate at your 24.0% rate — not tax advice; consult a CPA.
Schools (NCES district)
- District
- Wildwood City School District
- NCES district ID
- 3417940
- Math proficiency
- 12% ▼ -6.00%
- Reading proficiency
- 27% ▲ 5.00%
- Median HH income
- $33,232
- Composite
- 15.84/100
- National rank
- #9261
- State rank
- #442 of 472 in NJ
Livability — Wildwood
- Score
- 74/100
- State rank
- #176
- US rank
- #4679
Category grades
Schools grade is shown separately in the Schools card above.
Census & demographics
- Census place
- Wildwood, NJ
- Population (ZIP)
- 12,913
Population outlook (Cape May County) Hauer SSP2
- Today (2025)
- 88,234 people
- By 2030
- 84,144 · -4.6%
- By 2040
- 75,146 · -14.8%
- By 2050
- 67,389 · -23.6%
- By 2075
- 55,732 · -36.8%
- By 2100
- 44,972 · -49.0%
Race, ethnicity, and origin ACS 2023
- Neighborhood character
- Predominantly White (78%)
- Race & ethnicity
- White 78% Hispanic / Latino 14% Two or more races 7% Black 3% Native American 1%
- Hispanic origin (detail)
- Mexican 10% Puerto Rican 3%
- Common ancestry
- Romanian 7% Slovak 2% Lithuanian 1%
- Foreign-born
- 9% · Canada
- Languages at home
- 84% English-only · Spanish 12% Other Indo-European 3% French/Haitian/Cajun 1%
Political lean MEDSL · Cape May
- 2024 margin
- R (+19.2) · D 39.7% · R 58.9% · Other 1.4%
- 2008→2024 swing
- -10.6pp toward R · 2008: -8.7pp · 2024: -19.2pp
- All cycles
- 2024: R+19.2 2020: R+15.9 2016: R+19.9 2012: R+8.9 2008: R+8.7
Not yet ingested
- Civics
- —
Market trends
- HPI YoY
- ▼ -243.83%
- Current HPI
- 551.3393
- Rent YoY
- —
- Metro
- —
- State GDP YoY
- ▲ 2.05%
- F500 in state
- 34
Industry mix (Fortune 500 HQ in NJ)
| Industry | F500 HQs | Revenue |
|---|---|---|
| Consumer Goods | 3 | $31B |
|
||
| Pharmaceuticals | 2 | $153B |
|
||
| Technology | 2 | $21B |
|
||
| Insurance | 2 | $20B |
|
||
| Healthcare | 2 | $19B |
|
||
| Financial Services | 1 | $70B |
|
||
Price history
+776.5% since first listed11 events — show timeline
- 2026-06-01 Listed $525,000 CMCMLS
- 2015-10-27 Sold (Public Records) $190,000 Public Records
- 2015-10-09 Sold (MLS) $190,000 CMCMLS
- 2015-09-10 Delisted — CMCMLS
- 2015-08-30 Listed $199,900 CMCMLS
- 2012-11-15 Sold (Public Records) $161,500 Public Records
- 2012-11-09 Sold (MLS) $161,500 CMCMLS
- 2012-08-04 Listed $169,000 CMCMLS
- 2001-05-16 Sold (MLS) $58,000 SJSRMLS
- 2001-04-03 Listing Removed — SJSRMLS
- 2001-03-06 Listed $59,900 SJSRMLS
Property tax history
+2.9%/yrLatest (2025): $5,292 · +2.8% YoY. Source: county tax records.
Cash-flow waterfall
monthlySold comps — $/sqft
last 12 mo · ≤1 miLoading sold comps…