 Triplex
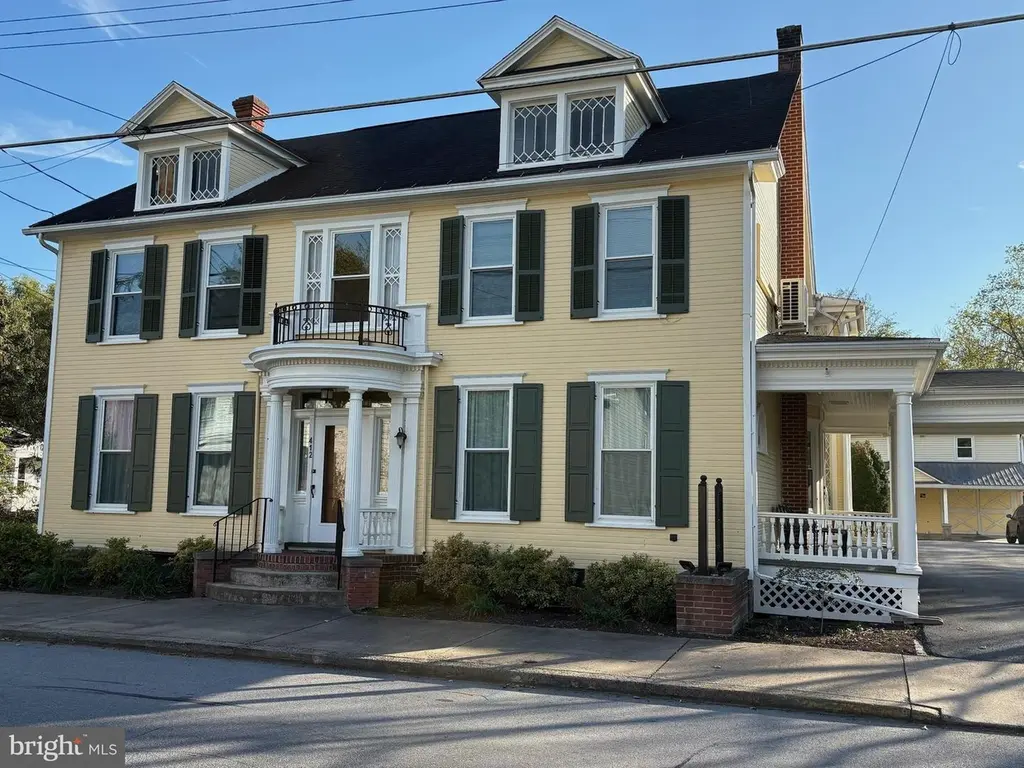
412 Main St · Alexandria, PA
Flood risk No data
- FEMA flood zone
- —
- Chance of flooding over 30 yrs
- —
- Est. flood insurance / yr
- —
Fire risk No data
- Est. fire insurance / yr
- —
Heat risk No data
- Hot days now (above threshold)
- —
- Hot days in 30 yrs
- —
Wind risk No data
- Chance of severe wind over 30 yrs
- —
Air-quality risk No data
- Unhealthy air days now
- —
- Unhealthy air days in 30 yrs
- —
Risk factors via First Street. Map © Google.
Why this score? — see what drove the B- grade
The composite is a weighted blend of 9 inputs, each scored 0–100. Each bar is that input's sub-score; the figure is the points it added to the 100-point composite (weight × sub-score).
- Cash flow +25.8/30.0
- DSCR +8.6/10.0
- ARV discount +7.5/15.0
- Appreciation +7.0/10.0
- 1% rule +6.8/10.0
- Condition / age +3.8/5.0
- Schools +3.1/10.0
- Livability +3.1/5.0
- Rent growth +2.5/5.0
$335,000
🖨 Deal sheet 📄 Offer letter ✓ Due diligence
Multi-family units
County records classify this as Multi-Family (2-4 Unit). Listing-text estimate: 3 units. confirmed
Listing remarks
Step into a piece of history with this stunning mid-19th century property, originally built by William Shaw in the 1850s and beautifully situated in the quiet town of Alexandria. Rich with timeless character and thoughtfully adapted for modern living, this unique estate offers exceptional versatility—ideal for multi-family use or generating rental income to help offset your mortgage. The stately main residence is thoughtfully divided into two spacious units. The first-floor apartment features three large bedrooms, one full bath, and an impressive double parlor showcasing classic architectural columns, rich woodwork, french doors, and a fireplace that anchors the space. Upstairs, the s
Key facts
- 0.33 acre lot
- 4 garage spots
- Built 1600
Property features AI
Finance
- Financial info: Long-term existing leases on some units; Two units currently leased and two units vacant
Exterior
- Parking: Attached garage; Detached garage; Front-entry and side-entry garage access; Paved driveway; Total of 4 garage/parking spaces (4 garage spaces: 1 attached, 3 detached)
- Utilities: Community water; Community septic tank
- Home design: Detached structure; Total of 3 residential units
- Construction: Frame construction with wood siding; Rubber and shingle roof; Foundation: other; Other structures both above grade and below grade; Built (year source: assessor)
- Exterior features: No tidal water; Above-grade finished living area reported
Interior
- Bedrooms: Contains multiple units: one 1‑bedroom unit, one 2‑bedroom unit, and two 3‑bedroom units
- Heating & cooling: Hot water heating; Oil fuel; Electric hot water
- Interior features: One fireplace; Unfinished basement; Property in very good condition; Fee simple ownership
Neighborhood map
What this means for you Summary
Snapshot
- This is a 3 × 3-bed/?-bath units multifamily listed at $335k. Condition is rated good.
Deal economics
- At list price, monthly cash flow is $816 ($10k/yr) — positive. Per door: $272/mo.
- The deal already cash-flows at list — no discount required.
- Meets the 1% rule at list price ($4k rent vs $335k).
- Recommended offer: $325k (3.0% below list) — sets the bar for market timing.
Location & tenants
- Location reads 62/100 on livability (#1,316 in PA) — a middle-class / working-renter tenant base. Strengths: cost of living A+, housing A+; Watch: amenities F, commute F, health & safety F.
- Juniata Valley SD (rural): math 25% / reading 48% proficiency, ranked #393 of 539 in PA (top 73%) — families likely to look elsewhere, expect single-tenant / working-renter base with shorter leases.
- Zoned schools: Juniata Valley El Sch (math 32% / reading 52%, grade F, #883 of 1,518 statewide, top 61%, 322 students, 59% FRL); Juniata Valley Jshs (math 21% / reading 47%, grade F, #318 of 437 statewide, top 73%, 386 students, 35% FRL).
- Market conditions: 4 active listings in the ZIP; 70 units permitted in Huntingdon County in 2024 (0 in 5+ unit buildings).
Forward outlook
- In year one you build about $15k of equity ($2k loan paydown + $13k appreciation (3.9% local appreciation)).
- Huntingdon County population projected at -14% by 2050 — secular population decline; favor cash flow + early exit over multi-decade hold.
- At projected returns (3.9% appreciation + 3.0% rent growth), your $94k cash investment doubles in ~4 years — after that, you're playing with house money.
- By year 3, paydown + projected appreciation supports a ~$38k cash-out refi (75% LTV) — recoverable capital for the next deal without selling this one.
Negotiation context
- It's been on market 43 days — a 3% lower offer ($325k) is reasonable based on typical stale-listing flexibility.
Risks & watch-outs
- Watch-outs: built in 1600 — expect roof / HVAC / electrical / plumbing capex.
Questions for the listing agent
- It's been on market 43 days. Have you received any prior offers? Is the seller open to a 3% concession, seller financing, or rate buy-down credit?
- Can we see the unit-by-unit rent roll, current vacancy, and any below-market leases? What's the average tenancy length?
- What capital expenditures (roof, boiler, parking lot, exteriors) have been made in the last 5 years, and what's planned in the next 2?
- Built in 1600 — when were the roof, HVAC, electrical panel, plumbing, and water heater last replaced?
- Is there a deadline driving the sale (1031 exchange, divorce, estate, relocation)? That informs how much negotiation room exists.
- What's the average days-on-market for RENTAL listings here right now (not sales)? A rising rental-DOM trend means longer vacancies and softer asking-rent achievability than the comps imply.
- What's the recent tenant-quality profile in this submarket — average credit score on applications, eviction rate, late-payment / NSF rate, and stable-employment percentage? A property-management company in the area should have these aggregated.
- How much new apartment / multifamily construction is in the pipeline within 1–3 miles? Heavy new supply (>2% of stock underway) typically softens rents 12–24 months out; light construction supports rent growth.
Investment metrics
- 1% rule
- 1.18% ✓
- Cap rate
- 9.21%
- Cash-on-cash
- 10.43%
- DSCR
- 1.46
- GRM
- 7.0
CMA / ARV
No comps found within radius.
Projected returns pro-forma
3.91% appreciation · 3.0% rent growth · sell at horizon
- IRR
- 19.4%
- Equity multiple
- 2.16×
- Total profit
- $108,860
- Equity at exit
- $168,178
- IRR
- 20.0%
- Equity multiple
- 4.15×
- Total profit
- $295,248
- Equity at exit
- $273,743
Cash invested: $93,800 (down + closing). Projections, not guarantees.
Landlord ↔ Tenant lean methodology
- Overall (STATE)
- 62 Landlord-Friendly
- State Pennsylvania
- 62 Landlord-Friendly · EVEN
- County
- — inherits STATE
- City
- — inherits STATE
ZIP-level market 16611
- Home prices YoY
- 3.1%
- Active inventory
- 4
- Price-to-rent
- 21.1×
Monthly cashflow live
- Estimated rent
- $3,963 medium interval (Pro) →
- Mortgage (P&I)
- −$1,757
- Tax est. 1.5%
- −$419 /mo · $5,025/yr
- Insurance
- −$140
- HOA
- −$0
- Vacancy / Maint / Mgmt
- −$832
- Net cashflow
- $816
Break-even live
3-unit breakdown (identical units grouped — click to expand)
| Units | Beds | Baths | Est. rent |
|---|---|---|---|
| 3× units | 3 | — | $3,963 |
| #1 | 3 | — | $1,321 |
| #2 | 3 | — | $1,321 |
| #3 | 3 | — | $1,321 |
| Total (3 units) | $3,963 | ||
UW: 25.0% down · 7.5% · 30yr · 1.5% tax · 5.0% vac · 8.0% maint · 8.0% mgmt
Financing live
Cash to close
- Down payment
- $83,750
- Closing costs
- $10,050
- Reserves months
- —
- Total cash needed
- —
Loan-product check · same deal, 3 products live
Conventional
25% down · 7.5% · 30yr
- Down + closing
- —
- Monthly P&I
- —
- Monthly cashflow
- —
- DSCR
- —
- Eligible?
- —
Personal DTI + credit; lowest rate.
DSCR
20% down · 8.5% · 30yr
- Down + closing
- —
- Monthly P&I
- —
- Monthly cashflow
- —
- DSCR
- —
- Eligible?
- —
No personal income docs; deal must DSCR.
Hard money
10% down · 12.0% · 12mo
- Down + closing
- —
- Monthly P&I
- —
- Monthly cashflow
- —
- DSCR
- —
- Eligible?
- —
Short-term bridge; refi at stabilization.
Listing history 19 events
-
2026-06-19days on market $335,000 Active 43 DOM
-
2026-06-18days on market $335,000 Active 42 DOM
-
2026-06-17days on market $335,000 Active 41 DOM
-
2026-06-16days on market $335,000 Active 40 DOM
-
2026-06-15days on market $335,000 Active 39 DOM
-
2026-06-14days on market $335,000 Active 37 DOM
-
2026-06-13days on market $335,000 Active 36 DOM
-
2026-06-10days on market $335,000 Active 34 DOM
-
2026-06-09days on market $335,000 Active 33 DOM
-
2026-06-08days on market $335,000 Active 32 DOM
-
2026-06-07days on market $335,000 Active 31 DOM
-
2026-06-03days on market $335,000 Active 27 DOM
-
2026-06-02days on market $335,000 Active 26 DOM
-
2026-06-01days on market $335,000 Active 25 DOM
-
2026-06-01price $335,000 Active 24 DOM
-
2026-05-31days on market $359,000 Active 24 DOM
-
2026-05-30days on market $359,000 Active 23 DOM
-
2026-05-08$379,000 Active 2380-char remark
-
2026-05-05historical $379,000 2380-char remark
ⓘ Source: listings_history table (triggers on properties + properties_extension) + one-shot
backfill from property_details.listing_events for pre-trigger history.
Nearby sold comps map
Loading sold comps map…
Walkable amenities ~0.75 mi
Loading nearby amenities…
Taxation est. · year 1
- Rental income
- $47,556
- − Mortgage interest
- −$18,765
- − Property taxes
- −$5,025
- − Insurance
- −$1,675
- − Repairs & maintenance
- −$3,804
- − Management
- −$3,804
- − Depreciation
- −$9,745
- Taxable income
- $4,736
- Est. tax owed @ 24.0%
- −$1,137
- After-tax cash flow
- $8,651/yr
For passive investors: Depreciation is non-cash, so a rental often shows a tax loss while cash-flowing — sheltering income. Rental losses are passive: they offset passive income freely, and up to $25,000/yr can offset ordinary (W-2) income if you actively participate and your MAGI is under $100k (phasing out to $0 by $150k); unused losses carry forward. On sale, claimed depreciation is recaptured at up to 25%, and gains may owe capital-gains tax (a 1031 exchange can defer both). Figures are a year-1 estimate at your 24.0% rate — not tax advice; consult a CPA.
Condition & rehab AI · 14 photos
This mid-19th century property is in good condition with minimal repairs needed. It offers excellent potential for both resale and rental value with updates to the exterior and windows.
Value-add opportunities
- Resale Paint the exterior siding — A fresh coat of paint can significantly enhance the curb appeal and value of the property.
- Resale Replace any damaged windows — New windows can improve energy efficiency and increase the property's market value.
Renovation cost estimate screening
Value-add ROI direction
- Resale Paint the exterior siding — A fresh coat of paint can significantly enhance the curb appeal and value of the property. ↑
- Resale Replace any damaged windows — New windows can improve energy efficiency and increase the property's market value. ↑
ⓘ Cost ranges are severity-bucket heuristics (US national rule-of-thumb). Get contractor quotes + a written scope before underwriting a rehab budget.
Schools (NCES district)
- District
- Juniata Valley SD
- NCES district ID
- 4212630
- Math proficiency
- 25% ▼ -11.00%
- Reading proficiency
- 48% ▼ -12.00%
- Median HH income
- $49,467
- Composite
- 31.45/100
- National rank
- #5981
- State rank
- #393 of 539 in PA
Livability — Alexandria
- Score
- 62/100
- State rank
- #1316
- US rank
- #16251
Category grades
Schools grade is shown separately in the Schools card above.
Census & demographics
- Census place
- Alexandria, PA
- Population (ZIP)
- 2,694
Population outlook (Huntingdon County) Hauer SSP2
- Today (2025)
- 44,212 people
- By 2030
- 43,057 · -2.6%
- By 2040
- 40,537 · -8.3%
- By 2050
- 37,844 · -14.4%
- By 2075
- 31,411 · -29.0%
- By 2100
- 23,907 · -45.9%
Race, ethnicity, and origin ACS 2023
- Neighborhood character
- Predominantly White (94%)
- Race & ethnicity
- White 94% Hispanic / Latino 3% Two or more races 3%
- Common ancestry
- Iranian 2% Romanian 2% Serbian 1%
- Foreign-born
- 0%
Political lean MEDSL · Huntingdon
- 2024 margin
- Solid R (+52.9) · D 23.2% · R 76.1%
- 2008→2024 swing
- -25.4pp toward R · 2008: -27.5pp · 2024: -52.9pp
- All cycles
- 2024: R+52.9 2020: R+51.0 2016: R+50.7 2012: R+37.4 2008: R+27.5
Not yet ingested
- Civics
- —
Market trends
- HPI YoY
- ▲ 3.91%
- Current HPI
- 128.6875
- Rent YoY
- —
- Metro
- —
- State GDP YoY
- ▲ 1.68%
- F500 in state
- 34
Industry mix (Fortune 500 HQ in PA)
| Industry | F500 HQs | Revenue |
|---|---|---|
| Healthcare | 2 | $309B |
|
||
| Insurance | 2 | $27B |
|
||
| Telecommunications / Media | 1 | $124B |
|
||
| Industrial Distribution | 1 | $22B |
|
||
| Financial Services | 1 | $20B |
|
||
| Chemicals / Materials | 1 | $18B |
|
||
Price history
-11.6% since first listed4 events — show timeline
- 2026-06-01 Price Changed $335,000 BRIGHT MLS
- 2026-05-20 Price Changed $359,000 BRIGHT MLS
- 2026-05-08 Listed $379,000 BRIGHT MLS
- 2026-05-05 Coming Soon $379,000 BRIGHT MLS
Cash-flow waterfall
monthlySold comps — $/sqft
last 12 mo · ≤1 miLoading sold comps…