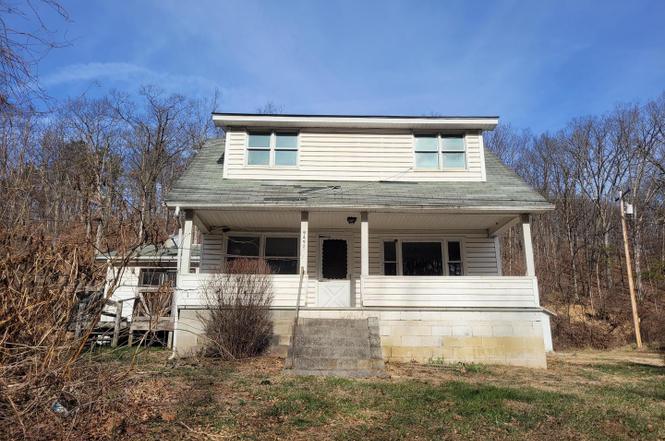
9492 Cumberland Rd · Springfield, WV
Flood risk 9/10 · Severe
- FEMA flood zone
- X (unshaded)
- Chance of flooding over 30 yrs
- 0.99%
- Est. flood insurance / yr
- $473 – $860
Fire risk 3/10 · Minor
- Est. fire insurance / yr
- $787 – $1,461
Heat risk 4/10 · Minor
- Hot days now (above 101°F)
- 7 days/yr
- Hot days in 30 yrs
- 17 days/yr
Wind risk 2/10 · Minimal
- Chance of severe wind over 30 yrs
- —
Air-quality risk 2/10 · Minimal
- Unhealthy air days now
- 0 days/yr
- Unhealthy air days in 30 yrs
- 1 days/yr
Risk factors via First Street. Map © Google.
Why this score? — see what drove the A- grade
The composite is a weighted blend of 9 inputs, each scored 0–100. Each bar is that input's sub-score; the figure is the points it added to the 100-point composite (weight × sub-score).
- Cash flow +30.0/30.0
- ARV discount +15.0/15.0
- 1% rule +10.0/10.0
- DSCR +10.0/10.0
- Appreciation +4.6/10.0
- Livability +2.9/5.0
- Schools +2.6/10.0
- Rent growth +2.5/5.0
- Condition / age +2.5/5.0
$70,000
🖨 Deal sheet 📄 Offer letter ✓ Due diligence
Listing remarks
Discover the charm of this classic 1940 Colonial home, nestled on a generous 2-acre lot, offering a perfect blend of space and potential. With 1,811 sq. ft. of living area, this detached residence features three spacious bedrooms and one and a half bathrooms, providing ample room for relaxation and everyday living. The unfinished basement presents an exciting opportunity for customization or additional storage space. The property boasts a detached garage with front entry, ensuring convenient parking and extra storage for your outdoor gear or hobbies. Set in a tranquil setting, this home offers a peaceful retreat while still being close to local amenities. The expansive lot provides endless
Key facts
- Expansive lot
- Unfinished basement
- Colonial home
Tags
Property features AI
Finance
- Financial info: Ownership: Fee simple; Lease considered: No
Exterior
- Parking: Detached front-entry garage (1 car); Driveway parking
- Utilities: Public water; On-site septic; Electric service
- Home design: Detached structure; Building winterized; Above-grade finished area reported by assessor
- Construction: Permanent foundation; Other structures above and below grade
- Exterior features: Property located outside city limits; Directions: From Romney take WV-28 N for approximately 10 miles; property on the right
Interior
- Bedrooms: Three bedrooms on the main level
- Bathrooms: One full bathroom; One half bathroom
- Heating & cooling: Hot water and baseboard heating; Heating fuel: Oil; Electric hot water; Central air conditioning (electric)
- Interior features: Unfinished basement; Living area reported by assessor
Neighborhood map
What this means for you Summary
Snapshot
- This is a 3-bed/1.5-bath single-family listed at $70k.
Deal economics
- At list price, monthly cash flow is $616 ($7k/yr) — positive.
- The deal already cash-flows at list — no discount required.
- Meets the 1% rule at list price ($1k rent vs $70k).
- Recommended offer: $62k (12.0% below list) — sets the bar for market timing.
Location & tenants
- Location reads 58/100 on livability (#246 in WV) — a working-class tenant base; expect higher turnover. Strengths: cost of living A+; Watch: schools D+, amenities F, commute F.
- Hampshire County Schools (rural): math 25% / reading 38% proficiency, ranked #30 of 55 in WV (top 54%) — families likely to look elsewhere, expect single-tenant / working-renter base with shorter leases.
- Market conditions: 13 active listings in the ZIP; 124 units permitted in Hampshire County in 2024 (0 in 5+ unit buildings).
Forward outlook
- Local home prices are declining (-0.7%/yr); year-one equity from $484 of loan paydown is wiped out by about $518 of value loss. Plan a longer hold.
- Hampshire County population projected at -29% by 2050 — secular population decline; favor cash flow + early exit over multi-decade hold.
- At projected returns (-0.7% appreciation + 3.0% rent growth), your $20k cash investment doubles in ~3 years — after that, you're playing with house money.
Negotiation context
- It's been on market 161 days — a 12% lower offer ($62k) is reasonable based on typical stale-listing flexibility.
Risks & watch-outs
- Watch-outs: flood insurance adds $56/mo; built in 1940 — expect roof / HVAC / electrical / plumbing capex.
- Climate carrying-cost: severe flood risk — expect insurance premiums to compound above CPI over the hold.
Questions for the listing agent
- It's been on market 161 days. Have you received any prior offers? Is the seller open to a 12% concession, seller financing, or rate buy-down credit?
- Built in 1940 — when were the roof, HVAC, electrical panel, plumbing, and water heater last replaced?
- What's the actual annual flood-insurance premium (NFIP or private), and is the property in a SFHA with mandatory coverage?
- Why hasn't it sold? Are there any deal-killer items the seller is aware of (foundation, flood, title, zoning, code violations)?
- Is there a deadline driving the sale (1031 exchange, divorce, estate, relocation)? That informs how much negotiation room exists.
- Schools are D-rated, which usually means shorter tenancies and higher turnover. Who's the typical renter profile here, and what's been the actual vacancy rate?
- What's the average days-on-market for RENTAL listings here right now (not sales)? A rising rental-DOM trend means longer vacancies and softer asking-rent achievability than the comps imply.
- What's the recent tenant-quality profile in this submarket — average credit score on applications, eviction rate, late-payment / NSF rate, and stable-employment percentage? A property-management company in the area should have these aggregated.
- How much new for-sale + rental construction is in the pipeline within 1–3 miles? Heavy new supply typically softens prices + rents 12–24 months out; constrained supply supports both.
Investment metrics
- 1% rule
- 2.01% ✓
- Cap rate
- 17.80%
- Cash-on-cash
- 41.09%
- DSCR
- 2.83
- GRM
- 4.1
CMA / ARV
- ARV (on-the-fly)
- $90,550
- Comps found
- 1
Show comp detail 1 sale within ~0.75 mi
| Address | Dist | Beds/Ba | Sqft | Sold | Price | $/sf | Match |
|---|---|---|---|---|---|---|---|
| 9710 Cumberland Rd | 0.21mi | 3/1.0 | 1,692 (-7%) | 7mo | $84,100 | $50 | 71 |
Match score weights: distance 35% · size 25% · config 20% · recency 20%. Top-matched comps best support the ARV.
Projected returns pro-forma
-0.74% appreciation · 3.0% rent growth · sell at horizon
- IRR
- 37.4%
- Equity multiple
- 2.77×
- Total profit
- $34,788
- Equity at exit
- $17,775
- IRR
- 41.5%
- Equity multiple
- 5.46×
- Total profit
- $87,457
- Equity at exit
- $19,423
Cash invested: $19,600 (down + closing). Projections, not guarantees.
Landlord ↔ Tenant lean methodology
- Overall (STATE)
- 83 Strongly Landlord-Friendly
- State West Virginia
- 83 Strongly Landlord-Friendly · R+22
- County
- — inherits STATE
- City
- — inherits STATE
ZIP-level market 26763
- Home prices YoY
- -0.2%
- Active inventory
- 13
- Price-to-rent
- 4.1×
Monthly cashflow live
- Estimated rent
- $1,408 medium interval (Pro) →
- Mortgage (P&I)
- −$367
- Tax from tax record
- −$45 /mo · $544/yr
- Insurance
- −$29
- Flood insurance flood zone
- −$56 /mo · $666/yr
- HOA
- −$0
- Vacancy / Maint / Mgmt
- −$296
- Net cashflow
- $616
Break-even live
UW: 25.0% down · 7.5% · 30yr · 1.5% tax · 5.0% vac · 8.0% maint · 8.0% mgmt
Financing live
Cash to close
- Down payment
- $17,500
- Closing costs
- $2,100
- Reserves months
- —
- Total cash needed
- —
Loan-product check · same deal, 3 products live
Conventional
25% down · 7.5% · 30yr
- Down + closing
- —
- Monthly P&I
- —
- Monthly cashflow
- —
- DSCR
- —
- Eligible?
- —
Personal DTI + credit; lowest rate.
DSCR
20% down · 8.5% · 30yr
- Down + closing
- —
- Monthly P&I
- —
- Monthly cashflow
- —
- DSCR
- —
- Eligible?
- —
No personal income docs; deal must DSCR.
Hard money
10% down · 12.0% · 12mo
- Down + closing
- —
- Monthly P&I
- —
- Monthly cashflow
- —
- DSCR
- —
- Eligible?
- —
Short-term bridge; refi at stabilization.
Listing history 22 events
-
2026-06-19days on market $70,000 Active 161 DOM
-
2026-06-18days on market $70,000 Active 160 DOM
-
2026-06-17days on market $70,000 Active 159 DOM
-
2026-06-16days on market $70,000 Active 158 DOM
-
2026-06-15days on market $70,000 Active 157 DOM
-
2026-06-14days on market $70,000 Active 155 DOM
-
2026-06-12pricedays on market $70,000 Active 154 DOM
-
2026-06-09days on market $75,000 Active 151 DOM
-
2026-06-08days on market $75,000 Active 150 DOM
-
2026-06-07days on market $75,000 Active 149 DOM
-
2026-06-05days on market $75,000 Active 146 DOM
-
2026-06-03days on market $75,000 Active 145 DOM
-
2026-06-02days on market $75,000 Active 144 DOM
-
2026-06-01days on market $75,000 Active 143 DOM
-
2026-05-31days on market $75,000 Active 142 DOM
-
2026-05-30days on market $75,000 Active 141 DOM
-
2026-05-11price $75,000
-
2026-04-03price $80,000
-
2026-02-19price $85,000
-
2026-01-09$90,000 Active
-
2007-01-22soldstatus $121,645
-
2007-01-22soldstatus $120,000
ⓘ Source: listings_history table (triggers on properties + properties_extension) + one-shot
backfill from property_details.listing_events for pre-trigger history.
Tax reassessment forecast WV · Resets to sale price
- Current annual tax
- $544 · $45/mo
- Projected year-2 tax
- $544 · $45/mo
- Expected delta
- $0/yr ($0/mo · 0.0%)
ⓘ Screening estimate from a state-policy table — verify with the county assessor before closing.
Climate risk First Street
- Flood 9/10 Extreme FEMA zone X (unshaded) · 99% chance over 30 yrs
- Wildfire 3/10 Moderate
- Heat 4/10 Moderate 7 d/yr ≥101°F today · 17 d/yr by 30 yrs out
- Wind 2/10 Low
- Air quality 2/10 Low 0 unhealthy d/yr today · 1 by 30 yrs out
Nearby sold comps map
Loading sold comps map…
Walkable amenities ~0.75 mi
Loading nearby amenities…
Taxation est. · year 1
- Rental income
- $16,901
- − Mortgage interest
- −$3,921
- − Property taxes
- −$544
- − Insurance
- −$1,016
- − Repairs & maintenance
- −$1,352
- − Management
- −$1,352
- − Depreciation
- −$2,036
- Taxable income
- $6,679
- Est. tax owed @ 24.0%
- −$1,603
- After-tax cash flow
- $5,784/yr
For passive investors: Depreciation is non-cash, so a rental often shows a tax loss while cash-flowing — sheltering income. Rental losses are passive: they offset passive income freely, and up to $25,000/yr can offset ordinary (W-2) income if you actively participate and your MAGI is under $100k (phasing out to $0 by $150k); unused losses carry forward. On sale, claimed depreciation is recaptured at up to 25%, and gains may owe capital-gains tax (a 1031 exchange can defer both). Figures are a year-1 estimate at your 24.0% rate — not tax advice; consult a CPA.
Schools (NCES district)
- District
- Hampshire County Schools
- NCES district ID
- 5400420
- Math proficiency
- 25% ▼ -16.00%
- Reading proficiency
- 38% ▼ -8.00%
- Median HH income
- $32,170
- Composite
- 25.69/100
- National rank
- #7392
- State rank
- #30 of 55 in WV
Livability — Springfield
- Score
- 58/100
- State rank
- #246
- US rank
- #21149
Category grades
Schools grade is shown separately in the Schools card above.
Census & demographics
- Population (ZIP)
- 1,564
Population outlook (Hampshire County) Hauer SSP2
- Today (2025)
- 21,820 people
- By 2030
- 20,690 · -5.2%
- By 2040
- 18,089 · -17.1%
- By 2050
- 15,413 · -29.4%
- By 2075
- 10,421 · -52.2%
- By 2100
- 6,842 · -68.6%
Race, ethnicity, and origin ACS 2023
- Neighborhood character
- Predominantly White (89%)
- Race & ethnicity
- White 89% Two or more races 11%
- Common ancestry
- Italian 4% Slovak 4% Iranian 2%
Political lean MEDSL · Hampshire
- 2024 margin
- Solid R (+62.6) · D 18.0% · R 80.6% · Other 1.4%
- 2008→2024 swing
- -35.8pp toward R · 2008: -26.8pp · 2024: -62.6pp
- All cycles
- 2024: R+62.6 2020: R+60.4 2016: R+59.2 2012: R+40.4 2008: R+26.8
Not yet ingested
- Civics
- —
Market trends
- HPI YoY
- ▼ -0.74%
- Current HPI
- 377.2454
- Rent YoY
- —
- Metro
- —
- State GDP YoY
- —
- F500 in state
- 0
Price history
-38.3% since first listed6 events — show timeline
- 2026-05-11 Price Changed $75,000 BRIGHT MLS
- 2026-04-03 Price Changed $80,000 BRIGHT MLS
- 2026-02-19 Price Changed $85,000 BRIGHT MLS
- 2026-01-09 Listed $90,000 BRIGHT MLS
- 2007-01-22 Sold (Public Records) $120,000 Public Records
- 2007-01-22 Sold (Public Records) $121,645 Public Records
Property tax history
+1.6%/yrLatest (2025): $544 · +6.6% YoY. Source: county tax records.
Cash-flow waterfall
monthlySold comps — $/sqft
last 12 mo · ≤1 miLoading sold comps…