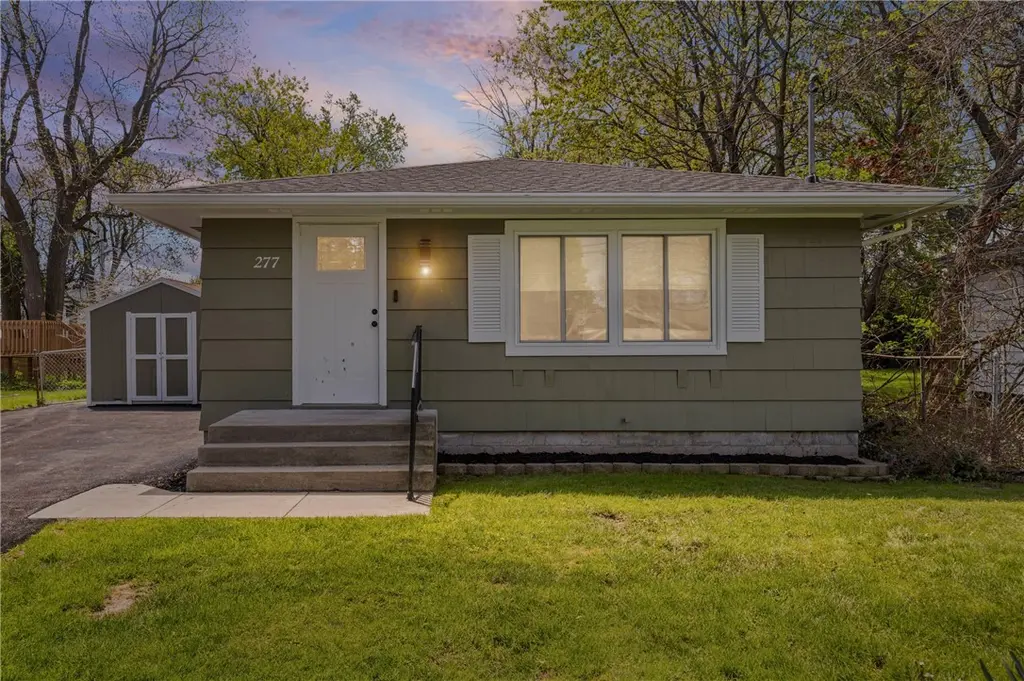
277 Wolcott Ave · North Gates, NY
Flood risk 1/10 · Minimal
- FEMA flood zone
- X (unshaded)
- Chance of flooding over 30 yrs
- 0.0%
- Est. flood insurance / yr
- $473 – $860
Fire risk 1/10 · Minimal
- Est. fire insurance / yr
- $691 – $1,283
Heat risk 2/10 · Minimal
- Hot days now (above 95°F)
- 7 days/yr
- Hot days in 30 yrs
- 15 days/yr
Wind risk 1/10 · Minimal
- Chance of severe wind over 30 yrs
- —
Air-quality risk 2/10 · Minimal
- Unhealthy air days now
- 1 days/yr
- Unhealthy air days in 30 yrs
- 2 days/yr
Risk factors via First Street. Map © Google.
Why this score? — see what drove the D grade
The composite is a weighted blend of 9 inputs, each scored 0–100. Each bar is that input's sub-score; the figure is the points it added to the 100-point composite (weight × sub-score).
- ARV discount +15.0/15.0
- Cash flow +7.7/30.0
- Rent growth +4.1/5.0
- 1% rule +3.8/10.0
- Livability +3.8/5.0
- Schools +3.6/10.0
- Condition / age +2.5/5.0
- DSCR +1.8/10.0
- Appreciation +0.0/10.0
$184,900
🖨 Deal sheet 📄 Offer letter ✓ Due diligence
Listing remarks
Stop scrolling, this is the one! This fully updated 3 bed, 1.5 bath modern ranch checks every box and then some! From the moment you walk in, the bright open-concept layout draws you straight through a stunning eat-in kitchen featuring white shaker cabinets with tons of storage, granite countertops, a breakfast bar, tiled backsplash, and a full suite of stainless steel appliances. Luxury vinyl plank flooring, recessed lighting, and modern fixtures run throughout the entire first floor, tying it all together with a clean, contemporary feel. Three generously sized bedrooms and a beautifully updated primary bath with dual vanity and tiled shower round out the main level, all freshly painted an
Key facts
- Tiled backsplash
- Eat-in kitchen
- Granite countertops
Tags
Property features AI
Exterior
- Parking: Driveway parking; No garage
- Utilities: High-speed internet available; Public water connected; Sewer connected; Circuit breaker electrical service
- Home design: Single-story home; Existing (previously built) structure
- Construction: Wood siding; Architectural shingle roof; Block foundation; Copper and PEX plumbing
- Exterior features: Blacktop driveway; Partial fencing; Yard with shed/storage; Near public transit; Rectangular residential lot with city street frontage
Interior
- Kitchen: Dishwasher; Garbage disposal; Gas oven and gas range; Microwave; Refrigerator; Granite counters; Breakfast bar; Eat-in kitchen
- Bedrooms: Three main-level bedrooms
- Flooring: Luxury vinyl; Tile; Varied flooring
- Bathrooms: One full bathroom; One half bathroom; One main-level bathroom
- Heating & cooling: Gas forced-air heating; Central air conditioning
- Interior features: Breakfast bar; Eat-in kitchen; Separate/formal living room; Granite counters; Combined living and dining area; Storage space; Convertible bedroom; Main level primary suite; Bedroom on main level; Has basement (full) with sump pump
- Laundry & utility: Laundry in basement; Gas water heater
Neighborhood map
What this means for you Summary
Snapshot
- This is a 3-bed/1.0-bath single-family listed at $185k.
Deal economics
- At list price, monthly cash flow is $-215 ($-3k/yr) — negative.
- To cash-flow at today's rent, offer at most $147k (20.5% below list).
- To meet the 1% rule (rent ≥ 1% of price), the offer needs to be $163k (11.6% below list).
- Recommended offer: $147k (20.5% below list) — sets the bar for cash-flow.
Location & tenants
- Location reads 75/100 on livability (#245 in NY, #3,859 nationally) — a middle-class / working-renter tenant base. Strengths: housing A+, health & safety A+, cost of living A-; Watch: crime D, schools F, amenities F.
- Gates-Chili Central School District (suburban): math 41% / reading 42% proficiency, ranked #491 of 590 in NY (top 83%) — families likely to look elsewhere, expect single-tenant / working-renter base with shorter leases.
- Market conditions: Rents rising fast (+6.3%/yr); 124 active listings in the ZIP; 3 comparable units currently listed for rent nearby; rentals leasing fast (median 3d on market — plan ~1-2 weeks tenant-placement turnaround); 1,169 units permitted in Monroe County in 2024 (591 in 5+ unit buildings).
- This rent runs 35% of the median local income ($56k/yr) — at the standard rent-burdened threshold; future hikes will face affordability resistance.
Forward outlook
- Local home prices are declining (-3.0%/yr); year-one equity from $1k of loan paydown is wiped out by about $6k of value loss. Plan a longer hold.
- Monroe County population projected to shrink 6% by 2050 — rents likely to lag national; underwrite the cash flow, not the appreciation.
Negotiation context
- Only 8 days on market — expect competitive offers; lowballing is unlikely to land.
- Current owner paid $60k; list at $185k implies a 208% gain — meaningful room to come down on a strong offer.
Risks & watch-outs
- Watch-outs: property tax is 3.0% of price.
Questions for the listing agent
- What do current leases actually rent for vs. the listed asking? Can we see a recent rent roll and the last 12 months of T-12 income?
- Built in 1961 — when were the roof, HVAC, electrical panel, plumbing, and water heater last replaced?
- Property tax is high relative to price — has the assessment been appealed recently, and will the sale trigger a re-assessment?
- Is there a deadline driving the sale (1031 exchange, divorce, estate, relocation)? That informs how much negotiation room exists.
- Schools are F-rated, which usually means shorter tenancies and higher turnover. Who's the typical renter profile here, and what's been the actual vacancy rate?
- Crime grade is D in this area — have there been break-ins, vandalism, or insurance claims at this property in the last 3 years? What carrier currently insures it and at what premium?
- The area grade is low — what's the realistic commute time and amenity access for the typical tenant pool here? Any planned neighborhood developments (good or bad) we should know about?
- What's the average days-on-market for RENTAL listings here right now (not sales)? A rising rental-DOM trend means longer vacancies and softer asking-rent achievability than the comps imply.
- What's the recent tenant-quality profile in this submarket — average credit score on applications, eviction rate, late-payment / NSF rate, and stable-employment percentage? A property-management company in the area should have these aggregated.
- How much new for-sale + rental construction is in the pipeline within 1–3 miles? Heavy new supply typically softens prices + rents 12–24 months out; constrained supply supports both.
Investment metrics
- 1% rule
- 0.88% ✗
- Cap rate
- 4.90%
- Cash-on-cash
- -4.98%
- DSCR
- 0.78
- GRM
- 9.4
CMA / ARV
- ARV (median comp)
- $227,447
- List price
- $184,900
- Delta
- -18.71%
- Verdict
- UNDERPRICED
- Comps
- 20 within 1.0 mi
Show comp detail 12 sales within ~0.75 mi
| Address | Dist | Beds/Ba | Sqft | Sold | Price | $/sf | Match |
|---|---|---|---|---|---|---|---|
| 301 Downsview Dr | 0.26mi | 3/1.5 | 1,040 (-2%) | 1mo | $222,000 | $213 | 82 |
| 69 Youngs Ave | 0.32mi | 3/1.0 | 1,036 (-2%) | 2mo | $110,000 | $106 | 80 |
| 23 Bobbie Dr | 0.31mi | 3/1.0 | 1,092 (+3%) | 3mo | $220,000 | $201 | 78 |
| 22 Morningstar Dr | 0.32mi | 3/1.0 | 1,092 (+3%) | 4mo | $235,000 | $215 | 76 |
| 4 Bobbie Dr | 0.16mi | 3/1.0 | 1,118 (+6%) | 8mo | $215,000 | $192 | 76 |
| 24 Bobbie Dr | 0.31mi | 3/2.0 | 1,092 (+3%) | 2mo | $245,000 | $224 | 74 |
| 134 Norwood Ave | 0.37mi | 2/1.0 (-1) | 1,060 (+0%) | 4mo | $67,500 | $64 | 74 |
| 84 Kentucky Ave | 0.50mi | 3/2.0 | 1,078 (+2%) | 4mo | $218,000 | $202 | 66 |
| 9 E Crest Dr | 0.43mi | 3/1.0 | 1,144 (+8%) | 2mo | $254,000 | $222 | 65 |
| 2986 Lyell Rd | 0.52mi | 2/2.0 (-1) | 1,044 (-1%) | 8mo | $215,000 | $206 | 58 |
| 37 Abbottsford Dr | 0.64mi | 3/1.0 | 1,122 (+6%) | 3mo | $271,000 | $242 | 57 |
| 160 Jordan Ave | 0.73mi | 4/1.0 (+1) | 1,048 (-1%) | 5mo | $89,900 | $86 | 56 |
Match score weights: distance 35% · size 25% · config 20% · recency 20%. Top-matched comps best support the ARV.
Projected returns pro-forma
-3.0% appreciation · 6.28% rent growth · sell at horizon
- IRR
- -20.3%
- Equity multiple
- 0.27×
- Total profit
- $-37,896
- Equity at exit
- $27,569
- IRR
- -6.6%
- Equity multiple
- 0.51×
- Total profit
- $-25,475
- Equity at exit
- $15,987
Cash invested: $51,772 (down + closing). Projections, not guarantees.
Landlord ↔ Tenant lean methodology
- Overall (STATE)
- 15 Strongly Tenant-Friendly
- State New York
- 15 Strongly Tenant-Friendly · D+10
- County
- — inherits STATE
- City
- — inherits STATE
ZIP-level market 14606
- Home prices YoY
- -17.9%
- Rents YoY
- 6.3%
- Active inventory
- 124
- Price-to-rent
- 9.4×
Monthly cashflow live
- Estimated rent
- $1,635 medium interval (Pro) →
- Mortgage (P&I)
- −$970
- Tax from tax record
- −$459 /mo · $5,511/yr
- Insurance
- −$77
- HOA
- −$0
- Vacancy / Maint / Mgmt
- −$343
- Net cashflow
- $-215
Break-even live
UW: 25.0% down · 7.5% · 30yr · 1.5% tax · 5.0% vac · 8.0% maint · 8.0% mgmt
Financing live
Cash to close
- Down payment
- $46,225
- Closing costs
- $5,547
- Reserves months
- —
- Total cash needed
- —
Loan-product check · same deal, 3 products live
Conventional
25% down · 7.5% · 30yr
- Down + closing
- —
- Monthly P&I
- —
- Monthly cashflow
- —
- DSCR
- —
- Eligible?
- —
Personal DTI + credit; lowest rate.
DSCR
20% down · 8.5% · 30yr
- Down + closing
- —
- Monthly P&I
- —
- Monthly cashflow
- —
- DSCR
- —
- Eligible?
- —
No personal income docs; deal must DSCR.
Hard money
10% down · 12.0% · 12mo
- Down + closing
- —
- Monthly P&I
- —
- Monthly cashflow
- —
- DSCR
- —
- Eligible?
- —
Short-term bridge; refi at stabilization.
Rent comps 3 comps
| Address | Beds | Baths | Sqft | Rent | $/sqft | DOM | Units | Dist |
|---|---|---|---|---|---|---|---|---|
| 3546 Lyell Rd Rochester, NY | 2.0 | 1.0 | 730 | $1,395 | $1.91 | 21d | 1 | 0.79mi |
| 40 Hazelhurst Dr Gates, NY | 2.0 | 1.0 | 635 | $1,440 | $2.27 | 2d | 20 | 0.96mi |
| 155 Canal Landing Blvd Rochester, NY | 1.0–3.0 | 1.5–2.0 | 1174 | $2,050 | $1.75 | 2d | 5 | 1.18mi |
Listing history 3 events
-
2026-05-13$184,900 Active 1575-char remark
-
2022-10-14soldstatus $60,000
-
2003-05-15soldstatus $66,000
ⓘ Source: listings_history table (triggers on properties + properties_extension) + one-shot
backfill from property_details.listing_events for pre-trigger history.
Tax reassessment forecast NY · Partial reset (capped growth)
- Current annual tax
- $5,511 · $459/mo
- Projected year-2 tax
- $5,511 · $459/mo
- Expected delta
- $0/yr ($0/mo · 0.0%)
ⓘ Screening estimate from a state-policy table — verify with the county assessor before closing.
Climate risk First Street
- Flood 1/10 Low FEMA zone X (unshaded) · 0% chance over 30 yrs
- Wildfire 1/10 Low
- Heat 2/10 Low 7 d/yr ≥95°F today · 15 d/yr by 30 yrs out
- Wind 1/10 Low
- Air quality 2/10 Low 1 unhealthy d/yr today · 2 by 30 yrs out
Nearby sold comps map
Loading sold comps map…
Walkable amenities ~0.75 mi
Loading nearby amenities…
Taxation est. · year 1
- Rental income
- $19,614
- − Mortgage interest
- −$10,357
- − Property taxes
- −$5,511
- − Insurance
- −$924
- − Repairs & maintenance
- −$1,569
- − Management
- −$1,569
- − Depreciation
- −$5,379
- Taxable loss
- −$5,696
- Est. tax savings @ 24.0%
- +$1,367
- After-tax cash flow
- $-1,209/yr
For passive investors: Depreciation is non-cash, so a rental often shows a tax loss while cash-flowing — sheltering income. Rental losses are passive: they offset passive income freely, and up to $25,000/yr can offset ordinary (W-2) income if you actively participate and your MAGI is under $100k (phasing out to $0 by $150k); unused losses carry forward. On sale, claimed depreciation is recaptured at up to 25%, and gains may owe capital-gains tax (a 1031 exchange can defer both). Figures are a year-1 estimate at your 24.0% rate — not tax advice; consult a CPA.
Schools (NCES district)
- District
- Gates-Chili Central School District
- NCES district ID
- 3611880
- Math proficiency
- 41% ▼ -12.00%
- Reading proficiency
- 42% ▼ -6.00%
- Median HH income
- $55,045
- Composite
- 36.23/100
- National rank
- #4719
- State rank
- #491 of 590 in NY
Livability — North Gates
- Score
- 75/100
- State rank
- #245
- US rank
- #3859
Category grades
Schools grade is shown separately in the Schools card above.
Census & demographics
- Census place
- North Gates, NY
- County
- Monroe County · 674,131 people
- City population
- 27,478
- Metro
- Rochester, NY
- Population (ZIP)
- 25,538
- Household income
- $55,807
- Rent vs Own
- Severe rent burden
- 986.0
Population outlook (Monroe County) Hauer SSP2
- Today (2025)
- 759,460 people
- By 2030
- 757,154 · -0.3%
- By 2040
- 740,644 · -2.5%
- By 2050
- 714,443 · -5.9%
- By 2075
- 645,883 · -15.0%
- By 2100
- 547,084 · -28.0%
Race, ethnicity, and origin ACS 2023
- Neighborhood character
- Diverse neighborhood (Simpson 0.64)
- Race & ethnicity
- White 51% Black 26% Hispanic / Latino 17% Two or more races 8% Asian 3%
- Hispanic origin (detail)
- Puerto Rican 12% Cuban 2%
- Common ancestry
- Romanian 3% Lithuanian 1% Iranian 1%
- Foreign-born
- 10% · Canada, Vietnam, Philippines
- Languages at home
- 79% English-only · Spanish 12% Other Indo-European 3% Other Asian/Pacific 2%
Political lean MEDSL · Monroe
- 2024 margin
- D (+19.1) · D 59.5% · R 40.5%
- 2008→2024 swing
- +1.4pp toward D · 2008: 17.7pp · 2024: 19.1pp
- All cycles
- 2024: D+19.1 2020: D+21.0 2016: D+14.1 2012: D+17.4 2008: D+17.7
Not yet ingested
- Civics
- —
Market trends
- HPI YoY
- ▼ -62.59%
- Current HPI
- 287.6868
- Rent YoY
- ▲ 6.28%
- Metro
- Rochester, NY
- State GDP YoY
- ▲ 2.60%
- F500 in state
- 92
Industry mix (Fortune 500 HQ in NY)
| Industry | F500 HQs | Revenue |
|---|---|---|
| Financial Services | 10 | $950B |
|
||
| Consumer Goods | 9 | $162B |
|
||
| Insurance | 4 | $225B |
|
||
| Telecommunications | 2 | $144B |
|
||
| Pharmaceuticals | 2 | $112B |
|
||
| Media / Entertainment | 2 | $69B |
|
||
Price history
+180.2% since first listed4 events — show timeline
- 2026-05-21 Pending — UNYREIS
- 2026-05-13 Listed $184,900 UNYREIS
- 2022-10-14 Sold (Public Records) $60,000 Public Records
- 2003-05-15 Sold (Public Records) $66,000 Public Records
Property tax history
+5.5%/yrLatest (2025): $5,511 · +16.0% YoY. Source: county tax records.
Cash-flow waterfall
monthlySold comps — $/sqft
last 12 mo · ≤1 miLoading sold comps…