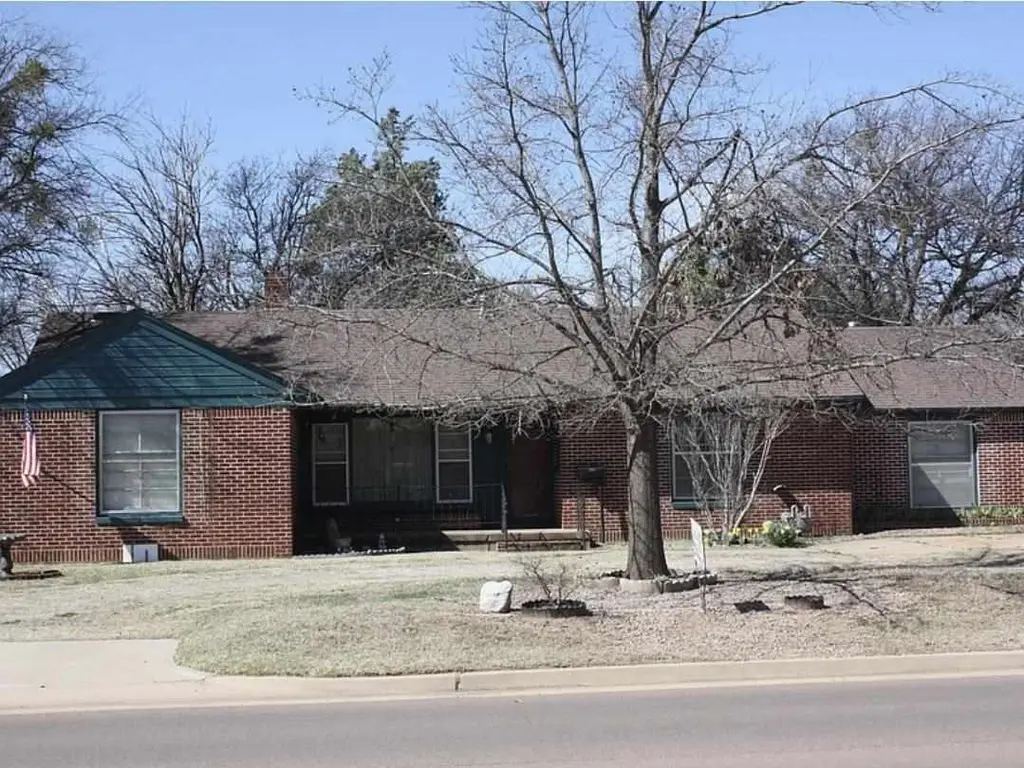
707 N 15th St · Frederick, OK
Flood risk 1/10 · Minimal
- FEMA flood zone
- —
- Chance of flooding over 30 yrs
- 0.0%
- Est. flood insurance / yr
- —
Fire risk 3/10 · Minor
- Est. fire insurance / yr
- $2,463 – $4,575
Heat risk 7/10 · Major
- Hot days now (above 109°F)
- 7 days/yr
- Hot days in 30 yrs
- 20 days/yr
Wind risk 3/10 · Minor
- Chance of severe wind over 30 yrs
- 5.0%
Air-quality risk 1/10 · Minimal
- Unhealthy air days now
- 0 days/yr
- Unhealthy air days in 30 yrs
- 0 days/yr
Risk factors via First Street. Map © Google.
Why this score? — see what drove the B+ grade
The composite is a weighted blend of 9 inputs, each scored 0–100. Each bar is that input's sub-score; the figure is the points it added to the 100-point composite (weight × sub-score).
- Cash flow +30.0/30.0
- ARV discount +15.0/15.0
- DSCR +10.0/10.0
- 1% rule +8.8/10.0
- Appreciation +3.3/10.0
- Livability +3.1/5.0
- Schools +2.9/10.0
- Rent growth +2.5/5.0
- Condition / age +2.5/5.0
$89,900
🖨 Deal sheet 📄 Offer letter ✓ Due diligence
Listing remarks MLS
Original hardwood floors, large open kitchen & dining, secluded master make this home special. Home has lots of storage. Two-car garage, fenced backyard, single carport and storm cellar under covered patio. This home is very spacious and close to schools.
Key facts
- Covered patio
- Storm shelter
- Cozy fireplace
Tags
Property features AI
Exterior
- Parking: 3 total parking spaces; 1-car garage with rear-facing garage door and opener; 2-car carport (covered)
- Security: Smoke detectors
- Utilities: Public water; Public sewer; Natural gas available
- Home design: Single family residence; One level; Updated/remodeled
- Construction: Stucco construction; Composition roof
- Exterior features: Covered porch; Chain-link fence; Shed
Interior
- Kitchen: Double oven; Dishwasher; Disposal; Range hood
- Flooring: Ceramic tile; Carpet; Hardwood
- Bathrooms: 2 full bathrooms
- Heating & cooling: Central heating; Fireplace heating; Central air; Electric cooling; Attic fan; Ceiling fans
- Interior features: Double pane windows; Wood-burning fireplace; Crawl space
- Laundry & utility: Washer; Dryer; Gas water heater
Neighborhood map
What this means for you Summary
Snapshot
- This is a 3-bed/2.0-bath single-family listed at $90k.
Deal economics
- At list price, monthly cash flow is $429 ($5k/yr) — positive.
- The deal already cash-flows at list — no discount required.
- Meets the 1% rule at list price ($1k rent vs $90k).
- Recommended offer: $87k (3.0% below list) — sets the bar for market timing.
Location & tenants
- Location reads 61/100 on livability (#304 in OK) — a middle-class / working-renter tenant base. Strengths: cost of living A+, housing A+; Watch: crime D, schools D-, amenities F.
- Frederick (town): math 41% / reading 28% proficiency, ranked #46 of 270 in OK (top 17%) — families likely to look elsewhere, expect single-tenant / working-renter base with shorter leases; 68% free/reduced lunch — lower-income household profile, screen leases tightly.
- Market conditions: 31 active listings in the ZIP.
Forward outlook
- Local home prices are declining (-3.0%/yr); year-one equity from $622 of loan paydown is wiped out by about $3k of value loss. Plan a longer hold.
- Tillman County population projected to shrink 8% by 2050 — rents likely to lag national; underwrite the cash flow, not the appreciation.
- At projected returns (-3.0% appreciation + 3.0% rent growth), your $25k cash investment doubles in ~6 years — after that, you're playing with house money.
Negotiation context
- It's been on market 34 days — a 3% lower offer ($87k) is reasonable based on typical stale-listing flexibility.
- 2 sale attempts since 7y ago with the ask held roughly flat each time — persistent listings suggest the price (not the market) is what's stuck; bring a comps-based counter.
- Current owner paid $57k; list at $90k implies a 58% gain — meaningful room to come down on a strong offer.
Risks & watch-outs
- Watch-outs: built in 1950 — expect roof / HVAC / electrical / plumbing capex.
- Climate carrying-cost: extreme-heat days projected 7→20/yr by 2055 (HVAC capex compounding) — expect insurance premiums to compound above CPI over the hold.
Questions for the listing agent
- It's been on market 34 days. Have you received any prior offers? Is the seller open to a 3% concession, seller financing, or rate buy-down credit?
- Built in 1950 — when were the roof, HVAC, electrical panel, plumbing, and water heater last replaced?
- Is there a deadline driving the sale (1031 exchange, divorce, estate, relocation)? That informs how much negotiation room exists.
- Schools are D-rated, which usually means shorter tenancies and higher turnover. Who's the typical renter profile here, and what's been the actual vacancy rate?
- Crime grade is D in this area — have there been break-ins, vandalism, or insurance claims at this property in the last 3 years? What carrier currently insures it and at what premium?
- What's the average days-on-market for RENTAL listings here right now (not sales)? A rising rental-DOM trend means longer vacancies and softer asking-rent achievability than the comps imply.
- What's the recent tenant-quality profile in this submarket — average credit score on applications, eviction rate, late-payment / NSF rate, and stable-employment percentage? A property-management company in the area should have these aggregated.
- How much new for-sale + rental construction is in the pipeline within 1–3 miles? Heavy new supply typically softens prices + rents 12–24 months out; constrained supply supports both.
Investment metrics
- 1% rule
- 1.38% ✓
- Cap rate
- 12.02%
- Cash-on-cash
- 20.45%
- DSCR
- 1.91
- GRM
- 6.0
CMA / ARV
- ARV (on-the-fly)
- $140,304
- Comps found
- 12
Show comp detail 12 sales within ~0.75 mi
| Address | Dist | Beds/Ba | Sqft | Sold | Price | $/sf | Match |
|---|---|---|---|---|---|---|---|
| 622 N 14th St | 0.06mi | 3/2.0 | 1,876 (+6%) | 10mo | $89,000 | $47 | 79 |
| 521 N 16th St | 0.13mi | 3/2.0 | 1,700 (-4%) | 17mo | $192,000 | $113 | 73 |
| 420 N 18th. St | 0.29mi | 3/2.0 | 1,863 (+5%) | 8mo | $155,000 | $83 | 72 |
| 1415 Cindy St | 0.57mi | 3/2.0 | 1,700 (-4%) | 2mo | $159,000 | $94 | 65 |
| 442 Circle Dr | 0.37mi | 3/2.0 | 1,600 (-10%) | 3mo | $89,900 | $56 | 64 |
| 710 N 16th St | 0.10mi | 3/2.0 | 1,980 (+12%) | 16mo | $110,000 | $56 | 63 |
| 707 E Grand Ave | 0.46mi | 3/2.0 | 1,700 (-4%) | 10mo | $100,600 | $59 | 63 |
| 601 Pine Tree Rd | 0.25mi | 3/2.0 | 1,966 (+11%) | 17mo | $227,500 | $116 | 56 |
| 18064 Cr Ns 228 | 0.52mi | 3/2.0 | 2,000 (+13%) | 6mo | $650,000 | $325 | 49 |
| 322 N 18th St | 0.34mi | 4/1.0 (+1) | 2,035 (+15%) | 2mo | $159,900 | $79 | 49 |
| 107 N 21st St | 0.61mi | 4/1.0 (+1) | 1,600 (-10%) | 3mo | $115,000 | $72 | 43 |
| 1523 Cindy St | 0.64mi | 2/2.0 (-1) | 1,700 (-4%) | 18mo | $133,000 | $78 | 43 |
Match score weights: distance 35% · size 25% · config 20% · recency 20%. Top-matched comps best support the ARV.
Projected returns pro-forma
-3.0% appreciation · 3.0% rent growth · sell at horizon
- IRR
- 12.7%
- Equity multiple
- 1.51×
- Total profit
- $12,734
- Equity at exit
- $13,404
- IRR
- 21.6%
- Equity multiple
- 2.83×
- Total profit
- $46,179
- Equity at exit
- $7,773
Cash invested: $25,172 (down + closing). Projections, not guarantees.
Landlord ↔ Tenant lean methodology
- Overall (STATE)
- 83 Strongly Landlord-Friendly
- State Oklahoma
- 83 Strongly Landlord-Friendly · R+20
- County
- — inherits STATE
- City
- — inherits STATE
ZIP-level market 73542
- Home prices YoY
- -2.0%
- Active inventory
- 31
- Price-to-rent
- 6.0×
Monthly cashflow live
- Estimated rent
- $1,243 medium interval (Pro) →
- Mortgage (P&I)
- −$471
- Tax from tax record
- −$44 /mo · $525/yr
- Insurance
- −$37
- HOA
- −$0
- Vacancy / Maint / Mgmt
- −$261
- Net cashflow
- $429
Break-even live
UW: 25.0% down · 7.5% · 30yr · 1.5% tax · 5.0% vac · 8.0% maint · 8.0% mgmt
Financing live
Cash to close
- Down payment
- $22,475
- Closing costs
- $2,697
- Reserves months
- —
- Total cash needed
- —
Loan-product check · same deal, 3 products live
Conventional
25% down · 7.5% · 30yr
- Down + closing
- —
- Monthly P&I
- —
- Monthly cashflow
- —
- DSCR
- —
- Eligible?
- —
Personal DTI + credit; lowest rate.
DSCR
20% down · 8.5% · 30yr
- Down + closing
- —
- Monthly P&I
- —
- Monthly cashflow
- —
- DSCR
- —
- Eligible?
- —
No personal income docs; deal must DSCR.
Hard money
10% down · 12.0% · 12mo
- Down + closing
- —
- Monthly P&I
- —
- Monthly cashflow
- —
- DSCR
- —
- Eligible?
- —
Short-term bridge; refi at stabilization.
Listing history 16 events
-
2026-06-15days on market $89,900 Active 34 DOM
-
2026-06-13days on market $89,900 Active 32 DOM
-
2026-06-12days on market $89,900 Active 31 DOM
-
2026-06-09days on market $89,900 Active 28 DOM
-
2026-06-08days on market $89,900 Active 27 DOM
-
2026-06-08days on market $89,900 Active 26 DOM
-
2026-06-07days on market $89,900 Active 25 DOM
-
2026-06-04days on market $89,900 Active 22 DOM
-
2026-06-02days on market $89,900 Active 21 DOM
-
2026-06-01days on market $89,900 Active 20 DOM
-
2026-05-31days on market $89,900 Active 19 DOM
-
2026-05-10$89,900 Active
-
2020-08-17soldstatus $57,000
-
2020-08-14soldstatus $57,000 262-char remark
Show marketing remark (262 chars)
Original hardwood floors, large open kitchen & dining, secluded master make this home special. Home has lots of storage. Two-car garage, fenced backyard, single carport and storm cellar under covered patio. This home is very spacious and close to schools.
-
2019-02-13$55,000 262-char remark
Show marketing remark (262 chars)
Original hardwood floors, large open kitchen & dining, secluded master make this home special. Home has lots of storage. Two-car garage, fenced backyard, single carport and storm cellar under covered patio. This home is very spacious and close to schools.
-
2003-08-26soldstatus $44,887
ⓘ Source: listings_history table (triggers on properties + properties_extension) + one-shot
backfill from property_details.listing_events for pre-trigger history.
Tax reassessment forecast OK · Resets to sale price
- Current annual tax
- $525 · $44/mo
- Projected year-2 tax
- $809 · $67/mo
- Expected delta
- +$284/yr (+$24/mo · 54.1%)
ⓘ Screening estimate from a state-policy table — verify with the county assessor before closing.
Climate risk First Street
- Flood 1/10 Low 0% chance over 30 yrs
- Wildfire 3/10 Moderate
- Heat 7/10 Severe 7 d/yr ≥109°F today · 20 d/yr by 30 yrs out
- Wind 3/10 Moderate 5% chance of damaging wind over 30 yrs
- Air quality 1/10 Low 0 unhealthy d/yr today · 0 by 30 yrs out
Nearby sold comps map
Loading sold comps map…
Walkable amenities ~0.75 mi
Loading nearby amenities…
Taxation est. · year 1
- Rental income
- $14,912
- − Mortgage interest
- −$5,036
- − Property taxes
- −$525
- − Insurance
- −$450
- − Repairs & maintenance
- −$1,193
- − Management
- −$1,193
- − Depreciation
- −$2,615
- Taxable income
- $3,900
- Est. tax owed @ 24.0%
- −$936
- After-tax cash flow
- $4,212/yr
For passive investors: Depreciation is non-cash, so a rental often shows a tax loss while cash-flowing — sheltering income. Rental losses are passive: they offset passive income freely, and up to $25,000/yr can offset ordinary (W-2) income if you actively participate and your MAGI is under $100k (phasing out to $0 by $150k); unused losses carry forward. On sale, claimed depreciation is recaptured at up to 25%, and gains may owe capital-gains tax (a 1031 exchange can defer both). Figures are a year-1 estimate at your 24.0% rate — not tax advice; consult a CPA.
Schools (NCES district)
- District
- Frederick
- NCES district ID
- 4012150
- Math proficiency
- 41% ▼ -2.00%
- Reading proficiency
- 28% ▼ -13.00%
- Median HH income
- $34,495
- Composite
- 28.52/100
- National rank
- #6735
- State rank
- #46 of 270 in OK
Livability — Frederick
- Score
- 61/100
- State rank
- #304
- US rank
- #17869
Category grades
Schools grade is shown separately in the Schools card above.
Census & demographics
- Census place
- Frederick, OK
- Population (ZIP)
- 4,167
Population outlook (Tillman County) Hauer SSP2
- Today (2025)
- 6,949 people
- By 2030
- 6,737 · -3.1%
- By 2040
- 6,402 · -7.9%
- By 2050
- 6,364 · -8.4%
- By 2075
- 7,335 · +5.6%
- By 2100
- 9,166 · +31.9%
Race, ethnicity, and origin ACS 2023
- Neighborhood character
- Diverse neighborhood (Simpson 0.61)
- Race & ethnicity
- White 54% Hispanic / Latino 31% Two or more races 13% Black 9% Native American 3%
- Hispanic origin (detail)
- Mexican 29%
- Common ancestry
- Italian 3% European 1% Slovak 1%
- Foreign-born
- 3% · Canada
- Languages at home
- 88% English-only · Spanish 12%
Political lean MEDSL · Tillman
- 2024 margin
- Solid R (+59.5) · D 19.7% · R 79.2% · Other 1.1%
- 2008→2024 swing
- -23.8pp toward R · 2008: -35.6pp · 2024: -59.5pp
- All cycles
- 2024: R+59.5 2020: R+54.6 2016: R+47.6 2012: R+33.4 2008: R+35.6
Not yet ingested
- Civics
- —
Market trends
- HPI YoY
- ▼ -3.32%
- Current HPI
- 159.0458
- Rent YoY
- —
- Metro
- —
- State GDP YoY
- ▲ 1.55%
- F500 in state
- 6
Industry mix (Fortune 500 HQ in OK)
| Industry | F500 HQs | Revenue |
|---|---|---|
| Energy | 3 | $48B |
|
||
Price history
+100.3% since first listed5 events — show timeline
- 2026-05-10 Listed $89,900 LBRMLS
- 2020-08-17 Sold (Public Records) $57,000 Public Records
- 2020-08-14 Sold (MLS) $57,000 LBRMLS
- 2019-02-13 Listed $55,000 LBRMLS
- 2003-08-26 Sold (Public Records) $44,887 Public Records
Property tax history
+2.8%/yrLatest (2025): $525 · +4.4% YoY. Source: county tax records.
Cash-flow waterfall
monthlySold comps — $/sqft
last 12 mo · ≤1 miLoading sold comps…