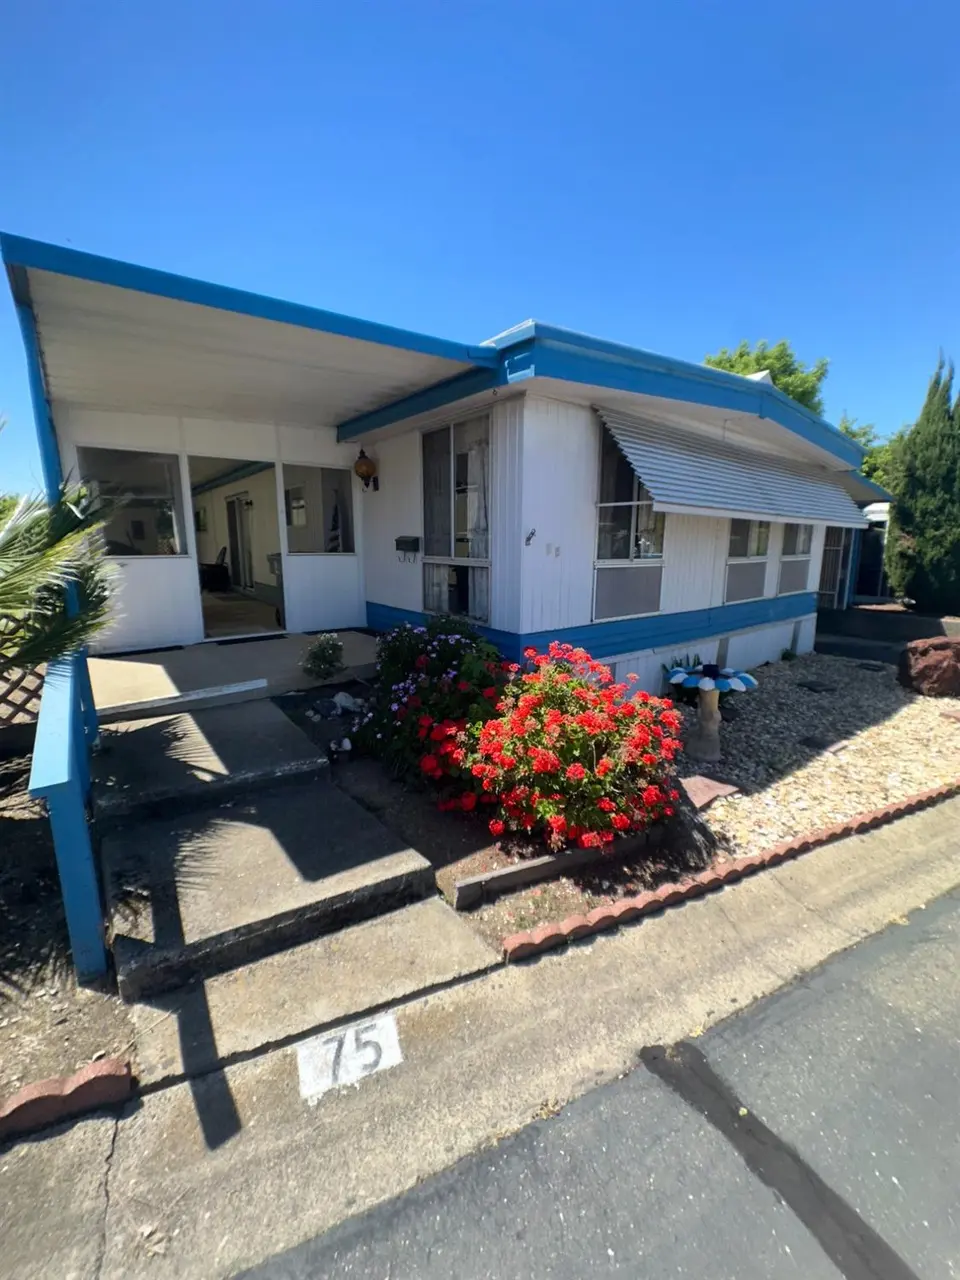
75 Redwood Ln · Folsom, CA
Flood risk 5/10 · Moderate
- FEMA flood zone
- X (unshaded)
- Chance of flooding over 30 yrs
- 0.24%
- Est. flood insurance / yr
- $507 – $1,088
Fire risk 3/10 · Minor
- Est. fire insurance / yr
- $659 – $1,223
Heat risk 7/10 · Major
- Hot days now (above 103°F)
- 7 days/yr
- Hot days in 30 yrs
- 15 days/yr
Wind risk 1/10 · Minimal
- Chance of severe wind over 30 yrs
- —
Air-quality risk 10/10 · Severe
- Unhealthy air days now
- 30 days/yr
- Unhealthy air days in 30 yrs
- 38 days/yr
Risk factors via First Street. Map © Google.
Why this score? — see what drove the B grade
The composite is a weighted blend of 9 inputs, each scored 0–100. Each bar is that input's sub-score; the figure is the points it added to the 100-point composite (weight × sub-score).
- Cash flow +30.0/30.0
- ARV discount +12.4/15.0
- 1% rule +10.0/10.0
- DSCR +10.0/10.0
- Livability +3.6/5.0
- Rent growth +2.9/5.0
- Condition / age +2.5/5.0
- Schools +2.4/10.0
- Appreciation +0.0/10.0
$120,000
🖨 Deal sheet 📄 Offer letter ✓ Due diligence
Listing remarks
Welcome to easy living in this charming 2-bedroom, 2-bath manufactured home located in a desirable 55+ community at Folsom Manor! Offering 1,344 sq ft of comfortable living space, this home features a spacious master suite, indoor laundry, newer HVAC, and a covered carport for added convenience. Enjoy a welcoming layout with plenty of natural light and functional living areas designed for comfort and relaxation. The community amenities include a clubhouse, swimming pool, and recreational facilities, providing endless opportunities to stay active and social. A wonderful opportunity to enjoy low-maintenance living in a peaceful and friendly neighborhood!
Key facts
- Clubhouse
- Covered carport
- Swimming pool
Tags
Property features AI
Finance
- Other: Located near clubhouse within the park
- Financial info: Land lease: No (listed land lease amount present but land lease indicated as No)
- HOA & community: No homeowners association; Senior community
Exterior
- Parking: Covered
- Utilities: Cable available; Natural gas connected; Public water; Public sewer
- Home design: Manufactured home in park; Double wide; Built in 1969
- Construction: Aluminum skirting; Tar and gravel roof; Skyline manufactured home
- Exterior features: Close to clubhouse; Covered parking
Interior
- Kitchen: Laminate countertops
- Bedrooms: 2 bedrooms
- Flooring: Carpet; Laminate; Linoleum
- Bathrooms: 2 full bathrooms; Tub with shower over; Shower stall(s)
- Heating & cooling: Central heating; Central air conditioning; Ceiling fans
- Interior features: Great room; Formal dining area; Laminate countertops
- Laundry & utility: Inside laundry room; 220 volt outlet in laundry
Neighborhood map
What this means for you Summary
Snapshot
- This is a 2-bed/2.0-bath manufactured listed at $120k.
Deal economics
- At list price, monthly cash flow is $1k ($14k/yr) — positive.
- The deal already cash-flows at list — no discount required.
- Meets the 1% rule at list price ($3k rent vs $120k).
- Recommended offer: $116k (3.0% below list) — sets the bar for market timing.
- Cap rate 18.1% vs local median 2.5% in Folsom — top-decile yield for the area; either an underpriced asset or a hidden risk that comps aren't pricing in. Stress-test before assuming the spread holds.
Location & tenants
- Location reads 72/100 on livability (#190 in CA) — a middle-class / working-renter tenant base. Strengths: employment A+, housing A+, schools A; Watch: amenities D, commute F, cost of living F.
- Folsom-Cordova Unified (urban): math 25% / reading 25% proficiency, ranked #365 of 517 in CA (top 71%) — low school quality limits family demand, transient renter base, plan for 1-2y turnover.
- Market conditions: Rents rising (+1.7%/yr); 422 active listings in the ZIP; 5 comparable units currently listed for rent nearby; rentals leasing fast (median 8d on market — plan ~1-2 weeks tenant-placement turnaround); 40% of comp listings sitting > 30 days — soft ceiling on asking rent; high-income renter base; 6,825 units permitted in Sacramento County in 2024 (1,752 in 5+ unit buildings).
Forward outlook
- Local home prices are declining (-3.0%/yr); year-one equity from $830 of loan paydown is wiped out by about $4k of value loss. Plan a longer hold.
- Sacramento County population projected at +17% by 2050 — long-run rental-demand tailwind backs the buy-and-hold thesis.
- At projected returns (-3.0% appreciation + 1.7% rent growth), your $34k cash investment doubles in ~3 years — after that, you're playing with house money.
Negotiation context
- It's been on market 39 days — a 3% lower offer ($116k) is reasonable based on typical stale-listing flexibility.
Risks & watch-outs
- Climate carrying-cost: moderate flood risk; extreme-heat days projected 7→15/yr by 2055 (HVAC capex compounding) — expect insurance premiums to compound above CPI over the hold.
Questions for the listing agent
- It's been on market 39 days. Have you received any prior offers? Is the seller open to a 3% concession, seller financing, or rate buy-down credit?
- Built in 1969 — when were the roof, HVAC, electrical panel, plumbing, and water heater last replaced?
- Is there a deadline driving the sale (1031 exchange, divorce, estate, relocation)? That informs how much negotiation room exists.
- Schools are A-rated — typically a magnet for longer-tenancy family renters. What's the average tenant stay here, and is there a school-zone premium baked into asking?
- What's the average days-on-market for RENTAL listings here right now (not sales)? A rising rental-DOM trend means longer vacancies and softer asking-rent achievability than the comps imply.
- What's the recent tenant-quality profile in this submarket — average credit score on applications, eviction rate, late-payment / NSF rate, and stable-employment percentage? A property-management company in the area should have these aggregated.
- How much new for-sale + rental construction is in the pipeline within 1–3 miles? Heavy new supply typically softens prices + rents 12–24 months out; constrained supply supports both.
Investment metrics
- 1% rule
- 2.12% ✓
- Cap rate
- 18.14%
- Cash-on-cash
- 42.33%
- DSCR
- 2.88
- GRM
- 3.9
CMA / ARV
- ARV (median comp)
- $134,727
- List price
- $120,000
- Delta
- -10.93%
- Verdict
- UNDERPRICED
- Comps
- 20 within 1.0 mi
Show comp detail 12 sales within ~0.75 mi
| Address | Dist | Beds/Ba | Sqft | Sold | Price | $/sf | Match |
|---|---|---|---|---|---|---|---|
| 76 Redwood Ln | 0.02mi | 2/2.0 | 1,200 (-11%) | 2mo | $92,000 | $77 | 80 |
| 347 Danielle Way | 0.25mi | 2/2.0 | 1,248 (-7%) | 2mo | $138,000 | $111 | 75 |
| 342 Danielle Way | 0.24mi | 2/2.0 | 1,440 (+7%) | 5mo | $155,000 | $108 | 73 |
| 246 Danielle Way | 0.22mi | 2/2.0 | 1,162 (-14%) | 1mo | $190,000 | $164 | 66 |
| 276 Meadowrock Way | 0.74mi | 2/2.0 | 1,344 (0%) | 1mo | $180,000 | $134 | 64 |
| 155 Leafwood Way | 0.58mi | 2/2.0 | 1,248 (-7%) | 1mo | $185,000 | $148 | 60 |
| 95 Shadowbrook Ct | 0.59mi | 2/2.0 | 1,440 (+7%) | 4mo | $170,000 | $118 | 58 |
| 320 Stonebrook Dr | 0.62mi | 2/2.0 | 1,440 (+7%) | 5mo | $165,950 | $115 | 55 |
| 587 Southwood | 0.41mi | 2/2.0 | 1,536 (+14%) | 3mo | $330,000 | $215 | 55 |
| 330 Stonebrook Dr | 0.62mi | 2/2.0 | 1,440 (+7%) | 7mo | $206,450 | $143 | 53 |
| 230 Northlake Dr | 0.69mi | 2/1.5 | 1,440 (+7%) | 7mo | $299,500 | $208 | 48 |
| 340 Stonebrook Dr | 0.63mi | 2/2.0 | 1,536 (+14%) | 6mo | $170,000 | $111 | 42 |
Match score weights: distance 35% · size 25% · config 20% · recency 20%. Top-matched comps best support the ARV.
Projected returns pro-forma
-3.0% appreciation · 1.72% rent growth · sell at horizon
- IRR
- 37.6%
- Equity multiple
- 2.57×
- Total profit
- $52,833
- Equity at exit
- $17,892
- IRR
- 43.5%
- Equity multiple
- 4.88×
- Total profit
- $130,391
- Equity at exit
- $10,375
Cash invested: $33,600 (down + closing). Projections, not guarantees.
Landlord ↔ Tenant lean methodology
- Overall (STATE)
- 18 Strongly Tenant-Friendly
- State California
- 18 Strongly Tenant-Friendly · D+13
- County
- — inherits STATE
- City
- — inherits STATE
ZIP-level market 95630
- Rents YoY
- 1.7%
- Active inventory
- 422
- Price-to-rent
- 3.9×
Monthly cashflow live
- Estimated rent
- $2,550 high interval (Pro) →
- Mortgage (P&I)
- −$629
- Tax est. 1.5%
- −$150 /mo · $1,800/yr
- Insurance
- −$50
- HOA
- −$0
- Vacancy / Maint / Mgmt
- −$535
- Net cashflow
- $1,185
Break-even live
UW: 25.0% down · 7.5% · 30yr · 1.5% tax · 5.0% vac · 8.0% maint · 8.0% mgmt
Financing live
Cash to close
- Down payment
- $30,000
- Closing costs
- $3,600
- Reserves months
- —
- Total cash needed
- —
Loan-product check · same deal, 3 products live
Conventional
25% down · 7.5% · 30yr
- Down + closing
- —
- Monthly P&I
- —
- Monthly cashflow
- —
- DSCR
- —
- Eligible?
- —
Personal DTI + credit; lowest rate.
DSCR
20% down · 8.5% · 30yr
- Down + closing
- —
- Monthly P&I
- —
- Monthly cashflow
- —
- DSCR
- —
- Eligible?
- —
No personal income docs; deal must DSCR.
Hard money
10% down · 12.0% · 12mo
- Down + closing
- —
- Monthly P&I
- —
- Monthly cashflow
- —
- DSCR
- —
- Eligible?
- —
Short-term bridge; refi at stabilization.
Rent comps 5 comps
| Address | Beds | Baths | Sqft | Rent | $/sqft | DOM | Units | Dist |
|---|---|---|---|---|---|---|---|---|
| 340 Caples Dr Folsom, CA | 3.0 | 2.5 | 1423 | $2,795 | $1.96 | 8d | 1 | 0.89mi |
| 109 N Grant Ln Folsom, CA | 2.0 | 2.0 | 1413 | $2,595 | $1.84 | 44d | 1 | 0.94mi |
| 288 Marsalla Dr Folsom, CA | 3.0 | 2.0 | 1130 | $2,495 | $2.21 | 44d | 1 | 0.96mi |
| 1600 Canyon Terrace Ln Folsom, CA | 1.0–3.0 | 1.0–2.0 | 955 | $2,348 | $2.46 | 2d | 18 | 1.02mi |
| 1000 Folsom Ranch Dr Folsom, CA | 1.0–2.0 | 1.0–2.0 | 830 | $2,399 | $2.89 | 2d | 18 | 1.17mi |
Listing history 14 events
-
2026-06-18days on market $120,000 Active 39 DOM
-
2026-06-17days on market $120,000 Active 38 DOM
-
2026-06-16days on market $120,000 Active 37 DOM
-
2026-06-15days on market $120,000 Active 36 DOM
-
2026-06-13days on market $120,000 Active 34 DOM
-
2026-06-13days on market $120,000 Active 33 DOM
-
2026-06-09days on market $120,000 Active 30 DOM
-
2026-06-08days on market $120,000 Active 29 DOM
-
2026-06-07days on market $120,000 Active 28 DOM
-
2026-06-05days on market $120,000 Active 25 DOM
-
2026-06-03days on market $120,000 Active 24 DOM
-
2026-06-02days on market $120,000 Active 23 DOM
-
2026-06-01days on market $120,000 Active 22 DOM
-
2026-05-31days on market $120,000 Active 21 DOM
ⓘ Source: listings_history table (triggers on properties + properties_extension) + one-shot
backfill from property_details.listing_events for pre-trigger history.
Climate risk First Street
- Flood 5/10 Major FEMA zone X (unshaded) · 24% chance over 30 yrs
- Wildfire 3/10 Moderate
- Heat 7/10 Severe 7 d/yr ≥103°F today · 15 d/yr by 30 yrs out
- Wind 1/10 Low
- Air quality 10/10 Extreme 30 unhealthy d/yr today · 38 by 30 yrs out
Nearby sold comps map
Loading sold comps map…
Walkable amenities ~0.75 mi
Loading nearby amenities…
Taxation est. · year 1
- Rental income
- $30,599
- − Mortgage interest
- −$6,722
- − Property taxes
- −$1,800
- − Insurance
- −$600
- − Repairs & maintenance
- −$2,448
- − Management
- −$2,448
- − Depreciation
- −$3,491
- Taxable income
- $13,091
- Est. tax owed @ 24.0%
- −$3,142
- After-tax cash flow
- $11,080/yr
For passive investors: Depreciation is non-cash, so a rental often shows a tax loss while cash-flowing — sheltering income. Rental losses are passive: they offset passive income freely, and up to $25,000/yr can offset ordinary (W-2) income if you actively participate and your MAGI is under $100k (phasing out to $0 by $150k); unused losses carry forward. On sale, claimed depreciation is recaptured at up to 25%, and gains may owe capital-gains tax (a 1031 exchange can defer both). Figures are a year-1 estimate at your 24.0% rate — not tax advice; consult a CPA.
Schools (NCES district)
- District
- Folsom-Cordova Unified
- NCES district ID
- 0613890
- Math proficiency
- 25% ▼ -27.00%
- Reading proficiency
- 25% ▼ -38.00%
- Median HH income
- $75,408
- Composite
- 24.49/100
- National rank
- #7656
- State rank
- #365 of 517 in CA
Livability — Folsom
- Score
- 72/100
- State rank
- #190
- US rank
- #6125
Category grades
Schools grade is shown separately in the Schools card above.
Census & demographics
- Census place
- Folsom, CA
- County
- Sacramento County · 1,539,646 people
- City population
- 79,484
- Metro
- Sacramento-Roseville-Folsom, CA
- Population (ZIP)
- 79,484
- Household income
- $139,642
- Rent vs Own
- Severe rent burden
- 1651.0
Population outlook (Sacramento County) Hauer SSP2
- Today (2025)
- 1,660,763 people
- By 2030
- 1,732,990 · +4.3%
- By 2040
- 1,855,755 · +11.7%
- By 2050
- 1,941,335 · +16.9%
- By 2075
- 2,046,162 · +23.2%
- By 2100
- 1,961,444 · +18.1%
Race, ethnicity, and origin ACS 2023
- Neighborhood character
- Diverse neighborhood (Simpson 0.61)
- Race & ethnicity
- White 58% Asian 20% Hispanic / Latino 13% Two or more races 11% Black 3%
- Hispanic origin (detail)
- Mexican 9% Puerto Rican 1%
- Common ancestry
- Italian 4% Slovak 2% Portuguese 2%
- Foreign-born
- 20% · Canada, China, Vietnam
- Languages at home
- 75% English-only · Other Indo-European 7% Spanish 5% Other Asian/Pacific 5%
Political lean MEDSL · Sacramento
- 2024 margin
- D (+19.7) · D 58.1% · R 38.4% · Other 3.5%
- 2008→2024 swing
- +0.7pp no change · 2008: 19.0pp · 2024: 19.7pp
- All cycles
- 2024: D+19.7 2020: D+25.3 2016: D+23.7 2012: D+16.3 2008: D+19.0
Not yet ingested
- Civics
- —
Market trends
- HPI YoY
- ▼ -240.39%
- Current HPI
- 286.0579
- Rent YoY
- ▲ 1.72%
- Metro
- Sacramento-Roseville-Folsom, CA
- State GDP YoY
- ▲ 3.21%
- F500 in state
- 116
Industry mix (Fortune 500 HQ in CA)
| Industry | F500 HQs | Revenue |
|---|---|---|
| Technology | 27 | $1,492B |
|
||
| Financial Services | 3 | $174B |
|
||
| Retail | 3 | $44B |
|
||
| Insurance | 3 | $26B |
|
||
| Media / Entertainment | 2 | $115B |
|
||
| Pharmaceuticals / Biotech | 2 | $62B |
|
||
Cash-flow waterfall
monthlySold comps — $/sqft
last 12 mo · ≤1 miLoading sold comps…