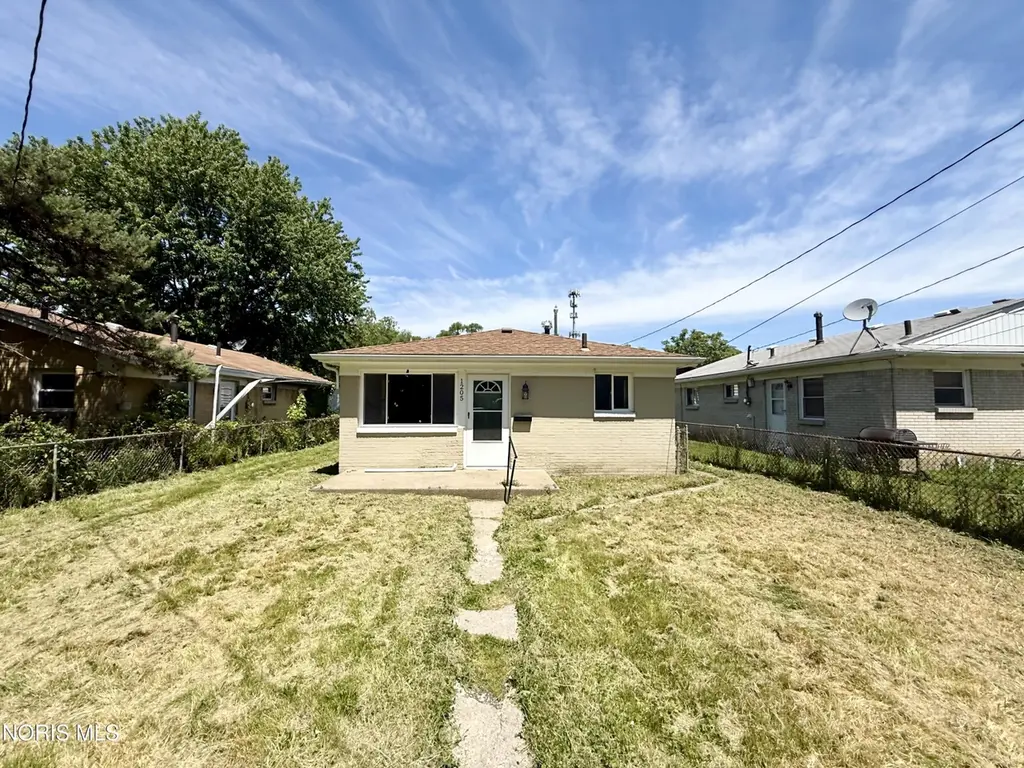
1205 Liberty St · Toledo, OH
Flood risk 1/10 · Minimal
- FEMA flood zone
- X (unshaded)
- Chance of flooding over 30 yrs
- 0.0%
- Est. flood insurance / yr
- $507 – $1,088
Fire risk 1/10 · Minimal
- Est. fire insurance / yr
- $713 – $1,323
Heat risk 3/10 · Minor
- Hot days now (above 100°F)
- 7 days/yr
- Hot days in 30 yrs
- 16 days/yr
Wind risk 2/10 · Minimal
- Chance of severe wind over 30 yrs
- —
Air-quality risk 2/10 · Minimal
- Unhealthy air days now
- 1 days/yr
- Unhealthy air days in 30 yrs
- 2 days/yr
Risk factors via First Street. Map © Google.
Why this score? — see what drove the D grade
The composite is a weighted blend of 9 inputs, each scored 0–100. Each bar is that input's sub-score; the figure is the points it added to the 100-point composite (weight × sub-score).
- Cash flow +20.4/30.0
- DSCR +6.5/10.0
- 1% rule +4.9/10.0
- Rent growth +3.8/5.0
- Livability +3.3/5.0
- Condition / age +2.5/5.0
- Schools +1.6/10.0
- ARV discount +0.0/15.0
- Appreciation +0.0/10.0
$109,400
🖨 Deal sheet 📄 Offer letter ✓ Due diligence
Listing remarks MLS
Come check out this beautifully renovated bungalow on Liberty street in the East side of Toledo. This property has a ton of updates including new windows, gutters, doors, refinished hard wood floors, light fixtures, cabinets, counters, backsplash, plumbing fixtures, flooring in the kitchen and bathroom, electrical panel and breakers, interior doors, new tub, subway tiled tub surround, vanity, toilet, hot water tank. This property also includes a 2.5 car garage with alleway accesss. Check with lender for down-payment assistance program.
Key facts
- 4,700 sq ft lot
- 2 garage spots
- Built 1960
Property features AI
Exterior
- Parking: Detached garage; Approximately 2.5 garage spaces (2.5 total parking)
- Utilities: Electricity available (circuit breakers); Public water; Public sewer
- Home design: Single-family house; One story; One level
- Construction: Brick construction; Crawl space foundation; Built as a house (no common walls)
- Exterior features: Shingle roof
Interior
- Kitchen: Dishwasher; Gas cooktop; Gas oven; Microwave; Refrigerator; Water heater
- Bedrooms: Main-level bedroom (Bedroom 2); Main-level bedroom (Bedroom 3)
- Flooring: Wood flooring
- Bathrooms: 1 full bathroom
- Heating & cooling: Forced air heating; Natural gas heating; Heating present
- Interior features: Open living room; Other interior features
- Laundry & utility: Main-level laundry (other features)
Neighborhood map
What this means for you Summary
Snapshot
- This is a 3-bed/1.0-bath single-family listed at $109k.
Deal economics
- At list price, monthly cash flow is $142 ($2k/yr) — positive.
- The deal already cash-flows at list — no discount required.
- To meet the 1% rule (rent ≥ 1% of price), the offer needs to be $108k (1.3% below list).
- Recommended offer: $108k (1.3% below list) — sets the bar for 1% rule.
Location & tenants
- Location reads 66/100 on livability (#645 in OH) — a middle-class / working-renter tenant base. Strengths: cost of living A+, housing A+, health & safety A+; Watch: amenities C-, crime F, commute F.
- Toledo City (urban): math 15% / reading 24% proficiency, ranked #634 of 656 in OH (top 97%) — low school quality limits family demand, transient renter base, plan for 1-2y turnover; 72% free/reduced lunch — lower-income household profile, screen leases tightly.
- Zoned schools: Oakdale Elementary School (math 13% / reading 21%, grade F, #1,337 of 1,584 statewide, top 86%, 385 students, 0% FRL); Waite High School (math 12% / reading 24%, grade F, #687 of 781 statewide, top 88%, 997 students, 0% FRL) — zoned schools average 0% FRL vs 72% district-wide (72 pts lower); this property's tenant base skews higher-income than the district average.
- Market conditions: Rents rising fast (+5.4%/yr); 117 active listings in the ZIP; 21 comparable units currently listed for rent nearby; rentals lingering (median 44d on market — plan ~5-8 weeks vacancy on turnover, expect pricing pressure); 57% of comp listings sitting > 30 days — soft ceiling on asking rent; lower-income renter base — watch delinquency; 415 units permitted in Lucas County in 2024 (122 in 5+ unit buildings).
- This rent runs 33% of the median local income ($39k/yr) — at the standard rent-burdened threshold; future hikes will face affordability resistance.
Forward outlook
- Local home prices are declining (-3.0%/yr); year-one equity from $756 of loan paydown is wiped out by about $3k of value loss. Plan a longer hold.
- Lucas County population projected at -16% by 2050 — secular population decline; favor cash flow + early exit over multi-decade hold.
Negotiation context
- Only 14 days on market — expect competitive offers; lowballing is unlikely to land.
- 2 sale attempts since 2y ago; this cycle's ask is 9055% above the opening price — seller raised mid-cycle; expect resistance to lowballs.
- Current owner paid $87k; 26% above their basis — modest negotiation headroom, anchor on the comps not their cost.
Questions for the listing agent
- Built in 1960 — when were the roof, HVAC, electrical panel, plumbing, and water heater last replaced?
- Is there a deadline driving the sale (1031 exchange, divorce, estate, relocation)? That informs how much negotiation room exists.
- Schools are D-rated, which usually means shorter tenancies and higher turnover. Who's the typical renter profile here, and what's been the actual vacancy rate?
- Crime grade is F in this area — have there been break-ins, vandalism, or insurance claims at this property in the last 3 years? What carrier currently insures it and at what premium?
- The area grade is low — what's the realistic commute time and amenity access for the typical tenant pool here? Any planned neighborhood developments (good or bad) we should know about?
- What's the average days-on-market for RENTAL listings here right now (not sales)? A rising rental-DOM trend means longer vacancies and softer asking-rent achievability than the comps imply.
- What's the recent tenant-quality profile in this submarket — average credit score on applications, eviction rate, late-payment / NSF rate, and stable-employment percentage? A property-management company in the area should have these aggregated.
- How much new for-sale + rental construction is in the pipeline within 1–3 miles? Heavy new supply typically softens prices + rents 12–24 months out; constrained supply supports both.
Investment metrics
- 1% rule
- 0.99% ✗
- Cap rate
- 7.85%
- Cash-on-cash
- 5.56%
- DSCR
- 1.25
- GRM
- 8.4
CMA / ARV
- ARV (on-the-fly)
- $78,624
- Comps found
- 12
Show comp detail 12 sales within ~0.75 mi
| Address | Dist | Beds/Ba | Sqft | Sold | Price | $/sf | Match |
|---|---|---|---|---|---|---|---|
| 1213 Albert St | 0.10mi | 3/1.0 | 933 (+8%) | 7mo | $90,000 | $96 | 76 |
| 1434 Emerson St | 0.35mi | 3/1.0 | 936 (+8%) | 9mo | $85,000 | $91 | 63 |
| 921 Berry St | 0.43mi | 4/1.0 (+1) | 924 (+7%) | 4mo | $37,000 | $40 | 60 |
| 1462 Holmes St | 0.45mi | 3/1.0 | 950 (+10%) | 4mo | $128,000 | $135 | 59 |
| 1723 Liberty St | 0.34mi | 2/1.0 (-1) | 954 (+10%) | 5mo | $68,999 | $72 | 58 |
| 1439 Emerson St | 0.37mi | 2/1.0 (-1) | 792 (-8%) | 9mo | $75,000 | $95 | 56 |
| 1110 Camden St | 0.47mi | 3/1.0 | 982 (+14%) | 6mo | $67,000 | $68 | 50 |
| 636 White St | 0.73mi | 3/1.0 | 912 (+6%) | 8mo | $52,000 | $57 | 50 |
| 541 Oakdale Ave | 0.60mi | 2/1.5 (-1) | 936 (+8%) | 3mo | $126,000 | $135 | 49 |
| 643 Willard St | 0.70mi | 2/1.0 (-1) | 912 (+6%) | 7mo | $39,500 | $43 | 47 |
| 1534 Lakewood St | 0.56mi | 2/1.0 (-1) | 748 (-13%) | 8mo | $68,500 | $92 | 40 |
| 1813 Milroy St | 0.73mi | 2/1.0 (-1) | 960 (+11%) | 4mo | $60,480 | $63 | 39 |
Match score weights: distance 35% · size 25% · config 20% · recency 20%. Top-matched comps best support the ARV.
Projected returns pro-forma
-3.0% appreciation · 5.37% rent growth · sell at horizon
- IRR
- -5.2%
- Equity multiple
- 0.80×
- Total profit
- $-6,063
- Equity at exit
- $16,312
- IRR
- 7.0%
- Equity multiple
- 1.58×
- Total profit
- $17,672
- Equity at exit
- $9,459
Cash invested: $30,632 (down + closing). Projections, not guarantees.
Landlord ↔ Tenant lean methodology
- Overall (STATE)
- 73 Landlord-Friendly
- State Ohio
- 73 Landlord-Friendly · R+6
- County
- — inherits STATE
- City
- — inherits STATE
ZIP-level market 43605
- Home prices YoY
- -25.6%
- Rents YoY
- 5.4%
- Active inventory
- 117
- Price-to-rent
- 8.4×
Monthly cashflow live
- Estimated rent
- $1,080 high interval (Pro) →
- Mortgage (P&I)
- −$574
- Tax from tax record
- −$92 /mo · $1,106/yr
- Insurance
- −$46
- HOA
- −$0
- Vacancy / Maint / Mgmt
- −$227
- Net cashflow
- $142
Break-even live
UW: 25.0% down · 7.5% · 30yr · 1.5% tax · 5.0% vac · 8.0% maint · 8.0% mgmt
Financing live
Cash to close
- Down payment
- $27,350
- Closing costs
- $3,282
- Reserves months
- —
- Total cash needed
- —
Loan-product check · same deal, 3 products live
Conventional
25% down · 7.5% · 30yr
- Down + closing
- —
- Monthly P&I
- —
- Monthly cashflow
- —
- DSCR
- —
- Eligible?
- —
Personal DTI + credit; lowest rate.
DSCR
20% down · 8.5% · 30yr
- Down + closing
- —
- Monthly P&I
- —
- Monthly cashflow
- —
- DSCR
- —
- Eligible?
- —
No personal income docs; deal must DSCR.
Hard money
10% down · 12.0% · 12mo
- Down + closing
- —
- Monthly P&I
- —
- Monthly cashflow
- —
- DSCR
- —
- Eligible?
- —
Short-term bridge; refi at stabilization.
Rent comps 21 comps
| Address | Beds | Baths | Sqft | Rent | $/sqft | DOM | Units | Dist |
|---|---|---|---|---|---|---|---|---|
| 1205 Liberty St Unit NA Toledo, OH | 3.0 | 1.0 | 864 | $1,195 | $1.38 | 44d | 1 | 0.04mi |
| 1537 Carlyle St Toledo, OH | 2.0 | 1.0 | 800 | $800 | $1.00 | 23d | 1 | 0.42mi |
| 948 White St Toledo, OH | 3.0 | 1.0 | 1024 | $1,135 | $1.11 | 14d | 1 | 0.49mi |
| 946 Butler St Toledo, OH | 2.0 | 1.0 | 944 | $650 | $0.69 | 44d | 1 | 0.57mi |
| 1537 Remington St Toledo, OH | 3.0 | 1.0 | 1064 | $1,095 | $1.03 | 44d | 1 | 0.59mi |
| 724 Plymouth St Toledo, OH | 2.0 | 1.0 | 819 | $750 | $0.92 | 44d | 1 | 0.65mi |
| 950 Oak St Unit 1 Toledo, OH | 2.0 | 1.0 | 725 | $700 | $0.97 | 44d | 1 | 0.71mi |
| 834 Oak St Toledo, OH | 3.0 | 1.0 | 1064 | $900 | $0.85 | 44d | 1 | 0.81mi |
| 1123 Nevada St Toledo, OH | 2.0 | 1.0 | 792 | $900 | $1.14 | 14d | 1 | 0.84mi |
| 557 Valleywood Dr Toledo, OH | 3.0 | 1.0 | 848 | $1,100 | $1.30 | 44d | 1 | 0.90mi |
| 571 Howland Ave Toledo, OH | 2.0 | 1.0 | 874 | $875 | $1.00 | 44d | 1 | 0.95mi |
| 508 Howland Ave Toledo, OH | 3.0 | 1.0 | 840 | $1,000 | $1.19 | 44d | 1 | 1.01mi |
| 732 Coyne Ave Toledo, OH | 3.0 | 1.0 | 968 | $1,145 | $1.18 | 14d | 1 | 1.04mi |
| 722 Coyne Ave Toledo, OH | 2.0 | 1.0 | 900 | $1,000 | $1.11 | 14d | 1 | 1.05mi |
| 653 Oswald St Toledo, OH | 2.0 | 1.0 | 920 | $800 | $0.87 | 44d | 1 | 1.17mi |
| 2337 Burnside Ave Oregon, OH | 2.0 | 1.0 | 1025 | $1,150 | $1.12 | 14d | 1 | 1.21mi |
| 2401 Burnside Ave Oregon, OH | 2.0 | 1.0 | 1025 | $1,150 | $1.12 | 14d | 1 | 1.25mi |
| 2074 Starr Ave Toledo, OH | 3.0 | 1.0 | 1115 | $1,025 | $0.92 | 23d | 1 | 1.26mi |
| 223 Valleywood Dr Toledo, OH | 2.0 | 1.0 | 1098 | $1,099 | $1.00 | 23d | 1 | 1.36mi |
| 470 2nd St Unit 1 Toledo, OH | 2.0 | 1.0 | 950 | $799 | $0.84 | 44d | 1 | 1.38mi |
| 1103 S Wheeling St Oregon, OH | 2.0 | 1.0 | 825 | $1,049 | $1.27 | 44d | 1 | 1.46mi |
Listing history 13 events
-
2026-06-18days on market $109,400 Active 14 DOM
-
2026-06-17days on market $109,400 Active 13 DOM
-
2026-06-16days on market $109,400 Active 12 DOM
-
2026-06-15days on market $109,400 Active 11 DOM
-
2026-06-14remarks 357-char remark
-
2026-06-14pricedays on market $109,400 Active 9 DOM
-
2026-06-10days on market $109,500 Active 6 DOM
-
2026-06-09days on market $109,500 Active 5 DOM
-
2026-06-08days on market $109,500 Active 4 DOM
-
2026-06-07days on market $109,500 Active 3 DOM
-
2026-06-05status $109,500 Active 1 DOM
-
2026-06-03remarks 322-char remark
-
2026-06-03$109,500 Coming Soon 1 DOM
ⓘ Source: listings_history table (triggers on properties + properties_extension) + one-shot
backfill from property_details.listing_events for pre-trigger history.
Tax reassessment forecast OH · Partial reset (capped growth)
- Current annual tax
- $1,106 · $92/mo
- Projected year-2 tax
- $1,406 · $117/mo
- Expected delta
- +$301/yr (+$25/mo · 27.2%)
ⓘ Screening estimate from a state-policy table — verify with the county assessor before closing.
Climate risk First Street
- Flood 1/10 Low FEMA zone X (unshaded) · 0% chance over 30 yrs
- Wildfire 1/10 Low
- Heat 3/10 Moderate 7 d/yr ≥100°F today · 16 d/yr by 30 yrs out
- Wind 2/10 Low
- Air quality 2/10 Low 1 unhealthy d/yr today · 2 by 30 yrs out
Nearby sold comps map
Loading sold comps map…
Walkable amenities ~0.75 mi
Loading nearby amenities…
Taxation est. · year 1
- Rental income
- $12,962
- − Mortgage interest
- −$6,128
- − Property taxes
- −$1,106
- − Insurance
- −$547
- − Repairs & maintenance
- −$1,037
- − Management
- −$1,037
- − Depreciation
- −$3,183
- Taxable loss
- −$75
- Est. tax savings @ 24.0%
- +$18
- After-tax cash flow
- $1,721/yr
For passive investors: Depreciation is non-cash, so a rental often shows a tax loss while cash-flowing — sheltering income. Rental losses are passive: they offset passive income freely, and up to $25,000/yr can offset ordinary (W-2) income if you actively participate and your MAGI is under $100k (phasing out to $0 by $150k); unused losses carry forward. On sale, claimed depreciation is recaptured at up to 25%, and gains may owe capital-gains tax (a 1031 exchange can defer both). Figures are a year-1 estimate at your 24.0% rate — not tax advice; consult a CPA.
Schools (NCES district)
- District
- Toledo City
- NCES district ID
- 3904490
- Math proficiency
- 15% ▼ -16.00%
- Reading proficiency
- 24% ▼ -13.00%
- Median HH income
- $32,137
- Composite
- 15.76/100
- National rank
- #9276
- State rank
- #634 of 656 in OH
Livability — Toledo
- Score
- 66/100
- State rank
- #645
- US rank
- #11442
Category grades
Schools grade is shown separately in the Schools card above.
Census & demographics
- Census place
- Toledo, OH
- County
- Lucas County · 380,724 people
- City population
- 280,811
- Metro
- Toledo, OH
- Population (ZIP)
- 24,441
- Household income
- $39,118
- Rent vs Own
- Severe rent burden
- 1257.0
Population outlook (Lucas County) Hauer SSP2
- Today (2025)
- 420,751 people
- By 2030
- 410,187 · -2.5%
- By 2040
- 384,019 · -8.7%
- By 2050
- 355,125 · -15.6%
- By 2075
- 291,683 · -30.7%
- By 2100
- 233,670 · -44.5%
Race, ethnicity, and origin ACS 2023
- Neighborhood character
- Diverse neighborhood (Simpson 0.61)
- Race & ethnicity
- White 57% Hispanic / Latino 21% Black 14% Two or more races 14%
- Hispanic origin (detail)
- Mexican 17% Puerto Rican 2%
- Common ancestry
- Romanian 3% Lithuanian 2% Portuguese 1%
- Foreign-born
- 3% · Canada
- Languages at home
- 91% English-only · Spanish 7% Arabic 1%
Political lean MEDSL · Lucas
- 2024 margin
- D (+12.6) · D 55.8% · R 43.2%
- 2008→2024 swing
- -18.9pp toward R · 2008: 31.4pp · 2024: 12.6pp
- All cycles
- 2024: D+12.6 2020: D+16.8 2016: D+17.4 2012: D+30.4 2008: D+31.4
Not yet ingested
- Civics
- —
Market trends
- HPI YoY
- ▼ -47.85%
- Current HPI
- 138.6894
- Rent YoY
- ▲ 5.37%
- Metro
- Toledo, OH
- State GDP YoY
- ▲ 1.98%
- F500 in state
- 48
Industry mix (Fortune 500 HQ in OH)
| Industry | F500 HQs | Revenue |
|---|---|---|
| Insurance | 3 | $145B |
|
||
| Industrial Machinery | 3 | $49B |
|
||
| Financial Services | 3 | $24B |
|
||
| Consumer Goods | 2 | $93B |
|
||
| Aerospace / Defense | 2 | $47B |
|
||
| Utilities | 2 | $33B |
|
||
Price history
+18.4% since first listed10 events — show timeline
- 2026-06-02 Coming Soon $109,500 NORIS
- 2026-03-06 Rental Removed $1,195 Avail
- 2026-02-17 Listed for Rent $1,195 Avail
- 2025-10-14 Price Changed $86,800 NORIS
- 2024-08-21 Sold (Public Records) $86,800 Public Records
- 2024-08-14 Pending — NORIS
- 2024-08-12 Sold (MLS) $86,800 NORIS
- 2024-06-20 Contingent — NORIS
- 2024-06-07 Listed $92,500 NORIS
- 2024-06-06 Coming Soon $92,500 NORIS
Property tax history
+4.4%/yrLatest (2025): $1,106 · +2.9% YoY. Source: county tax records.
Cash-flow waterfall
monthlySold comps — $/sqft
last 12 mo · ≤1 miLoading sold comps…