2195 Sellers Rd · Middlebourne, WV
Flood risk 9/10 · Severe
- FEMA flood zone
- A
- Chance of flooding over 30 yrs
- 0.99%
- Est. flood insurance / yr
- $1,009 – $1,996
Fire risk 2/10 · Minimal
- Est. fire insurance / yr
- $787 – $1,461
Heat risk 4/10 · Minor
- Hot days now (above 98°F)
- 7 days/yr
- Hot days in 30 yrs
- 18 days/yr
Wind risk 1/10 · Minimal
- Chance of severe wind over 30 yrs
- 1.0%
Air-quality risk 1/10 · Minimal
- Unhealthy air days now
- 0 days/yr
- Unhealthy air days in 30 yrs
- 0 days/yr
Risk factors via First Street. Map © Google.
Why this score? — see what drove the B grade
The composite is a weighted blend of 9 inputs, each scored 0–100. Each bar is that input's sub-score; the figure is the points it added to the 100-point composite (weight × sub-score).
- Cash flow +30.0/30.0
- DSCR +10.0/10.0
- 1% rule +9.6/10.0
- ARV discount +7.5/15.0
- Appreciation +7.5/10.0
- Livability +3.2/5.0
- Schools +2.9/10.0
- Rent growth +2.5/5.0
- Condition / age +1.0/5.0
$57,900
🖨 Deal sheet 📄 Offer letter ✓ Due diligence
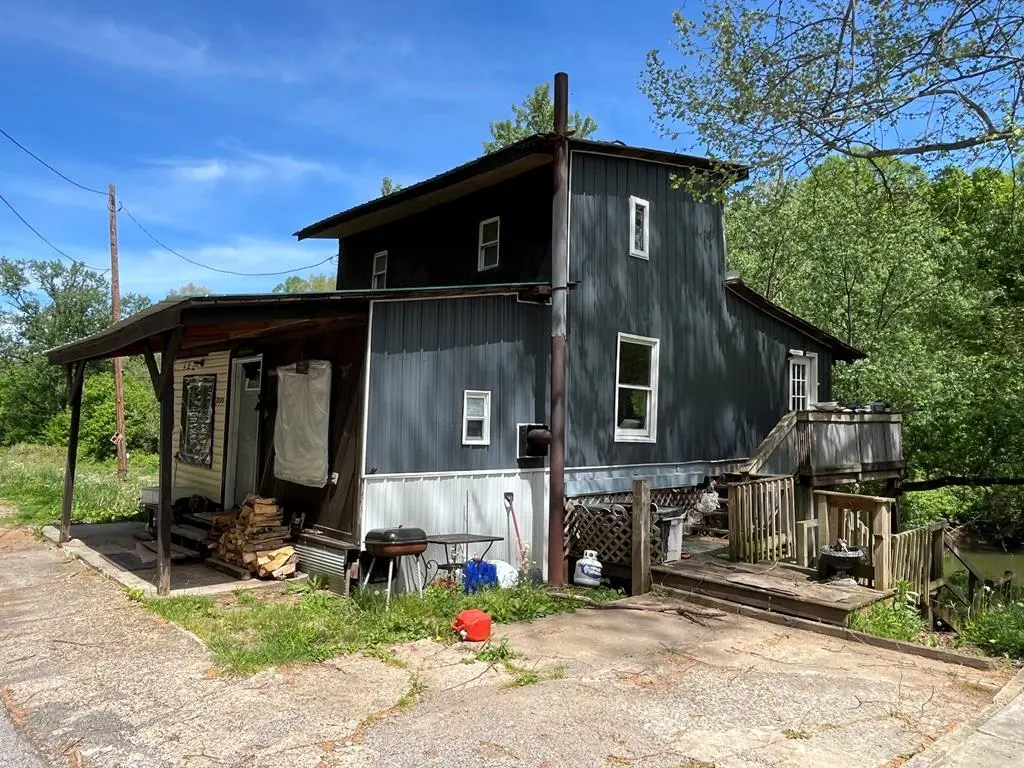
Listing remarks
Want a good place on the creek (Middle Island Creek) to fish, kayak or canoe this is a place for you. Camp does need some work.
Key facts
- 0.39 acre lot
- Built 2000
- Listed 51 days
Property features AI
Exterior
- Utilities: Private well water; Septic tank sewer
- Home design: Single-family residence (Cape Cod style); Single-story
- Construction: Wood siding construction
- Exterior features: Front porch; Metal roof; Lot is level to sloped
Interior
- Kitchen: Range; Refrigerator
- Bedrooms: Total of 4 rooms (bedrooms not individually detailed)
- Flooring: Carpet
- Bathrooms: 1 full bathroom
- Heating & cooling: Wood heating
- Interior features: Wood-burning fireplace; Electric water heater
Neighborhood map
What this means for you Summary
Snapshot
- This is a 1-bed/1.0-bath single-family listed at $58k. Condition is rated poor.
Deal economics
- At list price, monthly cash flow is $143 ($2k/yr) — positive.
- The deal already cash-flows at list — no discount required.
- Meets the 1% rule at list price ($846 rent vs $58k).
- Recommended offer: $56k (3.0% below list) — sets the bar for market timing.
Location & tenants
- Location reads 64/100 on livability (#153 in WV) — a middle-class / working-renter tenant base. Strengths: cost of living A+, housing A+, crime B+; Watch: employment C-, health & safety C-, schools F.
- Tyler County Schools (rural): math 31% / reading 39% proficiency, ranked #18 of 55 in WV (top 33%) — families likely to look elsewhere, expect single-tenant / working-renter base with shorter leases.
- Market conditions: 6 active listings in the ZIP.
Forward outlook
- In year one you build about $3k of equity ($400 loan paydown + $3k appreciation (5.0% local appreciation)).
- Tyler County population projected at -23% by 2050 — secular population decline; favor cash flow + early exit over multi-decade hold.
- At projected returns (5.0% appreciation + 3.0% rent growth), your $16k cash investment doubles in ~4 years — after that, you're playing with house money.
- By year 10, paydown + projected appreciation supports a ~$33k cash-out refi (75% LTV) — recoverable capital for the next deal without selling this one.
Negotiation context
- It's been on market 51 days — a 3% lower offer ($56k) is reasonable based on typical stale-listing flexibility.
Risks & watch-outs
- Watch-outs: flood insurance adds $125/mo.
- Climate carrying-cost: in FEMA flood zone A (mandatory federal flood insurance) — expect insurance premiums to compound above CPI over the hold.
Questions for the listing agent
- It's been on market 51 days. Have you received any prior offers? Is the seller open to a 3% concession, seller financing, or rate buy-down credit?
- Have any recent inspections been done? Can we get a copy of the seller's disclosures and any deferred-maintenance estimates?
- What's the actual annual flood-insurance premium (NFIP or private), and is the property in a SFHA with mandatory coverage?
- Is there a deadline driving the sale (1031 exchange, divorce, estate, relocation)? That informs how much negotiation room exists.
- Schools are F-rated, which usually means shorter tenancies and higher turnover. Who's the typical renter profile here, and what's been the actual vacancy rate?
- What's the average days-on-market for RENTAL listings here right now (not sales)? A rising rental-DOM trend means longer vacancies and softer asking-rent achievability than the comps imply.
- What's the recent tenant-quality profile in this submarket — average credit score on applications, eviction rate, late-payment / NSF rate, and stable-employment percentage? A property-management company in the area should have these aggregated.
- How much new for-sale + rental construction is in the pipeline within 1–3 miles? Heavy new supply typically softens prices + rents 12–24 months out; constrained supply supports both.
Investment metrics
- 1% rule
- 1.46% ✓
- Cap rate
- 11.85%
- Cash-on-cash
- 19.86%
- DSCR
- 1.88
- GRM
- 5.7
CMA / ARV
No comps found within radius.
Projected returns pro-forma
4.99% appreciation · 3.0% rent growth · sell at horizon
- IRR
- 22.0%
- Equity multiple
- 2.39×
- Total profit
- $22,525
- Equity at exit
- $32,788
- IRR
- 21.6%
- Equity multiple
- 4.73×
- Total profit
- $60,409
- Equity at exit
- $56,569
Cash invested: $16,212 (down + closing). Projections, not guarantees.
Landlord ↔ Tenant lean methodology
- Overall (STATE)
- 83 Strongly Landlord-Friendly
- State West Virginia
- 83 Strongly Landlord-Friendly · R+22
- County
- — inherits STATE
- City
- — inherits STATE
ZIP-level market 26149
- Home prices YoY
- 3.2%
- Active inventory
- 6
- Price-to-rent
- 5.7×
Monthly cashflow live
- Estimated rent
- $846 medium interval (Pro) →
- Mortgage (P&I)
- −$304
- Tax est. 1.5%
- −$72 /mo · $868/yr
- Insurance
- −$24
- Flood insurance flood zone
- −$125 /mo · $1,502/yr
- HOA
- −$0
- Vacancy / Maint / Mgmt
- −$178
- Net cashflow
- $143
Break-even live
UW: 25.0% down · 7.5% · 30yr · 1.5% tax · 5.0% vac · 8.0% maint · 8.0% mgmt
Financing live
Cash to close
- Down payment
- $14,475
- Closing costs
- $1,737
- Reserves months
- —
- Total cash needed
- —
Loan-product check · same deal, 3 products live
Conventional
25% down · 7.5% · 30yr
- Down + closing
- —
- Monthly P&I
- —
- Monthly cashflow
- —
- DSCR
- —
- Eligible?
- —
Personal DTI + credit; lowest rate.
DSCR
20% down · 8.5% · 30yr
- Down + closing
- —
- Monthly P&I
- —
- Monthly cashflow
- —
- DSCR
- —
- Eligible?
- —
No personal income docs; deal must DSCR.
Hard money
10% down · 12.0% · 12mo
- Down + closing
- —
- Monthly P&I
- —
- Monthly cashflow
- —
- DSCR
- —
- Eligible?
- —
Short-term bridge; refi at stabilization.
Listing history 17 events
-
2026-06-18days on market $57,900 Active 51 DOM
-
2026-06-17days on market $57,900 Active 50 DOM
-
2026-06-16days on market $57,900 Active 49 DOM
-
2026-06-15days on market $57,900 Active 48 DOM
-
2026-06-15days on market $57,900 Active 47 DOM
-
2026-06-13days on market $57,900 Active 46 DOM
-
2026-06-12days on market $57,900 Active 45 DOM
-
2026-06-09days on market $57,900 Active 42 DOM
-
2026-06-08pricedays on market $57,900 Active 41 DOM
-
2026-06-08days on market $67,900 Active 40 DOM
-
2026-06-07days on market $67,900 Active 39 DOM
-
2026-06-04days on market $67,900 Active 37 DOM
-
2026-06-03days on market $67,900 Active 36 DOM
-
2026-06-02days on market $67,900 Active 35 DOM
-
2026-06-01days on market $67,900 Active 34 DOM
-
2026-05-31days on market $67,900 Active 33 DOM
-
2026-04-25$67,900 Active
ⓘ Source: listings_history table (triggers on properties + properties_extension) + one-shot
backfill from property_details.listing_events for pre-trigger history.
Climate risk First Street
- Flood 9/10 Extreme FEMA zone A · 99% chance over 30 yrs
- Wildfire 2/10 Low
- Heat 4/10 Moderate 7 d/yr ≥98°F today · 18 d/yr by 30 yrs out
- Wind 1/10 Low 100% chance of damaging wind over 30 yrs
- Air quality 1/10 Low 0 unhealthy d/yr today · 0 by 30 yrs out
Nearby sold comps map
Loading sold comps map…
Walkable amenities ~0.75 mi
Loading nearby amenities…
Taxation est. · year 1
- Rental income
- $10,153
- − Mortgage interest
- −$3,243
- − Property taxes
- −$868
- − Insurance
- −$1,792
- − Repairs & maintenance
- −$812
- − Management
- −$812
- − Depreciation
- −$1,684
- Taxable income
- $940
- Est. tax owed @ 24.0%
- −$226
- After-tax cash flow
- $1,491/yr
For passive investors: Depreciation is non-cash, so a rental often shows a tax loss while cash-flowing — sheltering income. Rental losses are passive: they offset passive income freely, and up to $25,000/yr can offset ordinary (W-2) income if you actively participate and your MAGI is under $100k (phasing out to $0 by $150k); unused losses carry forward. On sale, claimed depreciation is recaptured at up to 25%, and gains may owe capital-gains tax (a 1031 exchange can defer both). Figures are a year-1 estimate at your 24.0% rate — not tax advice; consult a CPA.
Condition & rehab AI · 13 photos
This property requires extensive repairs and improvements to its roof, exterior, interior, and HVAC system. Landscaping and exterior improvements would significantly increase its resale and rental value.
Repairs flagged
- Major Roof — Visible damage to the roof.
- Major Exterior siding — Peeling and in poor condition.
- Major Flooring — Old and worn.
- Major Interior walls/paint — Peeling and in poor condition.
- Major Windows — Old and in poor condition.
- Major Foundation/structure — Appears to be in poor condition.
- Major HVAC/mechanicals — Old and in poor condition.
Value-add opportunities
- Both Landscaping and exterior improvements — Improving curb appeal and increasing both resale and rental value.
- Both HVAC system replacement — Improving comfort and energy efficiency, increasing both resale and rental value.
- Both Interior wall and paint repairs — Improving the appearance of the interior, increasing both resale and rental value.
- Both Roof and exterior siding repairs — Improving the structural integrity and appearance of the home, increasing both resale and rental value.
Renovation cost estimate screening
| Repair item | Severity | Est. cost |
|---|---|---|
| Roof · Visible damage to the roof. | Major | $15,000–50,000 |
| Exterior siding · Peeling and in poor condition. | Major | $15,000–50,000 |
| Flooring · Old and worn. | Major | $15,000–50,000 |
| Interior walls/paint · Peeling and in poor condition. | Major | $15,000–50,000 |
| Windows · Old and in poor condition. | Major | $15,000–50,000 |
| Foundation/structure · Appears to be in poor condition. | Major | $15,000–50,000 |
| HVAC/mechanicals · Old and in poor condition. | Major | $15,000–50,000 |
| Total estimated repair cost · 7 items | $105,000–350,000 |
Value-add ROI direction
- Both Landscaping and exterior improvements — Improving curb appeal and increasing both resale and rental value. ↑
- Both HVAC system replacement — Improving comfort and energy efficiency, increasing both resale and rental value. ↑
- Both Interior wall and paint repairs — Improving the appearance of the interior, increasing both resale and rental value. ↑
- Both Roof and exterior siding repairs — Improving the structural integrity and appearance of the home, increasing both resale and rental value. ↑
ⓘ Cost ranges are severity-bucket heuristics (US national rule-of-thumb). Get contractor quotes + a written scope before underwriting a rehab budget.
Schools (NCES district)
- District
- Tyler County Schools
- NCES district ID
- 5401440
- Math proficiency
- 31% ▼ -11.00%
- Reading proficiency
- 39% ▼ -8.00%
- Median HH income
- $37,906
- Composite
- 29.17/100
- National rank
- #6576
- State rank
- #18 of 55 in WV
Livability — Middlebourne
- Score
- 64/100
- State rank
- #153
- US rank
- #14794
Category grades
Schools grade is shown separately in the Schools card above.
Census & demographics
- Population (ZIP)
- 2,330
Population outlook (Tyler County) Hauer SSP2
- Today (2025)
- 8,409 people
- By 2030
- 8,035 · -4.4%
- By 2040
- 7,233 · -14.0%
- By 2050
- 6,460 · -23.2%
- By 2075
- 4,823 · -42.6%
- By 2100
- 3,342 · -60.3%
Race, ethnicity, and origin ACS 2023
- Neighborhood character
- Predominantly White (97%)
- Race & ethnicity
- White 97% Two or more races 3%
- Common ancestry
- Italian 2% Slovak 2% Serbian 1%
- Foreign-born
- 0%
- Languages at home
- 99% English-only · Spanish 1%
Political lean MEDSL · Tyler
- 2024 margin
- Solid R (+67.4) · D 15.3% · R 82.7% · Other 2.0%
- 2008→2024 swing
- -36.0pp toward R · 2008: -31.4pp · 2024: -67.4pp
- All cycles
- 2024: R+67.4 2020: R+66.2 2016: R+68.0 2012: R+43.5 2008: R+31.4
Not yet ingested
- Civics
- —
Market trends
- HPI YoY
- ▲ 4.99%
- Current HPI
- 160.8357
- Rent YoY
- —
- Metro
- —
- State GDP YoY
- —
- F500 in state
- 0
Price history
1 event — show timeline
- 2026-04-25 Listed $67,900 WBOR
Cash-flow waterfall
monthlySold comps — $/sqft
last 12 mo · ≤1 miLoading sold comps…