2047 Martin Luther King Jr. Hwy · Kingstree, SC
Flood risk No data
- FEMA flood zone
- —
- Chance of flooding over 30 yrs
- —
- Est. flood insurance / yr
- —
Fire risk No data
- Est. fire insurance / yr
- —
Heat risk No data
- Hot days now (above threshold)
- —
- Hot days in 30 yrs
- —
Wind risk No data
- Chance of severe wind over 30 yrs
- —
Air-quality risk No data
- Unhealthy air days now
- —
- Unhealthy air days in 30 yrs
- —
Risk factors via First Street. Map © Google.
Why this score? — see what drove the B- grade
The composite is a weighted blend of 9 inputs, each scored 0–100. Each bar is that input's sub-score; the figure is the points it added to the 100-point composite (weight × sub-score).
- Cash flow +30.0/30.0
- 1% rule +10.0/10.0
- DSCR +10.0/10.0
- ARV discount +7.5/15.0
- Livability +3.4/5.0
- Rent growth +2.5/5.0
- Condition / age +2.5/5.0
- Schools +1.5/10.0
- Appreciation +0.0/10.0
$25,000
🖨 Deal sheet (PDF) 📄 Offer letter ✓ Due diligence
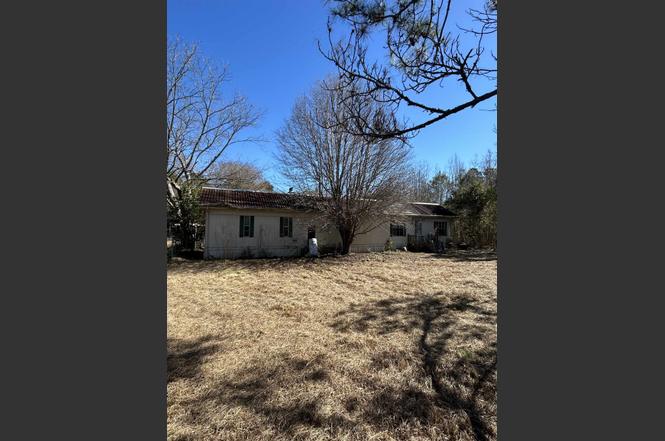
Listing remarks
Mobile home just outside the town of Kingstree SC. This property boats generous land with a mix of open yard space and a few mature trees, providing privacy and shade. A chain link fenced area offers potential for pets, a garden, or a play space. Road frontage ensures easy access while maintaining that tucked away rural feel
Key facts
- Easy access
- Rural feel
- Generous land
Tags
Property features AI
Finance
- Other: Offered for sale
- HOA & community: Monthly association fee
Exterior
- Parking: Driveway; Parking for 4 vehicles
- Home design: Single-wide mobile home; Resale property
- Exterior features: Small lot (approximately 0.02 acre); Lot information from public records; Zoning: none
Interior
- Bathrooms: 2 full bathrooms
- Interior features: Unfurnished
Neighborhood map
What this means for you Summary
Snapshot
- This is a 3-bed/2.0-bath manufactured listed at $25k.
Deal economics
- At list price, monthly cash flow is $559 ($7k/yr) — positive.
- The deal already cash-flows at list — no discount required.
- Meets the 1% rule at list price ($915 rent vs $25k).
- Recommended offer: $23k (9.0% below list) — sets the bar for market timing.
- Cap rate 33.1% vs local median 5.5% in Kingstree — top-decile yield for the area; either an underpriced asset or a hidden risk that comps aren't pricing in. Stress-test before assuming the spread holds.
Location & tenants
- Location reads 67/100 on livability (#88 in SC) — a middle-class / working-renter tenant base. Strengths: cost of living A+, health & safety A+, commute B+; Watch: housing C-, employment D, schools D-.
- Williamsburg 01 (rural): math 13% / reading 26% proficiency, ranked #74 of 80 in SC (top 92%) — low school quality limits family demand, transient renter base, plan for 1-2y turnover; 88% free/reduced lunch — lower-income household profile, screen leases tightly.
- Market conditions: 60 active listings in the ZIP; 35 units permitted in Williamsburg County in 2024 (0 in 5+ unit buildings).
Forward outlook
- Local home prices are declining (-3.0%/yr); year-one equity from $173 of loan paydown is wiped out by about $750 of value loss. Plan a longer hold.
- Williamsburg County population projected at -32% by 2050 — secular population decline; favor cash flow + early exit over multi-decade hold.
- At projected returns (-3.0% appreciation + 3.0% rent growth), your $7k cash investment doubles in ~2 years — after that, you're playing with house money.
Negotiation context
- It's been on market 113 days — a 9% lower offer ($23k) is reasonable based on typical stale-listing flexibility.
Questions for the listing agent
- It's been on market 113 days. Have you received any prior offers? Is the seller open to a 9% concession, seller financing, or rate buy-down credit?
- Why hasn't it sold? Are there any deal-killer items the seller is aware of (foundation, flood, title, zoning, code violations)?
- Is there a deadline driving the sale (1031 exchange, divorce, estate, relocation)? That informs how much negotiation room exists.
- Schools are D-rated, which usually means shorter tenancies and higher turnover. Who's the typical renter profile here, and what's been the actual vacancy rate?
- Crime grade is F in this area — have there been break-ins, vandalism, or insurance claims at this property in the last 3 years? What carrier currently insures it and at what premium?
- What's the average days-on-market for RENTAL listings here right now (not sales)? A rising rental-DOM trend means longer vacancies and softer asking-rent achievability than the comps imply.
- What's the recent tenant-quality profile in this submarket — average credit score on applications, eviction rate, late-payment / NSF rate, and stable-employment percentage? A property-management company in the area should have these aggregated.
- How much new for-sale + rental construction is in the pipeline within 1–3 miles? Heavy new supply typically softens prices + rents 12–24 months out; constrained supply supports both.
Investment metrics
- 1% rule
- 3.66% ✓
- Cap rate
- 33.10%
- Cash-on-cash
- 95.75%
- DSCR
- 5.26
- GRM
- 2.3
CMA / ARV
No comps found within radius.
Projected returns pro-forma
-3.0% appreciation · 3.0% rent growth · sell at horizon
- IRR
- 96.7%
- Equity multiple
- 5.50×
- Total profit
- $31,532
- Equity at exit
- $3,728
- IRR
- 99.3%
- Equity multiple
- 11.47×
- Total profit
- $73,302
- Equity at exit
- $2,162
Cash invested: $7,000 (down + closing). Projections, not guarantees.
Landlord ↔ Tenant lean methodology
- Overall (STATE)
- 90 Strongly Landlord-Friendly
- State South Carolina
- 90 Strongly Landlord-Friendly · R+6
- County
- — inherits STATE
- City
- — inherits STATE
ZIP-level market 29556
- Home prices YoY
- -6.5%
- Active inventory
- 60
- Price-to-rent
- 2.3×
Monthly cashflow live
- Estimated rent
- $915 medium interval (Pro) →
- Mortgage (P&I)
- −$131
- Tax from tax record
- −$23 /mo · $276/yr
- Insurance
- −$10
- HOA
- −$0
- Vacancy / Maint / Mgmt
- −$192
- Net cashflow
- $559
Break-even live
Sensitivity live
| Price | -10% $573 | -5% $566 | +0% $559 | +5% $551 | +10% $544 |
|---|---|---|---|---|---|
| Rent | -10% $486 | -5% $522 | +0% $559 | +5% $595 | +10% $631 |
| Rate | -1.0pp $571 | -0.5pp $565 | base $559 | +0.5pp $552 | +1.0pp $545 |
UW: 25.0% down · 7.5% · 30yr · 1.5% tax · 5.0% vac · 8.0% maint · 8.0% mgmt
Financing live
Cash to close
- Down payment
- $6,250
- Closing costs
- $750
- Reserves months
- —
- Total cash needed
- —
Loan-product check · same deal, 3 products live
Conventional
25% down · 7.5% · 30yr
- Down + closing
- —
- Monthly P&I
- —
- Monthly cashflow
- —
- DSCR
- —
- Eligible?
- —
Personal DTI + credit; lowest rate.
DSCR
20% down · 8.5% · 30yr
- Down + closing
- —
- Monthly P&I
- —
- Monthly cashflow
- —
- DSCR
- —
- Eligible?
- —
No personal income docs; deal must DSCR.
Hard money
10% down · 12.0% · 12mo
- Down + closing
- —
- Monthly P&I
- —
- Monthly cashflow
- —
- DSCR
- —
- Eligible?
- —
Short-term bridge; refi at stabilization.
Listing history 6 events
-
2026-06-07statusdays on market $25,000 Pending 113 DOM
-
2026-06-04statusdays on market $25,000 Active Under Contract 111 DOM
-
2026-06-02days on market $25,000 Active 110 DOM
-
2026-06-01days on market $25,000 Active 109 DOM
-
2026-05-31days on market $25,000 Active 108 DOM
-
2026-02-04$25,000 Active
ⓘ Source: listings_history table (triggers on properties + properties_extension) + one-shot
backfill from property_details.listing_events for pre-trigger history.
Tax reassessment forecast SC · Resets to sale price
- Current annual tax
- $276 · $23/mo
- Projected year-2 tax
- $276 · $23/mo
- Expected delta
- $0/yr ($0/mo · 0.0%)
ⓘ Screening estimate from a state-policy table — verify with the county assessor before closing.
Nearby sold comps map
Loading sold comps map…
Walkable amenities ~0.75 mi
Loading nearby amenities…
Taxation est. · year 1
- Rental income
- $10,984
- − Mortgage interest
- −$1,400
- − Property taxes
- −$276
- − Insurance
- −$125
- − Repairs & maintenance
- −$879
- − Management
- −$879
- − Depreciation
- −$727
- Taxable income
- $6,697
- Est. tax owed @ 24.0%
- −$1,607
- After-tax cash flow
- $5,095/yr
For passive investors: Depreciation is non-cash, so a rental often shows a tax loss while cash-flowing — sheltering income. Rental losses are passive: they offset passive income freely, and up to $25,000/yr can offset ordinary (W-2) income if you actively participate and your MAGI is under $100k (phasing out to $0 by $150k); unused losses carry forward. On sale, claimed depreciation is recaptured at up to 25%, and gains may owe capital-gains tax (a 1031 exchange can defer both). Figures are a year-1 estimate at your 24.0% rate — not tax advice; consult a CPA.
Schools (NCES district)
- District
- Williamsburg 01
- NCES district ID
- 4503780
- Math proficiency
- 13% ▼ -11.00%
- Reading proficiency
- 26% ▼ -4.00%
- Median HH income
- $27,663
- Composite
- 15.32/100
- National rank
- #9328
- State rank
- #74 of 80 in SC
Livability — Kingstree
- Score
- 67/100
- State rank
- #88
- US rank
- #10168
Category grades
Schools grade is shown separately in the Schools card above.
Census & demographics
- Population (ZIP)
- 11,133
Population outlook (Williamsburg County) Hauer SSP2
- Today (2025)
- 29,171 people
- By 2030
- 27,247 · -6.6%
- By 2040
- 23,314 · -20.1%
- By 2050
- 19,798 · -32.1%
- By 2075
- 13,336 · -54.3%
- By 2100
- 8,502 · -70.9%
Race, ethnicity, and origin ACS 2023
- Neighborhood character
- Predominantly Black (71%)
- Race & ethnicity
- Black 71% White 27%
- Common ancestry
- Serbian 3% Lithuanian 1% Slovak 1%
- Foreign-born
- 1% · Canada
- Languages at home
- 99% English-only · Tagalog/Filipino 1%
Political lean MEDSL · Williamsburg
- 2024 margin
- Strong D (+21.7) · D 60.2% · R 38.5% · Other 1.2%
- 2008→2024 swing
- -16.5pp toward R · 2008: 38.2pp · 2024: 21.7pp
- All cycles
- 2024: D+21.7 2020: D+29.8 2016: D+33.8 2012: D+39.9 2008: D+38.2
Not yet ingested
- Civics
- —
Market trends
- HPI YoY
- ▼ -10.24%
- Current HPI
- 147.7604
- Rent YoY
- —
- Metro
- —
- State GDP YoY
- ▲ 4.51%
- F500 in state
- 2
Industry mix (Fortune 500 HQ in SC)
| Industry | F500 HQs | Revenue |
|---|---|---|
| Packaging | 1 | $7B |
|
||
Price history
1 event — show timeline
- 2026-02-04 Listed $25,000 CCAR
Property tax history
-1.3%/yrLatest (2025): $276 · +1.8% YoY. Source: county tax records.
Cash-flow waterfall
monthlySold comps — $/sqft
last 12 mo · ≤1 miLoading sold comps…