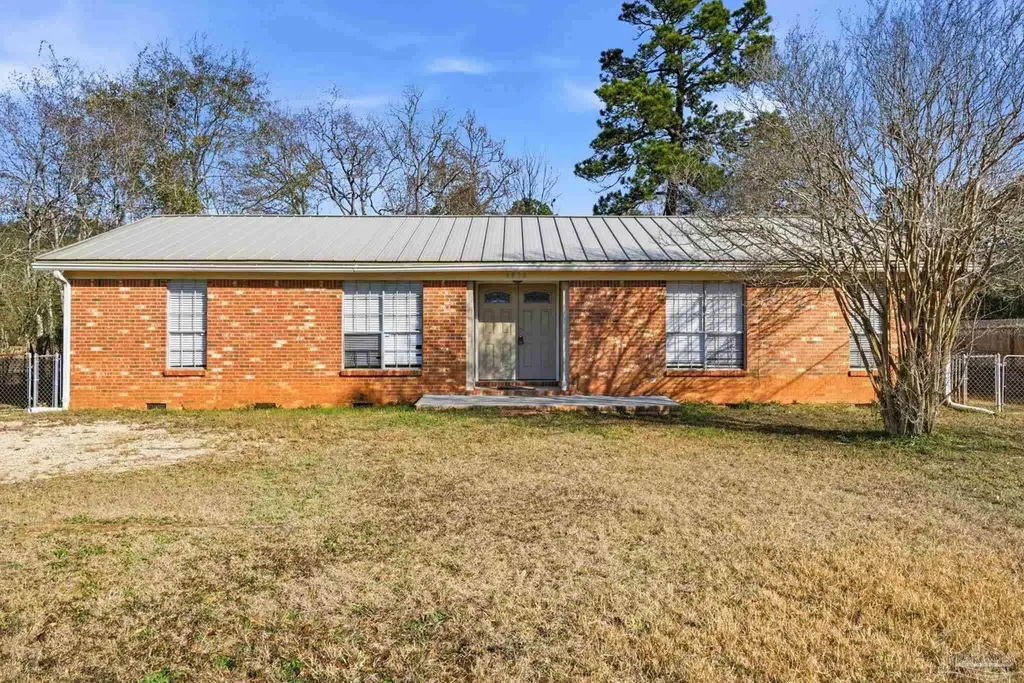
6430 W 9 Mile Rd · Gonzalez, FL
Flood risk 5/10 · Moderate
- FEMA flood zone
- X (unshaded)
- Chance of flooding over 30 yrs
- 0.66%
- Est. flood insurance / yr
- $507 – $1,088
Fire risk 5/10 · Moderate
- Est. fire insurance / yr
- $947 – $1,759
Heat risk 10/10 · Severe
- Hot days now (above 106°F)
- 7 days/yr
- Hot days in 30 yrs
- 23 days/yr
Wind risk 9/10 · Severe
- Chance of severe wind over 30 yrs
- 99.0%
Air-quality risk 1/10 · Minimal
- Unhealthy air days now
- 0 days/yr
- Unhealthy air days in 30 yrs
- 0 days/yr
Risk factors via First Street. Map © Google.
Why this score? — see what drove the D grade
The composite is a weighted blend of 9 inputs, each scored 0–100. Each bar is that input's sub-score; the figure is the points it added to the 100-point composite (weight × sub-score).
- Cash flow +13.1/30.0
- ARV discount +9.5/15.0
- DSCR +3.9/10.0
- Rent growth +3.6/5.0
- Schools +3.6/10.0
- Livability +3.6/5.0
- 1% rule +3.1/10.0
- Condition / age +2.5/5.0
- Appreciation +0.0/10.0
$300,000
🖨 Deal sheet (PDF) 📄 Offer letter ✓ Due diligence
Listing remarks MLS
Sturdy home on more than two acres! With a metal roof (2019), all brick siding, new LVP floors throughout the house, new septic tank and drain lines (2017), and a transferable termite bond, this property has great bones and would be a perfect starter home or investment property. Enjoy ample room to spread out, with a large storage shed/workshop complete with electricity and a fully fenced back yard. Located on 9 Mile Rd close to the Navy Fed campus, enjoy proximity to the amenities & shopping of the 9 Mile corridor as well as easy access to I-10 *** Please verify all features, dimensions, etc that may be important to you
Key facts
- Brick siding
- Metal roof
- New lvp floors
Tags
Neighborhood map
What this means for you Summary
Snapshot
- This is a 4-bed/2.0-bath single-family listed at $300k.
Deal economics
- At list price, monthly cash flow is $-13 ($-160/yr) — negative.
- To cash-flow at today's rent, offer at most $298k (0.8% below list).
- To meet the 1% rule (rent ≥ 1% of price), the offer needs to be $244k (18.6% below list).
- Recommended offer: $244k (18.6% below list) — sets the bar for 1% rule.
- Cap rate 6.2% vs local median 4.2% in Gonzalez — top-decile yield for the area; either an underpriced asset or a hidden risk that comps aren't pricing in. Stress-test before assuming the spread holds.
Location & tenants
- Location reads 71/100 on livability (#385 in FL) — a middle-class / working-renter tenant base. Strengths: cost of living A+, housing A+, employment A; Watch: amenities F, commute F, health & safety F.
- Escambia (suburban): math 40% / reading 45% proficiency, ranked #56 of 73 in FL (top 77%) — families likely to look elsewhere, expect single-tenant / working-renter base with shorter leases.
- Zoned schools: Beulah Elementary School (math 53% / reading 57%, grade C, #872 of 2,144 statewide, top 42%, 946 students, 57% FRL); Ransom Middle School (math 54% / reading 52%, grade C+, #209 of 571 statewide, top 37%, 1,224 students, 49% FRL); J. M. Tate Senior High School (math 42% / reading 52%, grade D-, #207 of 667 statewide, top 32%, 2,110 students, 44% FRL).
- Market conditions: Rents rising fast (+4.4%/yr); 421 active listings in the ZIP; 8 comparable units currently listed for rent nearby; rentals at typical pace (median 16d on market — plan ~3-4 weeks tenant-placement turnaround); solid renter incomes; 1,479 units permitted in Escambia County in 2024 (0 in 5+ unit buildings).
- This rent runs 39% of the median local income ($75k/yr) — at the standard rent-burdened threshold; future hikes will face affordability resistance.
Forward outlook
- Local home prices are declining (-3.0%/yr); year-one equity from $2k of loan paydown is wiped out by about $9k of value loss. Plan a longer hold.
- Escambia County population projected at +13% by 2050 — modest demand growth; plan on rents tracking national, not racing it.
Negotiation context
- It's been on market 131 days — a 12% lower offer ($264k) is reasonable based on typical stale-listing flexibility.
- Current owner paid $33k; list at $300k implies a 809% gain — meaningful room to come down on a strong offer.
Risks & watch-outs
- Climate carrying-cost: moderate flood risk; severe wind risk, 99% chance of damaging wind over 30y; moderate wildfire risk; extreme-heat days projected 7→23/yr by 2055 (HVAC capex compounding) — expect insurance premiums to compound above CPI over the hold.
Questions for the listing agent
- What do current leases actually rent for vs. the listed asking? Can we see a recent rent roll and the last 12 months of T-12 income?
- It's been on market 131 days. Have you received any prior offers? Is the seller open to a 19% concession, seller financing, or rate buy-down credit?
- Built in 1975 — when were the roof, HVAC, electrical panel, plumbing, and water heater last replaced?
- Why hasn't it sold? Are there any deal-killer items the seller is aware of (foundation, flood, title, zoning, code violations)?
- Is there a deadline driving the sale (1031 exchange, divorce, estate, relocation)? That informs how much negotiation room exists.
- The area grade is low — what's the realistic commute time and amenity access for the typical tenant pool here? Any planned neighborhood developments (good or bad) we should know about?
- What's the average days-on-market for RENTAL listings here right now (not sales)? A rising rental-DOM trend means longer vacancies and softer asking-rent achievability than the comps imply.
- What's the recent tenant-quality profile in this submarket — average credit score on applications, eviction rate, late-payment / NSF rate, and stable-employment percentage? A property-management company in the area should have these aggregated.
- How much new for-sale + rental construction is in the pipeline within 1–3 miles? Heavy new supply typically softens prices + rents 12–24 months out; constrained supply supports both.
Investment metrics
- 1% rule
- 0.81% ✗
- Cap rate
- 6.24%
- Cash-on-cash
- -0.19%
- DSCR
- 0.99
- GRM
- 10.2
CMA / ARV
- ARV (median comp)
- $313,905
- List price
- $300,000
- Delta
- -4.43%
- Verdict
- FAIR
- Comps
- 20 within 1.0 mi
Show comp detail 12 sales within ~0.75 mi
| Address | Dist | Beds/Ba | Sqft | Sold | Price | $/sf | Match |
|---|---|---|---|---|---|---|---|
| 9824 Betula Rd | 0.30mi | 4/2.0 | 1,812 (+11%) | 2mo | $425,000 | $235 | 65 |
| 9528 Crimson Pointe Cir | 0.70mi | 3/2.0 (-1) | 1,618 (-1%) | 6mo | $295,000 | $182 | 57 |
| 9699 Angel Oak Dr | 0.48mi | 3/2.0 (-1) | 1,486 (-9%) | 2mo | $288,900 | $194 | 56 |
| 9511 Crimson Pointe Cir | 0.73mi | 3/2.0 (-1) | 1,624 (-0%) | 6mo | $312,000 | $192 | 56 |
| 6654 Sun Tree Cir | 0.67mi | 3/2.0 (-1) | 1,707 (+5%) | 1mo | $309,000 | $181 | 55 |
| 9544 Tower Ridge Rd | 0.53mi | 3/2.0 (-1) | 1,748 (+7%) | 5mo | $325,000 | $186 | 54 |
| 9691 Angel Oak Dr | 0.49mi | 3/2.0 (-1) | 1,486 (-9%) | 7mo | $289,900 | $195 | 51 |
| 9628 Sagewood Dr | 0.57mi | 4/2.0 | 1,815 (+11%) | 7mo | $339,900 | $187 | 48 |
| 6510 Suwanee Rd | 0.57mi | 3/2.0 (-1) | 1,823 (+12%) | 1mo | $345,000 | $189 | 48 |
| 9748 Millee Loop | 0.64mi | 4/2.0 | 1,830 (+12%) | 5mo | $350,000 | $191 | 45 |
| 9953 Suwanee Ln | 0.59mi | 3/2.0 (-1) | 1,823 (+12%) | 4mo | $320,000 | $176 | 44 |
| 6879 Fort Deposit Dr | 0.63mi | 4/2.0 | 1,860 (+14%) | 9mo | $335,000 | $180 | 39 |
Match score weights: distance 35% · size 25% · config 20% · recency 20%. Top-matched comps best support the ARV.
Projected returns pro-forma
-3.0% appreciation · 4.42% rent growth · sell at horizon
- IRR
- -15.2%
- Equity multiple
- 0.45×
- Total profit
- $-45,968
- Equity at exit
- $44,731
- IRR
- -4.5%
- Equity multiple
- 0.69×
- Total profit
- $-26,354
- Equity at exit
- $25,939
Cash invested: $84,000 (down + closing). Projections, not guarantees.
Landlord ↔ Tenant lean methodology
- Overall (STATE)
- 87 Strongly Landlord-Friendly
- State Florida
- 87 Strongly Landlord-Friendly · R+3
- County
- — inherits STATE
- City
- — inherits STATE
ZIP-level market 32526
- Home prices YoY
- -28.3%
- Rents YoY
- 4.4%
- Active inventory
- 421
- Price-to-rent
- 10.2×
Monthly cashflow live
- Estimated rent
- $2,442 high interval (Pro) →
- Mortgage (P&I)
- −$1,573
- Tax from tax record
- −$244 /mo · $2,930/yr
- Insurance
- −$125
- HOA
- −$0
- Vacancy / Maint / Mgmt
- −$513
- Net cashflow
- $-13
Break-even live
Sensitivity live
| Price | -10% $156 | -5% $72 | +0% $-13 | +5% $-98 | +10% $-183 |
|---|---|---|---|---|---|
| Rent | -10% $-206 | -5% $-110 | +0% $-13 | +5% $83 | +10% $180 |
| Rate | -1.0pp $138 | -0.5pp $63 | base $-13 | +0.5pp $-91 | +1.0pp $-170 |
UW: 25.0% down · 7.5% · 30yr · 1.5% tax · 5.0% vac · 8.0% maint · 8.0% mgmt
Financing live
Cash to close
- Down payment
- $75,000
- Closing costs
- $9,000
- Reserves months
- —
- Total cash needed
- —
Loan-product check · same deal, 3 products live
Conventional
25% down · 7.5% · 30yr
- Down + closing
- —
- Monthly P&I
- —
- Monthly cashflow
- —
- DSCR
- —
- Eligible?
- —
Personal DTI + credit; lowest rate.
DSCR
20% down · 8.5% · 30yr
- Down + closing
- —
- Monthly P&I
- —
- Monthly cashflow
- —
- DSCR
- —
- Eligible?
- —
No personal income docs; deal must DSCR.
Hard money
10% down · 12.0% · 12mo
- Down + closing
- —
- Monthly P&I
- —
- Monthly cashflow
- —
- DSCR
- —
- Eligible?
- —
Short-term bridge; refi at stabilization.
Rent comps 8 comps
| Address | Beds | Baths | Sqft | Rent | $/sqft | DOM | Units | Dist |
|---|---|---|---|---|---|---|---|---|
| 9470 Lutoo Ln Pensacola, FL | 4.0 | 2.0 | 1774 | $2,300 | $1.30 | 25d | 1 | 0.17mi |
| 7068 Whitetail Run Dr Pensacola, FL | 4.0 | 2.0 | 1815 | $2,300 | $1.27 | 15d | 1 | 0.58mi |
| 9845 Beulah Rd Pensacola, FL | 4.0 | 2.5 | 2016 | $2,000 | $0.99 | 15d | 1 | 0.84mi |
| 6297 Sonoma Ln Pensacola, FL | 4.0 | 2.5 | 2033 | $2,350 | $1.16 | 15d | 1 | 0.84mi |
| 4041 Whitetail Ln Pensacola, FL | 4.0 | 2.0 | 1787 | $2,020 | $1.13 | 25d | 1 | 1.23mi |
| 5251 W Nine Mile Rd Pensacola, FL | 1.0–3.0 | 1.0–2.0 | 1029 | $2,494 | $2.42 | 15d | 45 | 1.40mi |
| 10921 Blacktail Loop Pensacola, FL | 4.0 | 2.0 | 1787 | $2,350 | $1.32 | 23d | 1 | 1.45mi |
| 5943 Ravines Ln Pensacola, FL | 3.0–5.0 | 2.0–3.0 | 2080 | $2,422 | $1.16 | 15d | 9 | 1.49mi |
Listing history 17 events
-
2026-06-21days on market $300,000 Active 131 DOM
-
2026-06-18days on market $300,000 Active 128 DOM
-
2026-06-17days on market $300,000 Active 127 DOM
-
2026-06-16days on market $300,000 Active 126 DOM
-
2026-06-15days on market $300,000 Active 125 DOM
-
2026-06-14days on market $300,000 Active 123 DOM
-
2026-06-10days on market $300,000 Active 120 DOM
-
2026-06-09days on market $300,000 Active 119 DOM
-
2026-06-08days on market $300,000 Active 118 DOM
-
2026-06-07days on market $300,000 Active 117 DOM
-
2026-06-03days on market $300,000 Active 113 DOM
-
2026-06-02days on market $300,000 Active 112 DOM
-
2026-06-01days on market $300,000 Active 111 DOM
-
2026-05-31days on market $300,000 Active 110 DOM
-
2026-05-31days on market $300,000 Active 109 DOM
-
2026-02-10$300,000 Active 632-char remark
Show marketing remark (632 chars)
Sturdy home on more than two acres! With a metal roof (2019), all brick siding, new LVP floors throughout the house, new septic tank and drain lines (2017), and a transferable termite bond, this property has great bones and would be a perfect starter home or investment property. Enjoy ample room to spread out, with a large storage shed/workshop complete with electricity and a fully fenced back yard. Located on 9 Mile Rd close to the Navy Fed campus, enjoy proximity to the amenities & shopping of the 9 Mile corridor as well as easy access to I-10 *** Please verify all features, dimensions, etc that may be important to you
-
1985-03-01soldstatus $33,000
ⓘ Source: listings_history table (triggers on properties + properties_extension) + one-shot
backfill from property_details.listing_events for pre-trigger history.
Tax reassessment forecast FL · Resets to sale price
- Current annual tax
- $2,930 · $244/mo
- Projected year-2 tax
- $2,930 · $244/mo
- Expected delta
- $0/yr ($0/mo · 0.0%)
ⓘ Screening estimate from a state-policy table — verify with the county assessor before closing.
Climate risk First Street
- Flood 5/10 Major FEMA zone X (unshaded) · 66% chance over 30 yrs
- Wildfire 5/10 Major
- Heat 10/10 Extreme 7 d/yr ≥106°F today · 23 d/yr by 30 yrs out
- Wind 9/10 Extreme 99% chance of damaging wind over 30 yrs
- Air quality 1/10 Low 0 unhealthy d/yr today · 0 by 30 yrs out
Nearby sold comps map
Loading sold comps map…
Walkable amenities ~0.75 mi
Loading nearby amenities…
Taxation est. · year 1
- Rental income
- $29,302
- − Mortgage interest
- −$16,805
- − Property taxes
- −$2,930
- − Insurance
- −$1,500
- − Repairs & maintenance
- −$2,344
- − Management
- −$2,344
- − Depreciation
- −$8,727
- Taxable loss
- −$5,348
- Est. tax savings @ 24.0%
- +$1,284
- After-tax cash flow
- $1,124/yr
For passive investors: Depreciation is non-cash, so a rental often shows a tax loss while cash-flowing — sheltering income. Rental losses are passive: they offset passive income freely, and up to $25,000/yr can offset ordinary (W-2) income if you actively participate and your MAGI is under $100k (phasing out to $0 by $150k); unused losses carry forward. On sale, claimed depreciation is recaptured at up to 25%, and gains may owe capital-gains tax (a 1031 exchange can defer both). Figures are a year-1 estimate at your 24.0% rate — not tax advice; consult a CPA.
Schools (NCES district)
- District
- Escambia
- NCES district ID
- 1200510
- Math proficiency
- 40% ▼ -9.00%
- Reading proficiency
- 45% ▼ -4.00%
- Median HH income
- $44,649
- Composite
- 36.04/100
- National rank
- #4773
- State rank
- #56 of 73 in FL
Livability — Gonzalez
- Score
- 71/100
- State rank
- #385
- US rank
- #6813
Category grades
Schools grade is shown separately in the Schools card above.
Census & demographics
- County
- Escambia County · 301,722 people
- Metro
- Pensacola-Ferry Pass-Brent, FL
- Population (ZIP)
- 44,680
- Household income
- $75,098
- Rent vs Own
- Severe rent burden
- 1166.0
Population outlook (Escambia County) Hauer SSP2
- Today (2025)
- 334,637 people
- By 2030
- 345,779 · +3.3%
- By 2040
- 364,828 · +9.0%
- By 2050
- 378,514 · +13.1%
- By 2075
- 403,220 · +20.5%
- By 2100
- 386,125 · +15.4%
Race, ethnicity, and origin ACS 2023
- Neighborhood character
- Predominantly White (66%)
- Race & ethnicity
- White 66% Black 19% Two or more races 8% Hispanic / Latino 5% Asian 3%
- Common ancestry
- Lithuanian 2% Slovak 2% Serbian 2%
- Foreign-born
- 5% · Canada, China
- Languages at home
- 94% English-only · Spanish 2% Tagalog/Filipino 1% Other Indo-European 1%
Political lean MEDSL · Escambia
- 2024 margin
- R (+19.5) · D 39.7% · R 59.2% · Other 1.1%
- 2008→2024 swing
- -0.2pp no change · 2008: -19.3pp · 2024: -19.5pp
- All cycles
- 2024: R+19.5 2020: R+15.1 2016: R+20.6 2012: R+20.6 2008: R+19.3
Not yet ingested
- Civics
- —
Market trends
- HPI YoY
- ▼ -99.68%
- Current HPI
- 252.6406
- Rent YoY
- ▲ 4.42%
- Metro
- Pensacola-Ferry Pass-Brent, FL
- State GDP YoY
- ▲ 3.28%
- F500 in state
- 36
Industry mix (Fortune 500 HQ in FL)
| Industry | F500 HQs | Revenue |
|---|---|---|
| Industrial Technology | 2 | $29B |
|
||
| Insurance | 2 | $17B |
|
||
| Retail | 1 | $60B |
|
||
| Technology Distribution | 1 | $58B |
|
||
| Homebuilding | 1 | $35B |
|
||
| Technology Manufacturing | 1 | $35B |
|
||
Price history
+809.1% since first listed2 events — show timeline
- 2026-02-10 Listed $300,000 PARMLS
- 1985-03-01 Sold (Public Records) $33,000 Public Records
Property tax history
+7.0%/yrLatest (2025): $2,930 · +16.0% YoY. Source: county tax records.
Cash-flow waterfall
monthlySold comps — $/sqft
last 12 mo · ≤1 miLoading sold comps…