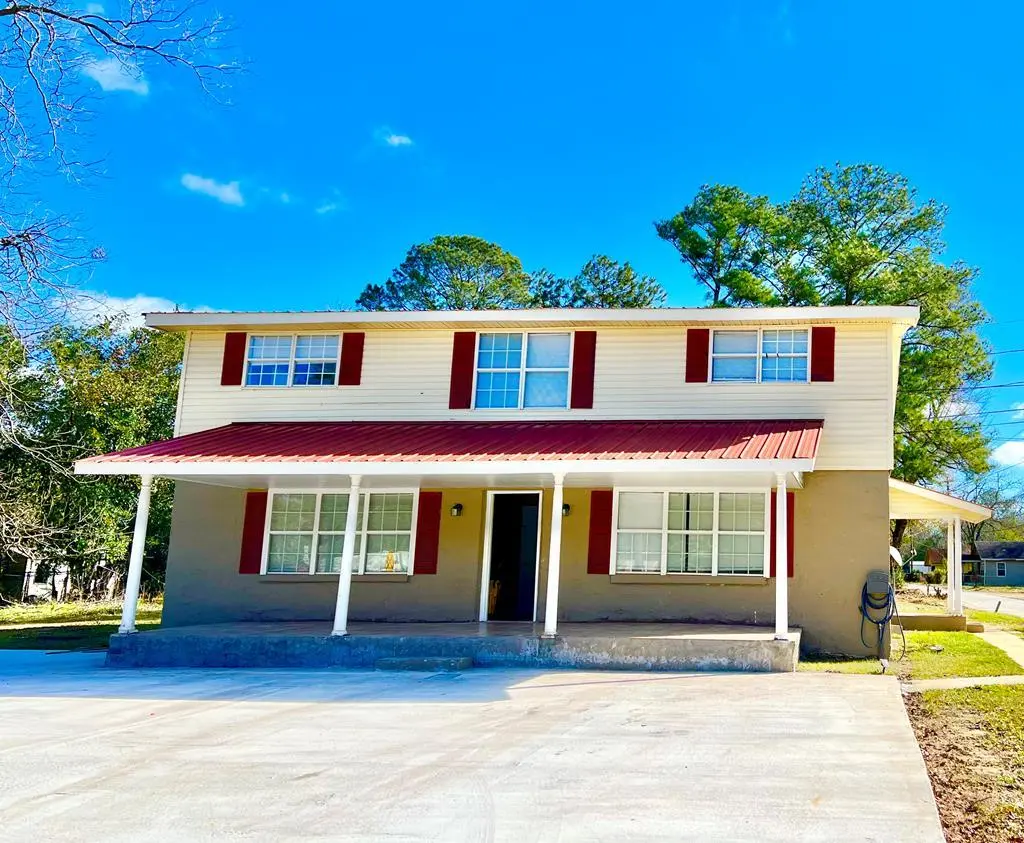
2729 Central Ave · Unionville, GA
Flood risk 1/10 · Minimal
- FEMA flood zone
- X (unshaded)
- Chance of flooding over 30 yrs
- 0.0%
- Est. flood insurance / yr
- $507 – $1,088
Fire risk 3/10 · Minor
- Est. fire insurance / yr
- $963 – $1,789
Heat risk 7/10 · Major
- Hot days now (above 108°F)
- 7 days/yr
- Hot days in 30 yrs
- 19 days/yr
Wind risk 8/10 · Major
- Chance of severe wind over 30 yrs
- 99.0%
Air-quality risk 4/10 · Minor
- Unhealthy air days now
- 4 days/yr
- Unhealthy air days in 30 yrs
- 6 days/yr
Risk factors via First Street. Map © Google.
Why this score? — see what drove the D+ grade
The composite is a weighted blend of 9 inputs, each scored 0–100. Each bar is that input's sub-score; the figure is the points it added to the 100-point composite (weight × sub-score).
- Cash flow +19.9/30.0
- ARV discount +7.5/15.0
- DSCR +6.3/10.0
- 1% rule +4.8/10.0
- Livability +3.2/5.0
- Rent growth +2.5/5.0
- Schools +2.5/10.0
- Condition / age +2.5/5.0
- Appreciation +0.0/10.0
$165,000
🖨 Deal sheet (PDF) 📄 Offer letter ✓ Due diligence
Listing remarks
This stunning two-story home has undergone recent renovations and is ready for you to move in! Boasting over 2,300 square feet of spacious living, this property offers ample room to create your dream environment. The large front parking area ensures plenty of space for vehicles and guests alike. The renovations include beautifully updated bathrooms and bedrooms, along with freshly painted walls that add a modern touch. Plus, both upstairs and downstairs HVAC units have been recently replaced, ensuring comfort throughout the home.
Key facts
- 4,791 sq ft lot
- 3 garage spots
- Pool
Property features AI
Finance
- Other: Private pool
Exterior
- Parking: 3-car garage; Open parking; Concrete parking surface
- Utilities: Cable available; Sewer connected; Water connected
- Home design: Single-family residence; Two levels / 2-story
- Construction: Stucco construction; Metal roof; Slab foundation; Built recently (property data current as of 2026)
- Exterior features: Porch; Other exterior features; Corner lot
Interior
- Kitchen: Cooktop; Refrigerator
- Flooring: Tile; Vinyl
- Bathrooms: 3 full bathrooms
- Heating & cooling: Ceiling fan(s) (cooling); Central cooling available
- Interior features: Beamed ceilings; Ceiling fan(s); Smart thermostat; Blinds
- Laundry & utility: Dedicated laundry room
Neighborhood map
What this means for you Summary
Snapshot
- This is a 5-bed/3.0-bath single-family listed at $165k.
Deal economics
- At list price, monthly cash flow is $201 ($2k/yr) — positive.
- The deal already cash-flows at list — no discount required.
- To meet the 1% rule (rent ≥ 1% of price), the offer needs to be $162k (1.9% below list).
- Recommended offer: $162k (1.9% below list) — sets the bar for 1% rule.
Location & tenants
- Location reads 65/100 on livability (#207 in GA) — a middle-class / working-renter tenant base. Strengths: cost of living A+, health & safety A+, crime A-; Watch: amenities F, commute F, employment F.
- Tift County (town): math 30% / reading 31% proficiency, ranked #96 of 174 in GA (top 55%) — families likely to look elsewhere, expect single-tenant / working-renter base with shorter leases; 62% free/reduced lunch — lower-income household profile, screen leases tightly.
- Zoned schools: Annie Belle Clark Elementary School (math 38% / reading 39%, grade F, #463 of 1,228 statewide, top 38%, 804 students, 100% FRL); Eighth Street Middle School (math 19% / reading 26%, grade F, #327 of 470 statewide, top 70%, 958 students, 100% FRL); Tift County High School (math 14% / reading 26%, grade F, #232 of 424 statewide, top 56%, 2,273 students, 100% FRL) — zoned schools average 100% FRL vs 62% district-wide (38 pts higher); higher-poverty schools than district average — tighter screening recommended.
- Market conditions: 139 active listings in the ZIP; 176 units permitted in Tift County in 2024 (60 in 5+ unit buildings).
- This rent runs 42% of the median local income ($46k/yr) — at the standard rent-burdened threshold; future hikes will face affordability resistance.
Forward outlook
- Local home prices are declining (-3.0%/yr); year-one equity from $1k of loan paydown is wiped out by about $5k of value loss. Plan a longer hold.
- Tift County population projected to shrink 3% by 2050 — rents likely to lag national; underwrite the cash flow, not the appreciation.
Negotiation context
- It's been on market 24 days — a 2% lower offer ($163k) is reasonable based on typical stale-listing flexibility.
- 3 sale attempts since 4y ago with the ask held roughly flat each time — persistent listings suggest the price (not the market) is what's stuck; bring a comps-based counter.
- Current owner paid $75k; list at $165k implies a 120% gain — meaningful room to come down on a strong offer.
Risks & watch-outs
- Climate carrying-cost: severe wind risk, 99% chance of damaging wind over 30y; extreme-heat days projected 7→19/yr by 2055 (HVAC capex compounding) — expect insurance premiums to compound above CPI over the hold.
Questions for the listing agent
- Built in 1977 — when were the roof, HVAC, electrical panel, plumbing, and water heater last replaced?
- Is there a deadline driving the sale (1031 exchange, divorce, estate, relocation)? That informs how much negotiation room exists.
- Schools are F-rated, which usually means shorter tenancies and higher turnover. Who's the typical renter profile here, and what's been the actual vacancy rate?
- The area grade is low — what's the realistic commute time and amenity access for the typical tenant pool here? Any planned neighborhood developments (good or bad) we should know about?
- What's the average days-on-market for RENTAL listings here right now (not sales)? A rising rental-DOM trend means longer vacancies and softer asking-rent achievability than the comps imply.
- What's the recent tenant-quality profile in this submarket — average credit score on applications, eviction rate, late-payment / NSF rate, and stable-employment percentage? A property-management company in the area should have these aggregated.
- How much new for-sale + rental construction is in the pipeline within 1–3 miles? Heavy new supply typically softens prices + rents 12–24 months out; constrained supply supports both.
Investment metrics
- 1% rule
- 0.98% ✗
- Cap rate
- 7.75%
- Cash-on-cash
- 5.21%
- DSCR
- 1.23
- GRM
- 8.5
CMA / ARV
- ARV (median comp)
- $375,404
- List price
- $165,000
- Delta
- -56.05%
- Verdict
- UNDERPRICED
- Comps
- 9 within 2.0 mi
Show comp detail 1 sale within ~0.75 mi
| Address | Dist | Beds/Ba | Sqft | Sold | Price | $/sf | Match |
|---|---|---|---|---|---|---|---|
| 3315 Holt St | 0.61mi | 4/3.0 (-1) | 2,511 (+3%) | 7mo | $125,500 | $50 | 55 |
Match score weights: distance 35% · size 25% · config 20% · recency 20%. Top-matched comps best support the ARV.
Projected returns pro-forma
-3.0% appreciation · 3.0% rent growth · sell at horizon
- IRR
- -8.2%
- Equity multiple
- 0.70×
- Total profit
- $-13,964
- Equity at exit
- $24,602
- IRR
- 1.3%
- Equity multiple
- 1.09×
- Total profit
- $4,250
- Equity at exit
- $14,266
Cash invested: $46,200 (down + closing). Projections, not guarantees.
Landlord ↔ Tenant lean methodology
- Overall (STATE)
- 90 Strongly Landlord-Friendly
- State Georgia
- 90 Strongly Landlord-Friendly · R+3
- County
- — inherits STATE
- City
- — inherits STATE
ZIP-level market 31794
- Home prices YoY
- -32.1%
- Active inventory
- 139
- Price-to-rent
- 8.5×
Monthly cashflow live
- Estimated rent
- $1,619 medium interval (Pro) →
- Mortgage (P&I)
- −$865
- Tax from tax record
- −$144 /mo · $1,727/yr
- Insurance
- −$69
- HOA
- −$0
- Lot rent
- −$0
- Vacancy / Maint / Mgmt
- −$340
- Net cashflow
- $201
Break-even live
Sensitivity live
| Price | -10% $294 | -5% $247 | +0% $201 | +5% $154 | +10% $107 |
|---|---|---|---|---|---|
| Rent | -10% $73 | -5% $137 | +0% $201 | +5% $265 | +10% $329 |
| Rate | -1.0pp $284 | -0.5pp $243 | base $201 | +0.5pp $158 | +1.0pp $115 |
UW: 25.0% down · 7.5% · 30yr · 1.5% tax · 5.0% vac · 8.0% maint · 8.0% mgmt
Financing live
Cash to close
- Down payment
- $41,250
- Closing costs
- $4,950
- Reserves months
- —
- Total cash needed
- —
Loan-product check · same deal, 3 products live
Conventional
25% down · 7.5% · 30yr
- Down + closing
- —
- Monthly P&I
- —
- Monthly cashflow
- —
- DSCR
- —
- Eligible?
- —
Personal DTI + credit; lowest rate.
DSCR
20% down · 8.5% · 30yr
- Down + closing
- —
- Monthly P&I
- —
- Monthly cashflow
- —
- DSCR
- —
- Eligible?
- —
No personal income docs; deal must DSCR.
Hard money
10% down · 12.0% · 12mo
- Down + closing
- —
- Monthly P&I
- —
- Monthly cashflow
- —
- DSCR
- —
- Eligible?
- —
Short-term bridge; refi at stabilization.
Listing history 12 events
-
2026-05-31days on market $165,000 Active 24 DOM
-
2026-05-30days on market $165,000 Active 23 DOM
-
2026-05-08$165,000 Active 535-char remark
-
2026-02-10price $145,000
-
2024-12-10price $169,900
-
2024-09-04price $179,900
-
2024-04-12price $184,900
-
2024-03-20price $194,900
-
2024-03-01$199,900 Active
-
2023-03-13soldstatus $75,000
-
2023-03-13soldstatus $75,000
-
2022-12-01$82,000
ⓘ Source: listings_history table (triggers on properties + properties_extension) + one-shot
backfill from property_details.listing_events for pre-trigger history.
Tax reassessment forecast GA · Resets to sale price
- Current annual tax
- $1,727 · $144/mo
- Projected year-2 tax
- $1,727 · $144/mo
- Expected delta
- $0/yr ($0/mo · 0.0%)
ⓘ Screening estimate from a state-policy table — verify with the county assessor before closing.
Climate risk First Street
- Flood 1/10 Low FEMA zone X (unshaded) · 0% chance over 30 yrs
- Wildfire 3/10 Moderate
- Heat 7/10 Severe 7 d/yr ≥108°F today · 19 d/yr by 30 yrs out
- Wind 8/10 Severe 99% chance of damaging wind over 30 yrs
- Air quality 4/10 Moderate 4 unhealthy d/yr today · 6 by 30 yrs out
Nearby sold comps map
Loading sold comps map…
Walkable amenities ~0.75 mi
Loading nearby amenities…
Taxation est. · year 1
- Rental income
- $19,424
- − Mortgage interest
- −$9,243
- − Property taxes
- −$1,727
- − Insurance
- −$825
- − Repairs & maintenance
- −$1,554
- − Management
- −$1,554
- − Depreciation
- −$4,800
- Taxable loss
- −$279
- Est. tax savings @ 24.0%
- +$67
- After-tax cash flow
- $2,476/yr
For passive investors: Depreciation is non-cash, so a rental often shows a tax loss while cash-flowing — sheltering income. Rental losses are passive: they offset passive income freely, and up to $25,000/yr can offset ordinary (W-2) income if you actively participate and your MAGI is under $100k (phasing out to $0 by $150k); unused losses carry forward. On sale, claimed depreciation is recaptured at up to 25%, and gains may owe capital-gains tax (a 1031 exchange can defer both). Figures are a year-1 estimate at your 24.0% rate — not tax advice; consult a CPA.
Schools (NCES district)
- District
- Tift County
- NCES district ID
- 1304980
- Math proficiency
- 30% ▼ -5.00%
- Reading proficiency
- 31% ▼ -5.00%
- Median HH income
- $37,497
- Composite
- 25.42/100
- National rank
- #7454
- State rank
- #96 of 174 in GA
Livability — Unionville
- Score
- 65/100
- State rank
- #207
- US rank
- #12630
Category grades
Schools grade is shown separately in the Schools card above.
Census & demographics
- Census place
- Unionville, GA
- County
- Tift County · 26,178 people
- Metro
- Tifton, GA
- Population (ZIP)
- 26,178
- Household income
- $46,056
- Rent vs Own
- Severe rent burden
- 759.0
Population outlook (Tift County) Hauer SSP2
- Today (2025)
- 41,250 people
- By 2030
- 41,146 · -0.3%
- By 2040
- 40,677 · -1.4%
- By 2050
- 39,930 · -3.2%
- By 2075
- 37,078 · -10.1%
- By 2100
- 32,742 · -20.6%
Race, ethnicity, and origin ACS 2023
- Neighborhood character
- Diverse neighborhood (Simpson 0.64)
- Race & ethnicity
- White 46% Black 37% Hispanic / Latino 12% Two or more races 9% Asian 1%
- Hispanic origin (detail)
- Mexican 9%
- Common ancestry
- Slovak 1% Serbian 1% Hispanic 1%
- Foreign-born
- 4% · Canada
- Languages at home
- 89% English-only · Spanish 10% Other Asian/Pacific 0%
Political lean MEDSL · Tift
- 2024 margin
- Solid R (+35.7) · D 32.0% · R 67.7%
- 2008→2024 swing
- -2.8pp toward R · 2008: -32.8pp · 2024: -35.7pp
- All cycles
- 2024: R+35.7 2020: R+33.6 2016: R+37.4 2012: R+32.6 2008: R+32.8
Not yet ingested
- Civics
- —
Market trends
- HPI YoY
- ▼ -82.93%
- Current HPI
- 175.5649
- Rent YoY
- —
- Metro
- Tifton, GA
- State GDP YoY
- ▲ 2.66%
- F500 in state
- 28
Industry mix (Fortune 500 HQ in GA)
| Industry | F500 HQs | Revenue |
|---|---|---|
| Paper / Packaging | 2 | $29B |
|
||
| Retail | 1 | $160B |
|
||
| Transportation / Logistics | 1 | $91B |
|
||
| Airlines | 1 | $62B |
|
||
| Consumer Goods | 1 | $47B |
|
||
| Utilities | 1 | $25B |
|
||
Price history
+101.2% since first listed10 events — show timeline
- 2026-05-08 Listed $165,000 TABRMLS
- 2026-02-10 Price Changed $145,000 TABRMLS
- 2024-12-10 Price Changed $169,900 TABRMLS
- 2024-09-04 Price Changed $179,900 TABRMLS
- 2024-04-12 Price Changed $184,900 TABRMLS
- 2024-03-20 Price Changed $194,900 TABRMLS
- 2024-03-01 Listed $199,900 TABRMLS
- 2023-03-13 Sold (Public Records) $75,000 Public Records
- 2023-03-13 Sold (MLS) $75,000 TBOR
- 2022-12-01 Listed $82,000 TBOR
Property tax history
+3.7%/yrLatest (2025): $1,727 · -8.0% YoY. Source: county tax records.
Cash-flow waterfall
monthlySold comps — $/sqft
last 12 mo · ≤1 miLoading sold comps…