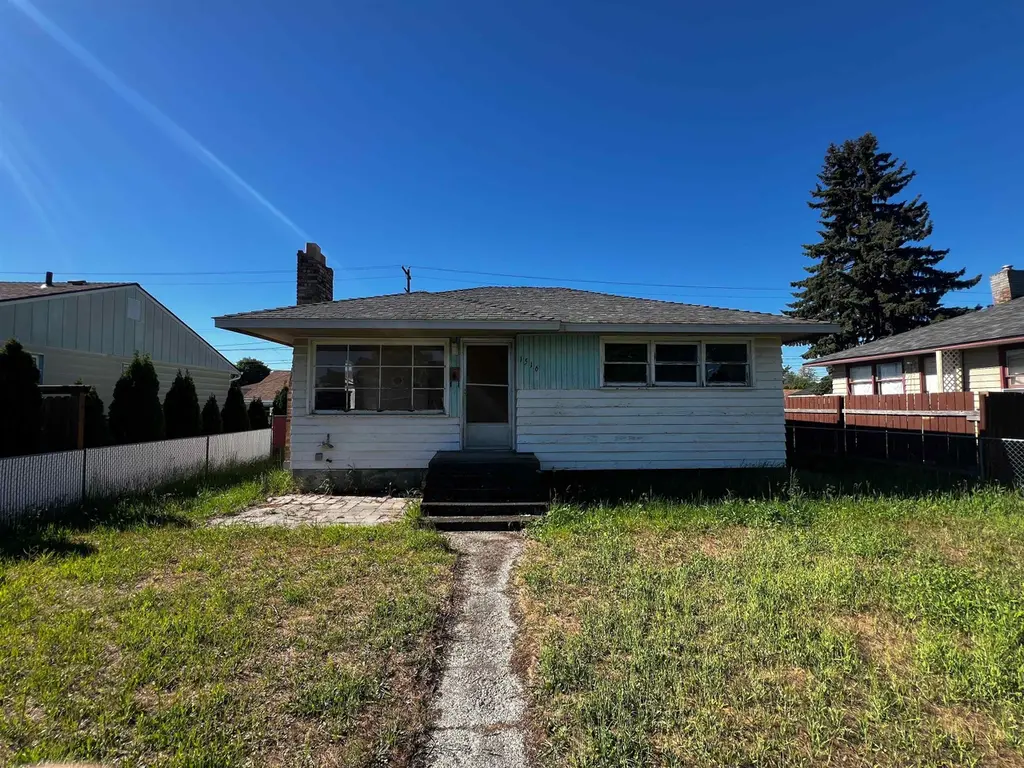
1516 E Dalke Ave · Spokane, WA
Flood risk 1/10 · Minimal
- FEMA flood zone
- X (unshaded)
- Chance of flooding over 30 yrs
- 0.0%
- Est. flood insurance / yr
- $473 – $860
Fire risk 1/10 · Minimal
- Est. fire insurance / yr
- $604 – $1,122
Heat risk 3/10 · Minor
- Hot days now (above 94°F)
- 7 days/yr
- Hot days in 30 yrs
- 15 days/yr
Wind risk 1/10 · Minimal
- Chance of severe wind over 30 yrs
- —
Air-quality risk 10/10 · Severe
- Unhealthy air days now
- 19 days/yr
- Unhealthy air days in 30 yrs
- 21 days/yr
Risk factors via First Street. Map © Google.
Why this score? — see what drove the C- grade
The composite is a weighted blend of 9 inputs, each scored 0–100. Each bar is that input's sub-score; the figure is the points it added to the 100-point composite (weight × sub-score).
- Cash flow +16.1/30.0
- ARV discount +15.0/15.0
- DSCR +5.0/10.0
- Schools +4.6/10.0
- 1% rule +4.3/10.0
- Livability +4.0/5.0
- Rent growth +2.6/5.0
- Condition / age +2.5/5.0
- Appreciation +0.0/10.0
$160,000
🖨 Deal sheet 📄 Offer letter ✓ Due diligence
Listing remarks
Investor special! This 2-bed, 1-bath fixer-upper is brimming with a ton of opportunity. Over toal 1,400 sq. ft. , a two-car garage, a newer roof, and a full basement with potential for two more bedrooms and a large rec room. Solid foundation, endless potential. Equity awaits the bold! Roll up your sleeves, this is your ticket
Key facts
- 6,250 sq ft lot
- 2 garage spots
- Built 1950
Property features AI
Finance
- Other: Living area 1,412 (public records); Below-grade finished area 706
Exterior
- Parking: Detached garage with alley access; 2-car garage
- Home design: Single-family residence; One-story design; Wood siding; Composition roof
- Construction: Wood siding construction
- Exterior features: Fenced, level yard; City street frontage
Interior
- Bedrooms: 2 bedrooms
- Heating & cooling: Natural gas forced air heating
- Interior features: Full basement with laundry; One fireplace
- Laundry & utility: Laundry in basement
Neighborhood map
What this means for you Summary
Snapshot
- This is a 2-bed/1.0-bath single-family listed at $160k.
Deal economics
- At list price, monthly cash flow is $81 ($969/yr) — positive.
- The deal already cash-flows at list — no discount required.
- To meet the 1% rule (rent ≥ 1% of price), the offer needs to be $149k (7.0% below list).
- Recommended offer: $149k (7.0% below list) — sets the bar for 1% rule.
- Cap rate 6.9% vs local median 3.2% in Spokane — top-decile yield for the area; either an underpriced asset or a hidden risk that comps aren't pricing in. Stress-test before assuming the spread holds.
Location & tenants
- Location reads 80/100 on livability (#93 in WA, #1,822 nationally) — a professional / high-income tenant draw. Strengths: amenities A+, commute A+, housing A+; Watch: crime F.
- Spokane School District (urban): math 47% / reading 58% proficiency, ranked #136 of 291 in WA (top 47%) — acceptable for families but not a draw, mixed tenant base, ~2y average lease.
- Zoned schools: Whitman Elementary (401 students, 85% FRL); Rogers High School (1,536 students, 83% FRL) — zoned schools average 84% FRL vs 50% district-wide (34 pts higher); higher-poverty schools than district average — tighter screening recommended.
- Market conditions: Rents flat; 462 active listings in the ZIP; 23 comparable units currently listed for rent nearby; rentals at typical pace (median 21d on market — plan ~3-4 weeks tenant-placement turnaround); solid renter incomes; 3,608 units permitted in Spokane County in 2024 (1,792 in 5+ unit buildings).
Forward outlook
- Local home prices are declining (-3.0%/yr); year-one equity from $1k of loan paydown is wiped out by about $5k of value loss. Plan a longer hold.
- Spokane County population projected at +13% by 2050 — modest demand growth; plan on rents tracking national, not racing it.
Negotiation context
- Only 2 days on market — expect competitive offers; lowballing is unlikely to land.
Risks & watch-outs
- Watch-outs: built in 1950 — expect roof / HVAC / electrical / plumbing capex.
Questions for the listing agent
- Built in 1950 — when were the roof, HVAC, electrical panel, plumbing, and water heater last replaced?
- Is there a deadline driving the sale (1031 exchange, divorce, estate, relocation)? That informs how much negotiation room exists.
- Schools are B-rated — typically a magnet for longer-tenancy family renters. What's the average tenant stay here, and is there a school-zone premium baked into asking?
- Crime grade is F in this area — have there been break-ins, vandalism, or insurance claims at this property in the last 3 years? What carrier currently insures it and at what premium?
- What's the average days-on-market for RENTAL listings here right now (not sales)? A rising rental-DOM trend means longer vacancies and softer asking-rent achievability than the comps imply.
- What's the recent tenant-quality profile in this submarket — average credit score on applications, eviction rate, late-payment / NSF rate, and stable-employment percentage? A property-management company in the area should have these aggregated.
- How much new for-sale + rental construction is in the pipeline within 1–3 miles? Heavy new supply typically softens prices + rents 12–24 months out; constrained supply supports both.
Investment metrics
- 1% rule
- 0.93% ✗
- Cap rate
- 6.90%
- Cash-on-cash
- 2.16%
- DSCR
- 1.10
- GRM
- 9.0
CMA / ARV
- ARV (on-the-fly)
- $264,052
- Comps found
- 12
Show comp detail 12 sales within ~0.75 mi
| Address | Dist | Beds/Ba | Sqft | Sold | Price | $/sf | Match |
|---|---|---|---|---|---|---|---|
| 1314 E Joseph Ave | 0.29mi | 2/1.0 | 957 (-5%) | 3mo | $235,000 | $246 | 76 |
| 1818 E Bismark Ave | 0.28mi | 3/1.0 (+1) | 952 (-5%) | 1mo | $250,000 | $263 | 72 |
| 1627 E Nebraska Ave | 0.30mi | 2/1.0 | 970 (-3%) | 11mo | $170,000 | $175 | 71 |
| 6204 N Morton St | 0.23mi | 3/1.0 (+1) | 918 (-9%) | 1mo | $175,000 | $191 | 69 |
| 1428 E North Ave | 0.40mi | 3/1.0 (+1) | 956 (-5%) | 3mo | $275,000 | $288 | 66 |
| 2304 E Dalke Ave | 0.57mi | 2/1.0 | 1,020 (+2%) | 11mo | $237,000 | $232 | 61 |
| 1127 E Central Ave | 0.24mi | 3/1.0 (+1) | 900 (-10%) | 12mo | $274,100 | $305 | 56 |
| 911 E Everett St | 0.62mi | 2/1.0 | 1,062 (+6%) | 8mo | $253,500 | $239 | 55 |
| 6823 N Hamilton St #6823 | 0.68mi | 2/2.0 | 1,036 (+3%) | 12mo | $240,000 | $232 | 48 |
| 2324 E Sanson Ave | 0.75mi | 2/1.0 | 885 (-12%) | 10mo | $250,000 | $282 | 37 |
| 551 E Nebraska Ave | 0.66mi | 2/1.0 | 858 (-14%) | 13mo | $255,000 | $297 | 34 |
| 1118 E Olympic Ave | 0.75mi | 2/1.0 | 864 (-14%) | 12mo | $273,000 | $316 | 32 |
Match score weights: distance 35% · size 25% · config 20% · recency 20%. Top-matched comps best support the ARV.
Projected returns pro-forma
-3.0% appreciation · 0.46% rent growth · sell at horizon
- IRR
- -15.7%
- Equity multiple
- 0.45×
- Total profit
- $-24,477
- Equity at exit
- $23,857
- IRR
- -12.4%
- Equity multiple
- 0.35×
- Total profit
- $-29,089
- Equity at exit
- $13,834
Cash invested: $44,800 (down + closing). Projections, not guarantees.
Landlord ↔ Tenant lean methodology
- Overall (STATE)
- 28 Tenant-Leaning
- State Washington
- 28 Tenant-Leaning · D+8
- County
- — inherits STATE
- City
- — inherits STATE
ZIP-level market 99208
- Rents YoY
- 0.5%
- Active inventory
- 462
- Price-to-rent
- 9.0×
Monthly cashflow live
- Estimated rent
- $1,488 high interval (Pro) →
- Mortgage (P&I)
- −$839
- Tax from tax record
- −$189 /mo · $2,264/yr
- Insurance
- −$67
- HOA
- −$0
- Vacancy / Maint / Mgmt
- −$312
- Net cashflow
- $81
Break-even live
UW: 25.0% down · 7.5% · 30yr · 1.5% tax · 5.0% vac · 8.0% maint · 8.0% mgmt
Financing live
Cash to close
- Down payment
- $40,000
- Closing costs
- $4,800
- Reserves months
- —
- Total cash needed
- —
Loan-product check · same deal, 3 products live
Conventional
25% down · 7.5% · 30yr
- Down + closing
- —
- Monthly P&I
- —
- Monthly cashflow
- —
- DSCR
- —
- Eligible?
- —
Personal DTI + credit; lowest rate.
DSCR
20% down · 8.5% · 30yr
- Down + closing
- —
- Monthly P&I
- —
- Monthly cashflow
- —
- DSCR
- —
- Eligible?
- —
No personal income docs; deal must DSCR.
Hard money
10% down · 12.0% · 12mo
- Down + closing
- —
- Monthly P&I
- —
- Monthly cashflow
- —
- DSCR
- —
- Eligible?
- —
Short-term bridge; refi at stabilization.
Rent comps 23 comps
| Address | Beds | Baths | Sqft | Rent | $/sqft | DOM | Units | Dist |
|---|---|---|---|---|---|---|---|---|
| 910 E Holyoke Ave Spokane, WA | 1.0–2.0 | 1.0 | 755 | $1,425 | $1.89 | 14d | 4 | 0.50mi |
| 824 E North Ave Unit 824 Spokane, WA | 2.0 | 1.0 | 770 | $1,195 | $1.55 | 23d | 1 | 0.58mi |
| 617 E Houston Ave Unit HH340 Spokane, WA | 2.0 | 1.0 | 710 | $1,100 | $1.55 | 14d | 1 | 0.59mi |
| 6107 N Standard St Spokane, WA | 2.0 | 1.5 | 850 | $2,350 | $2.76 | 23d | 1 | 0.61mi |
| 2414 E Francis Ave Unit 1 Spokane, WA | 2.0 | 1.0 | 800 | $1,200 | $1.50 | 14d | 1 | 0.65mi |
| 6980 N Nevada St Spokane, WA | 1.0–2.0 | 1.0 | 622 | $1,383 | $2.22 | 23d | 1 | 0.68mi |
| 6603 N Standard St Unit 6605 Spokane, WA | 2.0 | 1.0 | 750 | $1,200 | $1.60 | 23d | 1 | 0.70mi |
| 510 E Dalke Ave Spokane, WA | 2.0 | 1.0 | 1500 | $1,595 | $1.06 | 21d | 1 | 0.70mi |
| 2420 E Joseph Ave Spokane, WA | 3.0 | 2.5 | 1268 | $1,900 | $1.50 | 23d | 1 | 0.70mi |
| 1015 E Cozza Dr Unit 14 Spokane, WA | 2.0 | 1.0 | 902 | $1,110 | $1.23 | 23d | 1 | 0.76mi |
| 6203 N Astor St Spokane, WA | 2.0 | 1.0 | 1100 | $1,400 | $1.27 | 14d | 1 | 0.79mi |
| 6203 N Astor St Unit 2 Spokane, WA | 2.0 | 1.5 | 1100 | $1,400 | $1.27 | 21d | 1 | 0.79mi |
| 2506 E Rowan Ave Unit 2508 Spokane, WA | 2.0 | 1.0 | 760 | $1,350 | $1.78 | 23d | 1 | 0.80mi |
| 723 E Sitka Spokane, WA | 2.0 | 2.0 | 1400 | $1,875 | $1.34 | 14d | 1 | 0.81mi |
| 6229 N Regal St Unit B Spokane, WA | 2.0 | 1.0 | 822 | $1,150 | $1.40 | 23d | 1 | 0.92mi |
| 1910 E Wellesley Ave Unit 1912 Spokane, WA | 2.0 | 1.0 | 800 | $1,125 | $1.41 | 23d | 1 | 0.93mi |
| 1011 E Sharpsburg Ave Unit 494 Spokane, WA | 2.0 | 1.0 | 902 | $1,150 | $1.27 | 23d | 1 | 0.96mi |
| 6029 N Mayfair St Unit 7 Spokane, WA | 1.0 | 1.0 | 725 | $1,025 | $1.41 | 14d | 1 | 0.97mi |
| 121 E Wedgewood Ave Spokane, WA | 1.0–3.0 | 1.0–1.5 | 833 | $1,205 | $1.45 | 14d | 17 | 1.02mi |
| 7024 N Colton St Spokane, WA | 2.0 | 2.0 | 1082 | $1,385 | $1.28 | 14d | 1 | 1.03mi |
| 3015 E Central Ave Apt 1 Spokane, WA | 2.0 | 1.0 | 736 | $1,000 | $1.36 | 23d | 1 | 1.05mi |
| 1718 E Lincoln Rd Spokane, WA | 1.0–2.0 | 1.0–2.0 | 975 | $1,795 | $1.84 | 14d | 10 | 1.09mi |
| 2909 E Rockwell Ave Unit 2909 Spokane, WA | 2.0 | 1.0 | 1008 | $1,500 | $1.49 | 21d | 1 | 1.49mi |
Listing history 2 events
-
2026-05-31status $160,000 Pending 2 DOM
-
2026-05-27$160,000 Active
ⓘ Source: listings_history table (triggers on properties + properties_extension) + one-shot
backfill from property_details.listing_events for pre-trigger history.
Tax reassessment forecast WA · Resets to sale price
- Current annual tax
- $2,264 · $189/mo
- Projected year-2 tax
- $2,264 · $189/mo
- Expected delta
- $0/yr ($0/mo · 0.0%)
ⓘ Screening estimate from a state-policy table — verify with the county assessor before closing.
Climate risk First Street
- Flood 1/10 Low FEMA zone X (unshaded) · 0% chance over 30 yrs
- Wildfire 1/10 Low
- Heat 3/10 Moderate 7 d/yr ≥94°F today · 15 d/yr by 30 yrs out
- Wind 1/10 Low
- Air quality 10/10 Extreme 19 unhealthy d/yr today · 21 by 30 yrs out
Nearby sold comps map
Loading sold comps map…
Walkable amenities ~0.75 mi
Loading nearby amenities…
Taxation est. · year 1
- Rental income
- $17,850
- − Mortgage interest
- −$8,962
- − Property taxes
- −$2,264
- − Insurance
- −$800
- − Repairs & maintenance
- −$1,428
- − Management
- −$1,428
- − Depreciation
- −$4,655
- Taxable loss
- −$1,687
- Est. tax savings @ 24.0%
- +$405
- After-tax cash flow
- $1,374/yr
For passive investors: Depreciation is non-cash, so a rental often shows a tax loss while cash-flowing — sheltering income. Rental losses are passive: they offset passive income freely, and up to $25,000/yr can offset ordinary (W-2) income if you actively participate and your MAGI is under $100k (phasing out to $0 by $150k); unused losses carry forward. On sale, claimed depreciation is recaptured at up to 25%, and gains may owe capital-gains tax (a 1031 exchange can defer both). Figures are a year-1 estimate at your 24.0% rate — not tax advice; consult a CPA.
Schools (NCES district)
- District
- Spokane School District
- NCES district ID
- 5308250
- Math proficiency
- 47% ▲ 1.00%
- Reading proficiency
- 58% ▲ 1.00%
- Median HH income
- $43,187
- Composite
- 46.1/100
- National rank
- #5477
- State rank
- #136 of 291 in WA
Livability — Spokane
- Score
- 80/100
- State rank
- #93
- US rank
- #1822
Category grades
Schools grade is shown separately in the Schools card above.
Census & demographics
- Census place
- Spokane, WA
- County
- Spokane County · 496,401 people
- City population
- 298,820
- Metro
- Spokane-Spokane Valley, WA
- Population (ZIP)
- 58,669
- Household income
- $88,599
- Rent vs Own
- Severe rent burden
- 1832.0
Population outlook (Spokane County) Hauer SSP2
- Today (2025)
- 531,314 people
- By 2030
- 549,278 · +3.4%
- By 2040
- 577,822 · +8.8%
- By 2050
- 598,188 · +12.6%
- By 2075
- 630,744 · +18.7%
- By 2100
- 622,360 · +17.1%
Race, ethnicity, and origin ACS 2023
- Neighborhood character
- Predominantly White (83%)
- Race & ethnicity
- White 83% Two or more races 7% Hispanic / Latino 5% Black 2% Asian 2% Pacific Islander 1%
- Hispanic origin (detail)
- Mexican 4%
- Common ancestry
- Portuguese 4% Italian 2% Lithuanian 2%
- Foreign-born
- 6% · Canada, China
- Languages at home
- 93% English-only · Spanish 2% Russian/Polish/Slavic 1% Other Asian/Pacific 1%
Political lean MEDSL · Spokane
- 2024 margin
- Toss-up / Even · D 46.0% · R 51.0% · Other 3.0%
- 2008→2024 swing
- -3.8pp toward R · 2008: -1.1pp · 2024: -5.0pp
- All cycles
- 2024: R+5.0 2020: R+4.3 2016: R+8.3 2012: R+6.3 2008: R+1.1
Not yet ingested
- Civics
- —
Market trends
- HPI YoY
- ▼ -392.58%
- Current HPI
- 324.2299
- Rent YoY
- ▲ 0.46%
- Metro
- Spokane-Spokane Valley, WA
- State GDP YoY
- ▲ 4.65%
- F500 in state
- 22
Industry mix (Fortune 500 HQ in WA)
| Industry | F500 HQs | Revenue |
|---|---|---|
| Retail | 2 | $269B |
|
||
| Technology / Retail | 1 | $638B |
|
||
| Technology | 1 | $245B |
|
||
| Telecommunications | 1 | $38B |
|
||
| Food / Beverage | 1 | $36B |
|
||
| Automotive / Trucks | 1 | $34B |
|
||
Price history
1 event — show timeline
- 2026-05-27 Listed $160,000 SPOKANEMLS as Distributed by MLS Grid
Property tax history
+6.4%/yrLatest (2026): $2,264 · +7.1% YoY. Source: county tax records.
Cash-flow waterfall
monthlySold comps — $/sqft
last 12 mo · ≤1 miLoading sold comps…