35030 Harvard · Newberry Springs, CA
Flood risk 1/10 · Minimal
- FEMA flood zone
- D
- Chance of flooding over 30 yrs
- 0.0%
- Est. flood insurance / yr
- $544 – $1,084
Fire risk 3/10 · Minor
- Est. fire insurance / yr
- $659 – $1,223
Heat risk 8/10 · Major
- Hot days now (above 106°F)
- 7 days/yr
- Hot days in 30 yrs
- 19 days/yr
Wind risk 1/10 · Minimal
- Chance of severe wind over 30 yrs
- —
Air-quality risk 6/10 · Moderate
- Unhealthy air days now
- 10 days/yr
- Unhealthy air days in 30 yrs
- 13 days/yr
Risk factors via First Street. Map © Google.
Why this score? — see what drove the C- grade
The composite is a weighted blend of 9 inputs, each scored 0–100. Each bar is that input's sub-score; the figure is the points it added to the 100-point composite (weight × sub-score).
- Cash flow +21.2/30.0
- ARV discount +7.5/15.0
- DSCR +6.7/10.0
- Appreciation +5.0/10.0
- 1% rule +4.4/10.0
- Schools +2.7/10.0
- Rent growth +2.5/5.0
- Livability +2.5/5.0
- Condition / age +2.5/5.0
$149,999
🖨 Deal sheet 📄 Offer letter ✓ Due diligence
Listing remarks MLS
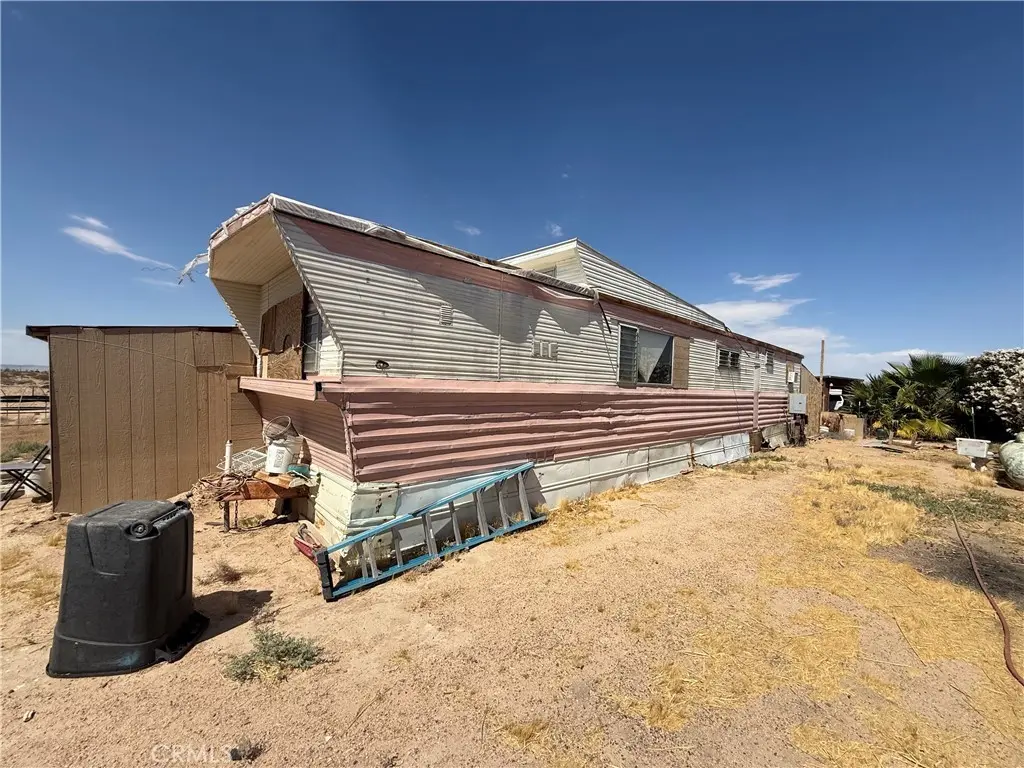
Sold as is by the San Bernardino County Public Administrator for land value. Two 5 acre parcels with power and a water well on back parcel in unknown condition. 2 car garage plus dry lake noted on back parcel. Old manufactured Home and Car also located on property, Seller dose not have title to these items. The Public Administrator is only selling the land For the Estate of Carl Marsh. Buyers assume responsibility for removal or transfer of manufactured home and Car located on property after close of escrow. APN #s 0532-081-18-0000 & 0532-081-19-0000 Access Type: Public Access # of RV Spaces: 0 Zoning Description: Agriculture Lot Location Type: Standard Location Development Status: Raw Land Frontage Type: Dirt Road Miscellaneous: Other Utility Adjc to Site: Electric, Telephone # of Attached Spaces: 0 # of Detached Spaces: 1 # of RV Spaces: 0
Key facts
- Electricity
- Two mobile homes
- 10 acres
Tags
Property features AI
Finance
- Other: Lot info from assessor's data
- Financial info: Total units on property: 2
- HOA & community: Rural community
Exterior
- Utilities: Well water; Septic (type unknown)
- Home design: Manufactured house; Single-story; Entry at front
- Construction: No ADU; Year built: see remarks; No common walls
- Exterior features: No pool; Front yard; No landscaping
Interior
- Kitchen: Kitchen (see remarks for details)
- Bedrooms: Primary bedroom (main level)
- Bathrooms: 1 full bathroom
- Heating & cooling: Has cooling (see remarks for details)
- Interior features: Front entry; One-level living; Has view
- Laundry & utility: Washer included; Laundry room (main level)
Neighborhood map
What this means for you Summary
Snapshot
- This is a 2-bed/1.0-bath manufactured listed at $150k.
Deal economics
- At list price, monthly cash flow is $216 ($3k/yr) — positive.
- The deal already cash-flows at list — no discount required.
- To meet the 1% rule (rent ≥ 1% of price), the offer needs to be $140k (6.5% below list).
- Recommended offer: $140k (6.5% below list) — sets the bar for 1% rule.
Location & tenants
- Location reads: area grade C — affects rentability + tenant quality, not the cash-flow math above.
- Silver Valley Unified (town): math 23% / reading 39% proficiency, ranked #323 of 517 in CA (top 62%) — families likely to look elsewhere, expect single-tenant / working-renter base with shorter leases.
- Market conditions: 209 active listings in the ZIP; 5,458 units permitted in San Bernardino County in 2024 (1,500 in 5+ unit buildings).
Forward outlook
- In year one you build about $6k of equity ($1k loan paydown + $4k appreciation (3.0% local appreciation)).
- San Bernardino County population projected at +15% by 2050 — modest demand growth; plan on rents tracking national, not racing it.
- At projected returns (3.0% appreciation + 3.0% rent growth), your $42k cash investment doubles in ~5 years — after that, you're playing with house money.
- By year 7, paydown + projected appreciation supports a ~$35k cash-out refi (75% LTV) — recoverable capital for the next deal without selling this one.
Negotiation context
- It's been on market 32 days — a 3% lower offer ($145k) is reasonable based on typical stale-listing flexibility.
- 5 sale attempts since 9y ago with the ask held roughly flat each time — persistent listings suggest the price (not the market) is what's stuck; bring a comps-based counter.
- Current owner paid $38k; list at $150k implies a 292% gain — meaningful room to come down on a strong offer.
Risks & watch-outs
- Climate carrying-cost: extreme-heat days projected 7→19/yr by 2055 (HVAC capex compounding) — expect insurance premiums to compound above CPI over the hold.
Questions for the listing agent
- It's been on market 32 days. Have you received any prior offers? Is the seller open to a 6% concession, seller financing, or rate buy-down credit?
- Built in 1975 — when were the roof, HVAC, electrical panel, plumbing, and water heater last replaced?
- Is there a deadline driving the sale (1031 exchange, divorce, estate, relocation)? That informs how much negotiation room exists.
- What's the average days-on-market for RENTAL listings here right now (not sales)? A rising rental-DOM trend means longer vacancies and softer asking-rent achievability than the comps imply.
- What's the recent tenant-quality profile in this submarket — average credit score on applications, eviction rate, late-payment / NSF rate, and stable-employment percentage? A property-management company in the area should have these aggregated.
- How much new for-sale + rental construction is in the pipeline within 1–3 miles? Heavy new supply typically softens prices + rents 12–24 months out; constrained supply supports both.
Investment metrics
- 1% rule
- 0.94% ✗
- Cap rate
- 8.02%
- Cash-on-cash
- 6.18%
- DSCR
- 1.27
- GRM
- 8.9
CMA / ARV
No comps found within radius.
Projected returns pro-forma
3.0% appreciation · 3.0% rent growth · sell at horizon
- IRR
- 13.2%
- Equity multiple
- 1.76×
- Total profit
- $31,772
- Equity at exit
- $67,446
- IRR
- 15.1%
- Equity multiple
- 3.23×
- Total profit
- $93,738
- Equity at exit
- $103,942
Cash invested: $42,000 (down + closing). Projections, not guarantees.
Landlord ↔ Tenant lean methodology
- Overall (STATE)
- 18 Strongly Tenant-Friendly
- State California
- 18 Strongly Tenant-Friendly · D+13
- County
- — inherits STATE
- City
- — inherits STATE
ZIP-level market 92365
- Active inventory
- 209
- Price-to-rent
- 8.9×
Monthly cashflow live
- Estimated rent
- $1,403 medium interval (Pro) →
- Mortgage (P&I)
- −$787
- Tax from tax record
- −$43 /mo · $514/yr
- Insurance
- −$62
- HOA
- −$0
- Vacancy / Maint / Mgmt
- −$295
- Net cashflow
- $216
Break-even live
UW: 25.0% down · 7.5% · 30yr · 1.5% tax · 5.0% vac · 8.0% maint · 8.0% mgmt
Financing live
Cash to close
- Down payment
- $37,500
- Closing costs
- $4,500
- Reserves months
- —
- Total cash needed
- —
Loan-product check · same deal, 3 products live
Conventional
25% down · 7.5% · 30yr
- Down + closing
- —
- Monthly P&I
- —
- Monthly cashflow
- —
- DSCR
- —
- Eligible?
- —
Personal DTI + credit; lowest rate.
DSCR
20% down · 8.5% · 30yr
- Down + closing
- —
- Monthly P&I
- —
- Monthly cashflow
- —
- DSCR
- —
- Eligible?
- —
No personal income docs; deal must DSCR.
Hard money
10% down · 12.0% · 12mo
- Down + closing
- —
- Monthly P&I
- —
- Monthly cashflow
- —
- DSCR
- —
- Eligible?
- —
Short-term bridge; refi at stabilization.
Listing history 28 events
-
2026-06-18days on market $149,999 Active 32 DOM
-
2026-06-17days on market $149,999 Active 31 DOM
-
2026-06-16days on market $149,999 Active 30 DOM
-
2026-06-15days on market $149,999 Active 29 DOM
-
2026-06-13days on market $149,999 Active 27 DOM
-
2026-06-13days on market $149,999 Active 26 DOM
-
2026-06-09days on market $149,999 Active 23 DOM
-
2026-06-08days on market $149,999 Active 22 DOM
-
2026-06-07days on market $149,999 Active 21 DOM
-
2026-06-04days on market $149,999 Active 18 DOM
-
2026-06-03days on market $149,999 Active 17 DOM
-
2026-06-02days on market $149,999 Active 16 DOM
-
2026-06-01days on market $149,999 Active 15 DOM
-
2026-05-31days on market $149,999 Active 14 DOM
-
2026-05-17$149,999 Active
-
2023-07-22historical
-
2023-07-18price $109,999
-
2022-11-05price $129,999
-
2022-09-23$149,999 Active
-
2020-07-28soldstatus $38,250 860-char remark
Show marketing remark (860 chars)
Sold as is by the San Bernardino County Public Administrator for land value. Two 5 acre parcels with power and a water well on back parcel in unknown condition. 2 car garage plus dry lake noted on back parcel. Old manufactured Home and Car also located on property, Seller dose not have title to these items. The Public Administrator is only selling the land For the Estate of Carl Marsh. Buyers assume responsibility for removal or transfer of manufactured home and Car located on property after close of escrow. APN #s 0532-081-18-0000 & 0532-081-19-0000 Access Type: Public Access # of RV Spaces: 0 Zoning Description: Agriculture Lot Location Type: Standard Location Development Status: Raw Land Frontage Type: Dirt Road Miscellaneous: Other Utility Adjc to Site: Electric, Telephone # of Attached Spaces: 0 # of Detached Spaces: 1 # of RV Spaces: 0
-
2020-07-27soldstatus $38,500
-
2018-12-11$42,000 860-char remark
Show marketing remark (860 chars)
Sold as is by the San Bernardino County Public Administrator for land value. Two 5 acre parcels with power and a water well on back parcel in unknown condition. 2 car garage plus dry lake noted on back parcel. Old manufactured Home and Car also located on property, Seller dose not have title to these items. The Public Administrator is only selling the land For the Estate of Carl Marsh. Buyers assume responsibility for removal or transfer of manufactured home and Car located on property after close of escrow. APN #s 0532-081-18-0000 & 0532-081-19-0000 Access Type: Public Access # of RV Spaces: 0 Zoning Description: Agriculture Lot Location Type: Standard Location Development Status: Raw Land Frontage Type: Dirt Road Miscellaneous: Other Utility Adjc to Site: Electric, Telephone # of Attached Spaces: 0 # of Detached Spaces: 1 # of RV Spaces: 0
-
2018-10-01historical
-
2018-10-01historical
-
2017-05-20$38,000
-
2017-05-20$38,000
-
1984-03-08soldstatus $30,000
-
1981-10-20soldstatus $51,000
ⓘ Source: listings_history table (triggers on properties + properties_extension) + one-shot
backfill from property_details.listing_events for pre-trigger history.
Tax reassessment forecast CA · Resets to sale price
- Current annual tax
- $514 · $43/mo
- Projected year-2 tax
- $1,140 · $95/mo
- Expected delta
- +$626/yr (+$52/mo · 121.8%)
ⓘ Screening estimate from a state-policy table — verify with the county assessor before closing.
Climate risk First Street
- Flood 1/10 Low FEMA zone D · 0% chance over 30 yrs
- Wildfire 3/10 Moderate
- Heat 8/10 Severe 7 d/yr ≥106°F today · 19 d/yr by 30 yrs out
- Wind 1/10 Low
- Air quality 6/10 Major 10 unhealthy d/yr today · 13 by 30 yrs out
Nearby sold comps map
Loading sold comps map…
Walkable amenities ~0.75 mi
Loading nearby amenities…
Taxation est. · year 1
- Rental income
- $16,833
- − Mortgage interest
- −$8,402
- − Property taxes
- −$514
- − Insurance
- −$750
- − Repairs & maintenance
- −$1,347
- − Management
- −$1,347
- − Depreciation
- −$4,364
- Taxable income
- $110
- Est. tax owed @ 24.0%
- −$26
- After-tax cash flow
- $2,568/yr
For passive investors: Depreciation is non-cash, so a rental often shows a tax loss while cash-flowing — sheltering income. Rental losses are passive: they offset passive income freely, and up to $25,000/yr can offset ordinary (W-2) income if you actively participate and your MAGI is under $100k (phasing out to $0 by $150k); unused losses carry forward. On sale, claimed depreciation is recaptured at up to 25%, and gains may owe capital-gains tax (a 1031 exchange can defer both). Figures are a year-1 estimate at your 24.0% rate — not tax advice; consult a CPA.
Schools (NCES district)
- District
- Silver Valley Unified
- NCES district ID
- 0636820
- Math proficiency
- 23% ▼ -12.00%
- Reading proficiency
- 39% ▼ -12.00%
- Median HH income
- $48,754
- Composite
- 26.85/100
- National rank
- #7105
- State rank
- #323 of 517 in CA
Livability — Newberry Springs
No livability data for this city. (Only ~50 U.S. cities are tracked.)
Census & demographics
- Population (ZIP)
- 2,514
Population outlook (San Bernardino County) Hauer SSP2
- Today (2025)
- 2,300,329 people
- By 2030
- 2,378,907 · +3.4%
- By 2040
- 2,523,137 · +9.7%
- By 2050
- 2,642,388 · +14.9%
- By 2075
- 2,880,769 · +25.2%
- By 2100
- 2,909,436 · +26.5%
Race, ethnicity, and origin ACS 2023
- Neighborhood character
- Diverse neighborhood (Simpson 0.60)
- Race & ethnicity
- White 56% Hispanic / Latino 29% Two or more races 20% Asian 8% Black 2%
- Hispanic origin (detail)
- Mexican 14% Dominican 7%
- Common ancestry
- Romanian 5% Slovak 2% Serbian 2%
- Foreign-born
- 16% · Canada, Vietnam
- Languages at home
- 85% English-only · Spanish 8% Vietnamese 2% German/W. Germanic 2%
Political lean MEDSL · San Bernardino
- 2024 margin
- Toss-up / Even · D 47.5% · R 49.7% · Other 2.8%
- 2008→2024 swing
- -8.5pp toward R · 2008: 6.3pp · 2024: -2.1pp
- All cycles
- 2024: R+2.1 2020: D+10.7 2016: D+9.8 2012: D+5.4 2008: D+6.3
Not yet ingested
- Civics
- —
Market trends
- HPI YoY
- —
- Current HPI
- —
- Rent YoY
- —
- Metro
- —
- State GDP YoY
- ▲ 3.21%
- F500 in state
- 116
Industry mix (Fortune 500 HQ in CA)
| Industry | F500 HQs | Revenue |
|---|---|---|
| Technology | 27 | $1,492B |
|
||
| Financial Services | 3 | $174B |
|
||
| Retail | 3 | $44B |
|
||
| Insurance | 3 | $26B |
|
||
| Media / Entertainment | 2 | $115B |
|
||
| Pharmaceuticals / Biotech | 2 | $62B |
|
||
Price history
+194.1% since first listed14 events — show timeline
- 2026-05-17 Listed $149,999 CRMLS
- 2023-07-22 Listing Removed — CRMLS
- 2023-07-18 Price Changed $109,999 CRMLS
- 2022-11-05 Price Changed $129,999 CRMLS
- 2022-09-23 Listed $149,999 CRMLS
- 2020-07-28 Sold (MLS) $38,250 CRMLS
- 2020-07-27 Sold (Public Records) $38,500 Public Records
- 2018-12-11 Listed $42,000 CRMLS
- 2018-10-01 Listing Removed — SDMLS
- 2018-10-01 Listing Removed — CRMLS
- 2017-05-20 Listed $38,000 SDMLS
- 2017-05-20 Listed $38,000 CRMLS
- 1984-03-08 Sold (Public Records) $30,000 Public Records
- 1981-10-20 Sold (Public Records) $51,000 Public Records
Property tax history
+1.0%/yrLatest (2025): $514 · +1.6% YoY. Source: county tax records.
Cash-flow waterfall
monthlySold comps — $/sqft
last 12 mo · ≤1 miLoading sold comps…