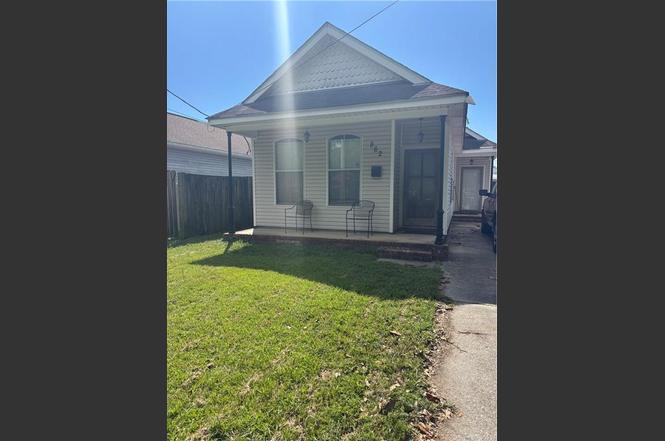
862 Avenue C Ave · Westwego, LA
Flood risk No data
- FEMA flood zone
- —
- Chance of flooding over 30 yrs
- —
- Est. flood insurance / yr
- —
Fire risk No data
- Est. fire insurance / yr
- —
Heat risk No data
- Hot days now (above threshold)
- —
- Hot days in 30 yrs
- —
Wind risk No data
- Chance of severe wind over 30 yrs
- —
Air-quality risk No data
- Unhealthy air days now
- —
- Unhealthy air days in 30 yrs
- —
Risk factors via First Street. Map © Google.
Why this score? — see what drove the B- grade
The composite is a weighted blend of 9 inputs, each scored 0–100. Each bar is that input's sub-score; the figure is the points it added to the 100-point composite (weight × sub-score).
- Cash flow +25.7/30.0
- ARV discount +15.0/15.0
- DSCR +8.6/10.0
- 1% rule +6.4/10.0
- Livability +3.4/5.0
- Schools +2.5/10.0
- Condition / age +2.5/5.0
- Rent growth +2.3/5.0
- Appreciation +0.0/10.0
$139,000
🖨 Deal sheet 📄 Offer letter ✓ Due diligence
Listing remarks MLS
Built in 2005 and located on lovely tree lined street across from park. The home is in need of repair and will NOT qualify for any type of conventional financing. Roof, ac, floors, and most appliances will need replacing. The. home does boast a front porch, amply yard, off street Parking, fireplace , two bedrooms and a bath in the front and primary bedroom and bath in the rear. This one has so much potential. Please give 24 hour notice to show. Home cannot be shown before 3 pm and first showing is Monday June 15
Key facts
- Off street parking
- Front porch
- Ample yard
Tags
Property features AI
Exterior
- Parking: Driveway
- Utilities: Public water; Public sewer
- Home design: Single-story; Raised foundation
- Exterior features: City lot; Rectangular lot
Interior
- Bathrooms: 2 full bathrooms
- Interior features: Wood-burning fireplace; Total of 5 rooms; Average condition
Neighborhood map
What this means for you Summary
Snapshot
- This is a 3-bed/2.0-bath single-family listed at $139k.
Deal economics
- At list price, monthly cash flow is $333 ($4k/yr) — positive.
- The deal already cash-flows at list — no discount required.
- Meets the 1% rule at list price ($2k rent vs $139k).
- Cap rate 9.2% vs local median 6.5% in Westwego — top-decile yield for the area; either an underpriced asset or a hidden risk that comps aren't pricing in. Stress-test before assuming the spread holds.
Location & tenants
- Location reads 68/100 on livability (#97 in LA) — a middle-class / working-renter tenant base. Strengths: cost of living A+, health & safety A+; Watch: schools C-, crime D, amenities D-.
- Jefferson Parish (suburban): math 24% / reading 34% proficiency, ranked #44 of 98 in LA (top 45%) — low school quality limits family demand, transient renter base, plan for 1-2y turnover; 70% free/reduced lunch — lower-income household profile, screen leases tightly.
- Market conditions: Rents soft (-0.8%/yr); 186 active listings in the ZIP; 18 comparable units currently listed for rent nearby; rentals at typical pace (median 24d on market — plan ~3-4 weeks tenant-placement turnaround); 518 units permitted in Jefferson Parish in 2024 (43 in 5+ unit buildings).
- This rent runs 36% of the median local income ($54k/yr) — at the standard rent-burdened threshold; future hikes will face affordability resistance.
Forward outlook
- Local home prices are declining (-3.0%/yr); year-one equity from $961 of loan paydown is wiped out by about $4k of value loss. Plan a longer hold.
Negotiation context
- Only 4 days on market — expect competitive offers; lowballing is unlikely to land.
- 2 sale attempts with the ask held roughly flat each time — persistent listings suggest the price (not the market) is what's stuck; bring a comps-based counter.
Questions for the listing agent
- Is there a deadline driving the sale (1031 exchange, divorce, estate, relocation)? That informs how much negotiation room exists.
- Crime grade is D in this area — have there been break-ins, vandalism, or insurance claims at this property in the last 3 years? What carrier currently insures it and at what premium?
- What's the average days-on-market for RENTAL listings here right now (not sales)? A rising rental-DOM trend means longer vacancies and softer asking-rent achievability than the comps imply.
- What's the recent tenant-quality profile in this submarket — average credit score on applications, eviction rate, late-payment / NSF rate, and stable-employment percentage? A property-management company in the area should have these aggregated.
- How much new for-sale + rental construction is in the pipeline within 1–3 miles? Heavy new supply typically softens prices + rents 12–24 months out; constrained supply supports both.
Investment metrics
- 1% rule
- 1.14% ✓
- Cap rate
- 9.17%
- Cash-on-cash
- 10.27%
- DSCR
- 1.46
- GRM
- 7.3
CMA / ARV
- ARV (on-the-fly)
- $187,070
- Comps found
- 12
Show comp detail 12 sales within ~0.75 mi
| Address | Dist | Beds/Ba | Sqft | Sold | Price | $/sf | Match |
|---|---|---|---|---|---|---|---|
| 127 Otto St | 0.38mi | 3/2.0 | 1,440 (+0%) | 11mo | $215,000 | $149 | 73 |
| 756 Avenue A | 0.17mi | 3/2.0 | 1,361 (-5%) | 14mo | $248,500 | $183 | 72 |
| 653 Vic A Pitre Dr | 0.53mi | 3/2.0 | 1,491 (+4%) | 1mo | $245,000 | $164 | 69 |
| 668 Avenue B | 0.25mi | 3/2.0 | 1,313 (-9%) | 10mo | $140,000 | $107 | 65 |
| 546 Avenue G | 0.45mi | 3/1.5 | 1,326 (-8%) | 2mo | $190,340 | $144 | 62 |
| 451 Sala Ave | 0.62mi | 3/2.0 | 1,464 (+2%) | 11mo | $155,000 | $106 | 60 |
| 961 Avenue A Ave | 0.18mi | 3/1.0 | 1,265 (-12%) | 13mo | $165,000 | $130 | 57 |
| 714 West Dr | 0.54mi | 3/1.0 | 1,600 (+11%) | 3mo | $55,000 | $34 | 50 |
| 129 11th St | 0.41mi | 3/1.0 | 1,318 (-8%) | 18mo | $140,000 | $106 | 48 |
| 801 West Dr | 0.54mi | 2/1.0 (-1) | 1,307 (-9%) | 3mo | $189,000 | $145 | 48 |
| 610 West Dr | 0.59mi | 3/1.0 | 1,300 (-10%) | 10mo | $159,000 | $122 | 44 |
| 7817 Alma St | 0.63mi | 4/2.0 (+1) | 1,584 (+10%) | 12mo | $205,000 | $129 | 38 |
Match score weights: distance 35% · size 25% · config 20% · recency 20%. Top-matched comps best support the ARV.
Projected returns pro-forma
-3.0% appreciation · 0.0% rent growth · sell at horizon
- IRR
- -4.2%
- Equity multiple
- 0.85×
- Total profit
- $-5,979
- Equity at exit
- $20,725
- IRR
- 1.7%
- Equity multiple
- 1.10×
- Total profit
- $4,086
- Equity at exit
- $12,018
Cash invested: $38,920 (down + closing). Projections, not guarantees.
Landlord ↔ Tenant lean methodology
- Overall (STATE)
- 90 Strongly Landlord-Friendly
- State Louisiana
- 90 Strongly Landlord-Friendly · R+12
- County
- — inherits STATE
- City
- — inherits STATE
ZIP-level market 70094
- Rents YoY
- -0.8%
- Active inventory
- 186
- Price-to-rent
- 7.3×
Monthly cashflow live
- Estimated rent
- $1,591 high interval (Pro) →
- Mortgage (P&I)
- −$729
- Tax from tax record
- −$137 /mo · $1,647/yr
- Insurance
- −$58
- HOA
- −$0
- Vacancy / Maint / Mgmt
- −$334
- Net cashflow
- $333
Break-even live
UW: 25.0% down · 7.5% · 30yr · 1.5% tax · 5.0% vac · 8.0% maint · 8.0% mgmt
Financing live
Cash to close
- Down payment
- $34,750
- Closing costs
- $4,170
- Reserves months
- —
- Total cash needed
- —
Loan-product check · same deal, 3 products live
Conventional
25% down · 7.5% · 30yr
- Down + closing
- —
- Monthly P&I
- —
- Monthly cashflow
- —
- DSCR
- —
- Eligible?
- —
Personal DTI + credit; lowest rate.
DSCR
20% down · 8.5% · 30yr
- Down + closing
- —
- Monthly P&I
- —
- Monthly cashflow
- —
- DSCR
- —
- Eligible?
- —
No personal income docs; deal must DSCR.
Hard money
10% down · 12.0% · 12mo
- Down + closing
- —
- Monthly P&I
- —
- Monthly cashflow
- —
- DSCR
- —
- Eligible?
- —
Short-term bridge; refi at stabilization.
Rent comps 18 comps
| Address | Beds | Baths | Sqft | Rent | $/sqft | DOM | Units | Dist |
|---|---|---|---|---|---|---|---|---|
| 900 Avenue H Unit D Westwego, LA | 2.0 | 1.5 | 992 | $1,300 | $1.31 | 20d | 1 | 0.10mi |
| 958 Avenue B Westwego, LA | 2.0 | 1.0 | 1018 | $1,500 | $1.47 | 44d | 1 | 0.14mi |
| 1060 Avenue B Unit A Westwego, LA | 3.0 | 2.0 | 1124 | $1,550 | $1.38 | 23d | 1 | 0.25mi |
| 181 Louisiana St Westwego, LA | 4.0 | 2.0 | 1500 | $1,550 | $1.03 | 44d | 1 | 0.31mi |
| 653 Vic a Pitre Dr Westwego, LA | 3.0 | 2.0 | 1491 | $2,200 | $1.48 | 4d | 1 | 0.50mi |
| 1300 Tanglewood Dr Westwego, LA | 1.0–3.0 | 1.0–1.5 | 781 | $1,310 | $1.68 | 2d | 14 | 0.52mi |
| 710 West Dr Westwego, LA | 2.0 | 1.0 | 941 | $1,500 | $1.59 | 4d | 1 | 0.54mi |
| 525 Emile Ave Westwego, LA | 3.0 | 2.0 | 1329 | $800 | $0.60 | 23d | 1 | 0.60mi |
| 1233 Central Ave Westwego, LA | 3.0 | 1.5 | 1357 | $1,500 | $1.11 | 23d | 1 | 0.70mi |
| 412 Avenue A Westwego, LA | 2.0 | 1.0 | 1103 | $1,500 | $1.36 | 44d | 1 | 0.70mi |
| 1413 Central Ave Unit C Westwego, LA | 2.0 | 1.5 | 1000 | $1,200 | $1.20 | 44d | 1 | 0.87mi |
| 1226 Kenny Dr Westwego, LA | 4.0 | 2.0 | 1300 | $1,650 | $1.27 | 23d | 1 | 0.94mi |
| 520 Bellina Ln Marrero, LA | 2.0 | 1.0 | 1200 | $1,200 | $1.00 | 44d | 1 | 1.05mi |
| 517 Bellina Ln Marrero, LA | 2.0 | 1.0 | 1200 | $1,400 | $1.17 | 44d | 1 | 1.07mi |
| 1029 Joyce St Marrero, LA | 3.0 | 2.0 | 1300 | $1,650 | $1.27 | 14d | 1 | 1.09mi |
| 7429 Pritchard St Marrero, LA | 2.0 | 1.0 | 925 | $1,150 | $1.24 | 14d | 1 | 1.13mi |
| 569 Magnolia Dr Marrero, LA | 2.0 | 1.5 | 1450 | $1,500 | $1.03 | 44d | 1 | 1.35mi |
| 524 Bertucci St Marrero, LA | 2.0 | 1.0 | 960 | $1,300 | $1.35 | 14d | 1 | 1.49mi |
Listing history 5 events
-
2026-06-17status $139,000 Pending 4 DOM
-
2026-06-16days on market $139,000 Active 4 DOM
-
2026-06-15days on market $139,000 Active 3 DOM
-
2026-06-13remarks 517-char remark
-
2026-06-13$139,000 Active 1 DOM
ⓘ Source: listings_history table (triggers on properties + properties_extension) + one-shot
backfill from property_details.listing_events for pre-trigger history.
Tax reassessment forecast LA · Resets to sale price
- Current annual tax
- $1,647 · $137/mo
- Projected year-2 tax
- $1,647 · $137/mo
- Expected delta
- $0/yr ($0/mo · 0.0%)
ⓘ Screening estimate from a state-policy table — verify with the county assessor before closing.
Nearby sold comps map
Loading sold comps map…
Walkable amenities ~0.75 mi
Loading nearby amenities…
Taxation est. · year 1
- Rental income
- $19,095
- − Mortgage interest
- −$7,786
- − Property taxes
- −$1,647
- − Insurance
- −$695
- − Repairs & maintenance
- −$1,528
- − Management
- −$1,528
- − Depreciation
- −$4,044
- Taxable income
- $1,868
- Est. tax owed @ 24.0%
- −$448
- After-tax cash flow
- $3,547/yr
For passive investors: Depreciation is non-cash, so a rental often shows a tax loss while cash-flowing — sheltering income. Rental losses are passive: they offset passive income freely, and up to $25,000/yr can offset ordinary (W-2) income if you actively participate and your MAGI is under $100k (phasing out to $0 by $150k); unused losses carry forward. On sale, claimed depreciation is recaptured at up to 25%, and gains may owe capital-gains tax (a 1031 exchange can defer both). Figures are a year-1 estimate at your 24.0% rate — not tax advice; consult a CPA.
Schools (NCES district)
- District
- Jefferson Parish
- NCES district ID
- 2200840
- Math proficiency
- 24% ▼ -36.00%
- Reading proficiency
- 34% ▼ -30.00%
- Median HH income
- $48,421
- Composite
- 25.19/100
- National rank
- #7511
- State rank
- #44 of 98 in LA
Livability — Westwego
- Score
- 68/100
- State rank
- #97
- US rank
- #9851
Category grades
Schools grade is shown separately in the Schools card above.
Census & demographics
- Census place
- Westwego, LA
- County
- Jefferson Parish · 426,999 people
- City population
- 32,130
- Metro
- New Orleans-Metairie, LA
- Population (ZIP)
- 32,130
- Household income
- $53,597
- Rent vs Own
- Severe rent burden
- 1457.0
Population outlook (Jefferson County) Hauer SSP2
- Today (2025)
- 451,696 people
- By 2030
- 455,451 · +0.8%
- By 2040
- 458,308 · +1.5%
- By 2050
- 461,031 · +2.1%
- By 2075
- 476,351 · +5.5%
- By 2100
- 499,377 · +10.6%
Race, ethnicity, and origin ACS 2023
- Neighborhood character
- Diverse neighborhood (Simpson 0.65)
- Race & ethnicity
- Black 46% White 36% Hispanic / Latino 13% Two or more races 6% Asian 2%
- Hispanic origin (detail)
- Mexican 2% Dominican 2%
- Common ancestry
- Lithuanian 9% Scottish 1%
- Foreign-born
- 8% · Canada, Vietnam
- Languages at home
- 86% English-only · Spanish 11% Vietnamese 2% French/Haitian/Cajun 1%
Political lean MEDSL · Jefferson
- 2024 margin
- R (+12.9) · D 42.5% · R 55.5% · Other 2.1%
- 2008→2024 swing
- +13.6pp toward D · 2008: -26.6pp · 2024: -12.9pp
- All cycles
- 2024: R+12.9 2020: R+11.1 2016: R+14.8 2012: R+18.4 2008: R+26.6
Not yet ingested
- Civics
- —
Market trends
- HPI YoY
- ▼ -111.56%
- Current HPI
- 102.9992
- Rent YoY
- ▼ -0.80%
- Metro
- New Orleans-Metairie, LA
- State GDP YoY
- ▲ 3.29%
- F500 in state
- 10
Industry mix (Fortune 500 HQ in LA)
| Industry | F500 HQs | Revenue |
|---|---|---|
| Telecommunications | 2 | $23B |
|
||
| Utilities | 1 | $12B |
|
||
| Wholesale / Distribution | 1 | $5B |
|
||
| Advertising | 1 | $2B |
|
||
Price history
+0.0% since first listed2 events — show timeline
- 2026-06-12 Listed $139,000 AcadianaMLS
- 2026-06-12 Listed $139,000 GSREIN
Property tax history
+2.5%/yrLatest (2025): $1,647 · -0.2% YoY. Source: county tax records.
Cash-flow waterfall
monthlySold comps — $/sqft
last 12 mo · ≤1 miLoading sold comps…