14830 El Camino Real Rd · Clearlake, CA
Flood risk 1/10 · Minimal
- FEMA flood zone
- X (unshaded)
- Chance of flooding over 30 yrs
- 0.0%
- Est. flood insurance / yr
- $507 – $1,088
Fire risk 10/10 · Severe
- Est. fire insurance / yr
- $659 – $1,223
Heat risk 6/10 · Moderate
- Hot days now (above 100°F)
- 7 days/yr
- Hot days in 30 yrs
- 14 days/yr
Wind risk 1/10 · Minimal
- Chance of severe wind over 30 yrs
- —
Air-quality risk 10/10 · Severe
- Unhealthy air days now
- 31 days/yr
- Unhealthy air days in 30 yrs
- 33 days/yr
Risk factors via First Street. Map © Google.
Why this score? — see what drove the C+ grade
The composite is a weighted blend of 9 inputs, each scored 0–100. Each bar is that input's sub-score; the figure is the points it added to the 100-point composite (weight × sub-score).
- Cash flow +25.7/30.0
- ARV discount +15.0/15.0
- DSCR +8.5/10.0
- 1% rule +5.7/10.0
- Livability +3.1/5.0
- Rent growth +2.5/5.0
- Condition / age +2.5/5.0
- Schools +1.2/10.0
- Appreciation +0.0/10.0
$160,000
🖨 Deal sheet 📄 Offer letter ✓ Due diligence
Listing remarks
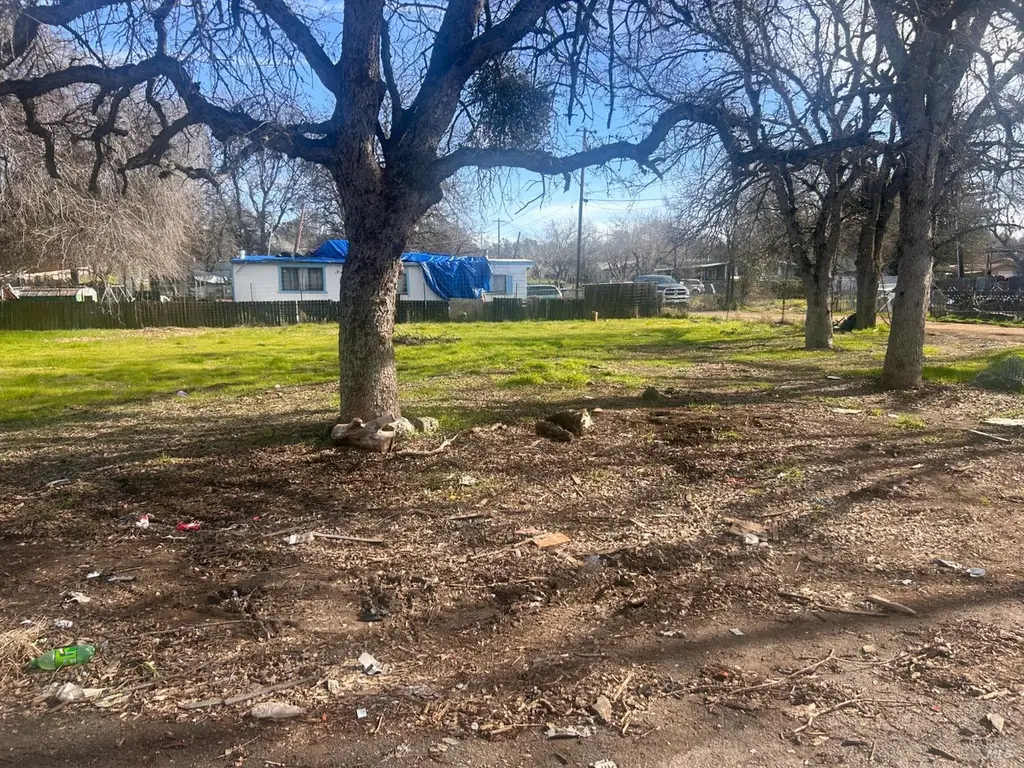
Must see this rare find! 2 bedroom, 2 bathroom mobile home on a 12,632 sq ft lot, being sold together with two adjacent lots (14840 and 14850 Res Lots) adds another 12,632 sq ft (totaling 25,264 sq ft). Utilities connected, with public sewer, water, and electric already on-site. The Mobile home needs work (perfect for investors or contractors). The three lots total provide endless options for building or subdividing.
Key facts
- Public sewer
- Three lots
- Building options
Tags
Neighborhood map
What this means for you Summary
Snapshot
- This is a 2-bed/2.0-bath land listed at $160k.
Deal economics
- At list price, monthly cash flow is $382 ($5k/yr) — positive.
- The deal already cash-flows at list — no discount required.
- Meets the 1% rule at list price ($2k rent vs $160k).
- Recommended offer: $141k (12.0% below list) — sets the bar for market timing.
- Cap rate 9.2% vs local median 3.8% in Clearlake — top-decile yield for the area; either an underpriced asset or a hidden risk that comps aren't pricing in. Stress-test before assuming the spread holds.
Location & tenants
- Location reads 61/100 on livability (#549 in CA) — a middle-class / working-renter tenant base. Strengths: housing A+, health & safety A+; Watch: schools F, crime F, amenities F.
- Konocti Unified (town): math 9% / reading 21% proficiency, ranked #494 of 517 in CA (top 96%) — low school quality limits family demand, transient renter base, plan for 1-2y turnover; 77% free/reduced lunch — lower-income household profile, screen leases tightly.
- Market conditions: 292 active listings in the ZIP; 4 comparable units currently listed for rent nearby; rentals at typical pace (median 21d on market — plan ~3-4 weeks tenant-placement turnaround); 107 units permitted in Lake County in 2024 (40 in 5+ unit buildings).
Forward outlook
- Local home prices are declining (-3.0%/yr); year-one equity from $1k of loan paydown is wiped out by about $5k of value loss. Plan a longer hold.
- Lake County population projected at -15% by 2050 — secular population decline; favor cash flow + early exit over multi-decade hold.
Negotiation context
- It's been on market 137 days — a 12% lower offer ($141k) is reasonable based on typical stale-listing flexibility.
Risks & watch-outs
- Climate carrying-cost: severe wildfire risk; extreme-heat days projected 7→14/yr by 2055 (HVAC capex compounding) — expect insurance premiums to compound above CPI over the hold.
Questions for the listing agent
- It's been on market 137 days. Have you received any prior offers? Is the seller open to a 12% concession, seller financing, or rate buy-down credit?
- Built in 1974 — when were the roof, HVAC, electrical panel, plumbing, and water heater last replaced?
- Why hasn't it sold? Are there any deal-killer items the seller is aware of (foundation, flood, title, zoning, code violations)?
- Is there a deadline driving the sale (1031 exchange, divorce, estate, relocation)? That informs how much negotiation room exists.
- Schools are F-rated, which usually means shorter tenancies and higher turnover. Who's the typical renter profile here, and what's been the actual vacancy rate?
- Crime grade is F in this area — have there been break-ins, vandalism, or insurance claims at this property in the last 3 years? What carrier currently insures it and at what premium?
- What's the average days-on-market for RENTAL listings here right now (not sales)? A rising rental-DOM trend means longer vacancies and softer asking-rent achievability than the comps imply.
- What's the recent tenant-quality profile in this submarket — average credit score on applications, eviction rate, late-payment / NSF rate, and stable-employment percentage? A property-management company in the area should have these aggregated.
- How much new for-sale + rental construction is in the pipeline within 1–3 miles? Heavy new supply typically softens prices + rents 12–24 months out; constrained supply supports both.
Investment metrics
- 1% rule
- 1.07% ✓
- Cap rate
- 9.15%
- Cash-on-cash
- 10.22%
- DSCR
- 1.45
- GRM
- 7.8
CMA / ARV
- ARV (median comp)
- $196,057
- List price
- $160,000
- Delta
- -18.39%
- Verdict
- UNDERPRICED
- Comps
- 9 within 1.0 mi
Projected returns pro-forma
-3.0% appreciation · 3.0% rent growth · sell at horizon
- IRR
- -1.0%
- Equity multiple
- 0.96×
- Total profit
- $-1,679
- Equity at exit
- $23,857
- IRR
- 8.7%
- Equity multiple
- 1.66×
- Total profit
- $29,613
- Equity at exit
- $13,834
Cash invested: $44,800 (down + closing). Projections, not guarantees.
Landlord ↔ Tenant lean methodology
- Overall (STATE)
- 18 Strongly Tenant-Friendly
- State California
- 18 Strongly Tenant-Friendly · D+13
- County
- — inherits STATE
- City
- — inherits STATE
ZIP-level market 95422
- Home prices YoY
- -33.4%
- Active inventory
- 292
- Price-to-rent
- 7.8×
Monthly cashflow live
- Estimated rent
- $1,720 medium interval (Pro) →
- Mortgage (P&I)
- −$839
- Tax from tax record
- −$71 /mo · $857/yr
- Insurance
- −$67
- HOA
- −$0
- Vacancy / Maint / Mgmt
- −$361
- Net cashflow
- $382
Break-even live
UW: 25.0% down · 7.5% · 30yr · 1.5% tax · 5.0% vac · 8.0% maint · 8.0% mgmt
Financing live
Cash to close
- Down payment
- $40,000
- Closing costs
- $4,800
- Reserves months
- —
- Total cash needed
- —
Loan-product check · same deal, 3 products live
Conventional
25% down · 7.5% · 30yr
- Down + closing
- —
- Monthly P&I
- —
- Monthly cashflow
- —
- DSCR
- —
- Eligible?
- —
Personal DTI + credit; lowest rate.
DSCR
20% down · 8.5% · 30yr
- Down + closing
- —
- Monthly P&I
- —
- Monthly cashflow
- —
- DSCR
- —
- Eligible?
- —
No personal income docs; deal must DSCR.
Hard money
10% down · 12.0% · 12mo
- Down + closing
- —
- Monthly P&I
- —
- Monthly cashflow
- —
- DSCR
- —
- Eligible?
- —
Short-term bridge; refi at stabilization.
Rent comps 4 comps
| Address | Beds | Baths | Sqft | Rent | $/sqft | DOM | Units | Dist |
|---|---|---|---|---|---|---|---|---|
| 14531 Emory Ave Clearlake, CA | 3.0 | 1.0 | 912 | $1,450 | $1.59 | 21d | 1 | 0.54mi |
| 14087 Lakeshore Dr Clearlake, CA | 3.0 | 3.0 | 1815 | $2,500 | $1.38 | 43d | 1 | 0.77mi |
| 14083 Lakeshore Dr Clearlake, CA | 2.0 | 2.0 | 1076 | $1,450 | $1.35 | 21d | 1 | 0.80mi |
| 5935 Old Highway 53 Spc 32 MH (Park Owned) Clearlake, CA | 3.0 | 2.0 | 1300 | $1,400 | $1.08 | 21d | 1 | 1.23mi |
Listing history 16 events
-
2026-06-19days on market $160,000 Active 137 DOM
-
2026-06-18days on market $160,000 Active 136 DOM
-
2026-06-17days on market $160,000 Active 135 DOM
-
2026-06-16days on market $160,000 Active 134 DOM
-
2026-06-15days on market $160,000 Active 133 DOM
-
2026-06-14days on market $160,000 Active 131 DOM
-
2026-06-13days on market $160,000 Active 130 DOM
-
2026-06-10days on market $160,000 Active 128 DOM
-
2026-06-09days on market $160,000 Active 127 DOM
-
2026-06-08days on market $160,000 Active 126 DOM
-
2026-06-07days on market $160,000 Active 125 DOM
-
2026-06-05days on market $160,000 Active 122 DOM
-
2026-06-02days on market $160,000 Active 120 DOM
-
2026-06-01days on market $160,000 Active 119 DOM
-
2026-05-31days on market $160,000 Active 118 DOM
-
2026-05-30days on market $160,000 Active 117 DOM
ⓘ Source: listings_history table (triggers on properties + properties_extension) + one-shot
backfill from property_details.listing_events for pre-trigger history.
Tax reassessment forecast CA · Resets to sale price
- Current annual tax
- $857 · $71/mo
- Projected year-2 tax
- $1,216 · $101/mo
- Expected delta
- +$359/yr (+$30/mo · 42.0%)
ⓘ Screening estimate from a state-policy table — verify with the county assessor before closing.
Climate risk First Street
- Flood 1/10 Low FEMA zone X (unshaded) · 0% chance over 30 yrs
- Wildfire 10/10 Extreme
- Heat 6/10 Major 7 d/yr ≥100°F today · 14 d/yr by 30 yrs out
- Wind 1/10 Low
- Air quality 10/10 Extreme 31 unhealthy d/yr today · 33 by 30 yrs out
Nearby sold comps map
Loading sold comps map…
Walkable amenities ~0.75 mi
Loading nearby amenities…
Taxation est. · year 1
- Rental income
- $20,638
- − Mortgage interest
- −$8,962
- − Property taxes
- −$857
- − Insurance
- −$800
- − Repairs & maintenance
- −$1,651
- − Management
- −$1,651
- − Depreciation
- −$4,655
- Taxable income
- $2,062
- Est. tax owed @ 24.0%
- −$495
- After-tax cash flow
- $4,084/yr
For passive investors: Depreciation is non-cash, so a rental often shows a tax loss while cash-flowing — sheltering income. Rental losses are passive: they offset passive income freely, and up to $25,000/yr can offset ordinary (W-2) income if you actively participate and your MAGI is under $100k (phasing out to $0 by $150k); unused losses carry forward. On sale, claimed depreciation is recaptured at up to 25%, and gains may owe capital-gains tax (a 1031 exchange can defer both). Figures are a year-1 estimate at your 24.0% rate — not tax advice; consult a CPA.
Schools (NCES district)
- District
- Konocti Unified
- NCES district ID
- 0620070
- Math proficiency
- 9% ▼ -5.00%
- Reading proficiency
- 21% ▼ -6.00%
- Median HH income
- $30,026
- Composite
- 11.81/100
- National rank
- #9677
- State rank
- #494 of 517 in CA
Livability — Clearlake
- Score
- 61/100
- State rank
- #549
- US rank
- #18284
Category grades
Schools grade is shown separately in the Schools card above.
Census & demographics
- Census place
- Clearlake, CA
- Population (ZIP)
- 17,101
Population outlook (Lake County) Hauer SSP2
- Today (2025)
- 62,396 people
- By 2030
- 60,626 · -2.8%
- By 2040
- 56,453 · -9.5%
- By 2050
- 53,054 · -15.0%
- By 2075
- 47,663 · -23.6%
- By 2100
- 41,804 · -33.0%
Race, ethnicity, and origin ACS 2023
- Neighborhood character
- Diverse neighborhood (Simpson 0.59)
- Race & ethnicity
- White 56% Hispanic / Latino 30% Two or more races 15% Black 4% Native American 3% Asian 1%
- Hispanic origin (detail)
- Mexican 26%
- Common ancestry
- Lithuanian 3% Italian 1% Russian 1%
- Foreign-born
- 10% · Canada
- Languages at home
- 77% English-only · Spanish 22% Other Indo-European 1%
Political lean MEDSL · Lake
- 2024 margin
- Toss-up / Even · D 47.8% · R 49.2% · Other 3.0%
- 2008→2024 swing
- -20.6pp toward R · 2008: 19.3pp · 2024: -1.4pp
- All cycles
- 2024: R+1.4 2020: D+6.3 2016: D+3.7 2012: D+16.5 2008: D+19.3
Not yet ingested
- Civics
- —
Market trends
- HPI YoY
- ▼ -124.47%
- Current HPI
- 248.654
- Rent YoY
- —
- Metro
- —
- State GDP YoY
- ▲ 3.21%
- F500 in state
- 116
Industry mix (Fortune 500 HQ in CA)
| Industry | F500 HQs | Revenue |
|---|---|---|
| Technology | 27 | $1,492B |
|
||
| Financial Services | 3 | $174B |
|
||
| Retail | 3 | $44B |
|
||
| Insurance | 3 | $26B |
|
||
| Media / Entertainment | 2 | $115B |
|
||
| Pharmaceuticals / Biotech | 2 | $62B |
|
||
Property tax history
+2.7%/yrLatest (2025): $857 · +1.4% YoY. Source: county tax records.
Cash-flow waterfall
monthlySold comps — $/sqft
last 12 mo · ≤1 miLoading sold comps…