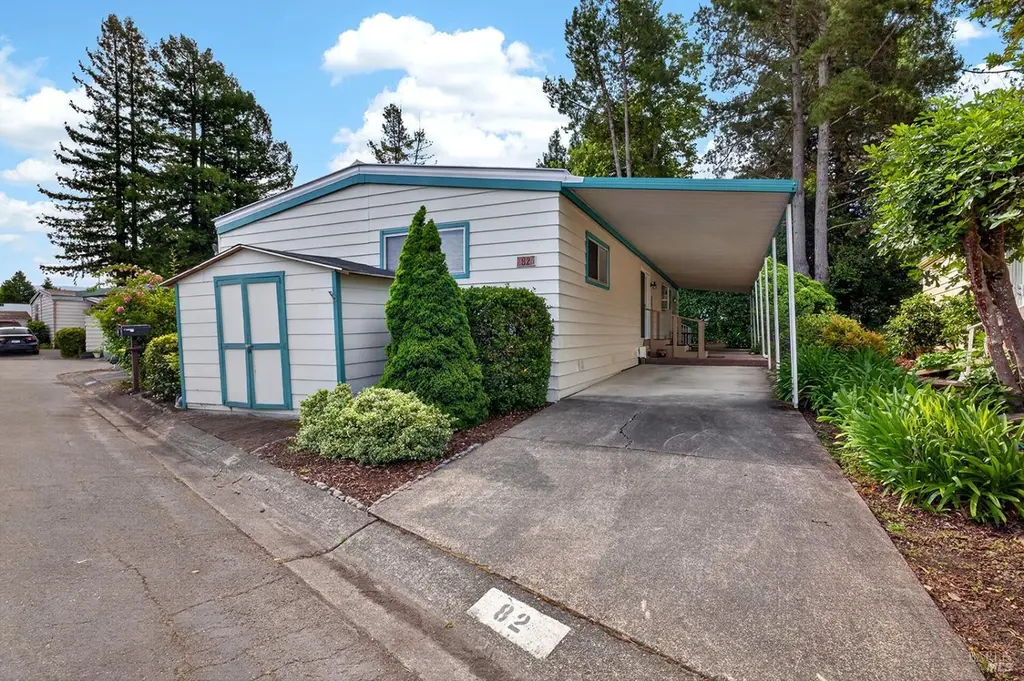
82 Circulo Rosalia Ct · Rohnert Park, CA
Flood risk 8/10 · Major
- FEMA flood zone
- X (unshaded)
- Chance of flooding over 30 yrs
- 0.99%
- Est. flood insurance / yr
- $507 – $1,088
Fire risk 6/10 · Moderate
- Est. fire insurance / yr
- $659 – $1,223
Heat risk 4/10 · Minor
- Hot days now (above 91°F)
- 7 days/yr
- Hot days in 30 yrs
- 15 days/yr
Wind risk 1/10 · Minimal
- Chance of severe wind over 30 yrs
- —
Air-quality risk 8/10 · Major
- Unhealthy air days now
- 15 days/yr
- Unhealthy air days in 30 yrs
- 17 days/yr
Risk factors via First Street. Map © Google.
Why this score? — see what drove the B+ grade
The composite is a weighted blend of 9 inputs, each scored 0–100. Each bar is that input's sub-score; the figure is the points it added to the 100-point composite (weight × sub-score).
- Cash flow +30.0/30.0
- ARV discount +14.0/15.0
- DSCR +10.0/10.0
- 1% rule +9.5/10.0
- Livability +3.8/5.0
- Schools +3.7/10.0
- Rent growth +3.2/5.0
- Condition / age +2.5/5.0
- Appreciation +0.0/10.0
$189,000
🖨 Deal sheet 📄 Offer letter ✓ Due diligence
Listing remarks
Welcome to the desirable Rancho Grande Manufactured Home Community in the heart of Rohnert Park. 82 Circulo Rosalia Ct is a well-maintained 1974, 2-bedroom, 2-bath manufactured home which offers approximately 1,416 square feet of comfortable living space in a beautifully maintained, age restricted, gated community. Inside you'll find laminate flooring throughout the main living areas, an upgraded kitchen with large sky light, a gas range, lower cabinets with lots of drawers, a modern exhaust hood, floor-to-ceiling pantry cabinets, and the refrigerator stays. The spacious eat-in kitchen flows into a formal dining area, ideal for everyday living or entertaining guests. The spacious living roo
Key facts
- Gated community
- Large sky light
- Upgraded kitchen
Tags
Property features AI
Finance
- Other: Park name: Rancho Grande
- Financial info: Monthly land lease amount applies
- HOA & community: No association; Located in a senior community; Land lease applies
Exterior
- Parking: Covered off-street parking; Guest parking available; No garage
- Utilities: Individual electric meter; Natural gas connected; Internet available; Public sewer
- Home design: Manufactured home (double wide) in park; North-facing; Updated/remodeled
- Construction: Metal roof (see remarks); Skirted with brick and other materials; Make/Manufacturer: Viking
- Exterior features: Covered patio; Patio awning; Porch steps; Carport awning; Shed(s); Garden; Front landscaping; Additional landscaping; Located on a cul-de-sac
Interior
- Kitchen: Built-in gas range; Self-cleaning oven; Dishwasher; Disposal; Freestanding refrigerator; Laminate counters; Breakfast area
- Bedrooms: 2 bedrooms
- Flooring: Carpet; Laminate; Vinyl
- Bathrooms: 2 full bathrooms; Double sinks; Shower stall(s); Tub with shower over
- Heating & cooling: Central heating; Central air conditioning
- Interior features: Grab bars in baths; Carbon monoxide detector; Smoke detector; Double-strapped water heater; Formal dining area and additional dining space in kitchen; Skylight(s); Pantry cabinets; Island in kitchen; Storage area
- Laundry & utility: Washer and dryer included; Laundry inside
Neighborhood map
What this means for you Summary
Snapshot
- This is a 2-bed/2.0-bath manufactured listed at $189k.
Deal economics
- At list price, monthly cash flow is $793 ($10k/yr) — positive.
- The deal already cash-flows at list — no discount required.
- Meets the 1% rule at list price ($3k rent vs $189k).
- Recommended offer: $186k (1.5% below list) — sets the bar for market timing.
- Cap rate 11.8% vs local median 2.8% in Rohnert Park — top-decile yield for the area; either an underpriced asset or a hidden risk that comps aren't pricing in. Stress-test before assuming the spread holds.
Location & tenants
- Location reads 75/100 on livability (#116 in CA, #4,166 nationally) — a middle-class / working-renter tenant base. Strengths: commute A+, employment A+, health & safety A+; Watch: cost of living F.
- Cotati-Rohnert Park Unified (suburban): math 24% / reading 61% proficiency, ranked #205 of 517 in CA (top 40%) — families likely to look elsewhere, expect single-tenant / working-renter base with shorter leases.
- Market conditions: Rents rising (+2.7%/yr); 100 active listings in the ZIP; 25 comparable units currently listed for rent nearby; rentals at typical pace (median 23d on market — plan ~3-4 weeks tenant-placement turnaround); solid renter incomes; 1,039 units permitted in Sonoma County in 2024 (185 in 5+ unit buildings).
- This rent runs 33% of the median local income ($99k/yr) — at the standard rent-burdened threshold; future hikes will face affordability resistance.
Forward outlook
- Local home prices are declining (-3.0%/yr); year-one equity from $1k of loan paydown is wiped out by about $6k of value loss. Plan a longer hold.
- Sonoma County population projected at +8% by 2050 — modest demand growth; plan on rents tracking national, not racing it.
- At projected returns (-3.0% appreciation + 2.7% rent growth), your $53k cash investment doubles in ~7 years — after that, you're playing with house money.
Negotiation context
- It's been on market 30 days — a 2% lower offer ($186k) is reasonable based on typical stale-listing flexibility.
Risks & watch-outs
- Watch-outs: flood insurance adds $66/mo.
- Climate carrying-cost: severe flood risk; major wildfire risk — expect insurance premiums to compound above CPI over the hold.
Questions for the listing agent
- Built in 1974 — when were the roof, HVAC, electrical panel, plumbing, and water heater last replaced?
- What's the actual annual flood-insurance premium (NFIP or private), and is the property in a SFHA with mandatory coverage?
- Is there a deadline driving the sale (1031 exchange, divorce, estate, relocation)? That informs how much negotiation room exists.
- Schools are B-rated — typically a magnet for longer-tenancy family renters. What's the average tenant stay here, and is there a school-zone premium baked into asking?
- What's the average days-on-market for RENTAL listings here right now (not sales)? A rising rental-DOM trend means longer vacancies and softer asking-rent achievability than the comps imply.
- What's the recent tenant-quality profile in this submarket — average credit score on applications, eviction rate, late-payment / NSF rate, and stable-employment percentage? A property-management company in the area should have these aggregated.
- How much new for-sale + rental construction is in the pipeline within 1–3 miles? Heavy new supply typically softens prices + rents 12–24 months out; constrained supply supports both.
Investment metrics
- 1% rule
- 1.45% ✓
- Cap rate
- 11.75%
- Cash-on-cash
- 19.50%
- DSCR
- 1.87
- GRM
- 5.7
CMA / ARV
- ARV (on-the-fly)
- $220,896
- Comps found
- 12
Show comp detail 12 sales within ~0.75 mi
| Address | Dist | Beds/Ba | Sqft | Sold | Price | $/sf | Match |
|---|---|---|---|---|---|---|---|
| 281 Circulo San Lucas | 0.15mi | 2/2.0 | 1,440 (+2%) | 9mo | $181,000 | $126 | 83 |
| 152 Parque Recrero Dr | 0.11mi | 2/2.0 | 1,440 (+2%) | 13mo | $210,000 | $146 | 81 |
| 20 Circulo Lujo Cir | 0.27mi | 2/2.0 | 1,440 (+2%) | 8mo | $212,500 | $148 | 78 |
| 226 Parque Margarita Ct | 0.19mi | 2/2.0 | 1,344 (-5%) | 12mo | $213,000 | $158 | 73 |
| 381 Circulo La Cruz Rd | 0.15mi | 2/2.0 | 1,344 (-5%) | 15mo | $287,000 | $214 | 72 |
| 58 Circulo Puerto Ct | 0.08mi | 2/2.0 | 1,244 (-12%) | 5mo | $150,000 | $121 | 72 |
| 146 Circulo Todos Cir | 0.27mi | 2/2.0 | 1,296 (-8%) | 7mo | $160,000 | $123 | 68 |
| 25 Circulo Vida | 0.20mi | 2/2.0 | 1,536 (+8%) | 11mo | $210,000 | $137 | 68 |
| 297 Circle Puebla | 0.09mi | 2/2.0 | 1,248 (-12%) | 11mo | $205,000 | $164 | 67 |
| 232 Walnut Cir | 0.67mi | 2/2.0 | 1,440 (+2%) | 13mo | $250,000 | $174 | 55 |
| 57 Mulberry Ct | 0.74mi | 2/2.0 | 1,375 (-3%) | 8mo | $215,000 | $156 | 54 |
| 25 Walnut Cir | 0.68mi | 3/2.0 (+1) | 1,549 (+9%) | 12mo | $310,000 | $200 | 38 |
Match score weights: distance 35% · size 25% · config 20% · recency 20%. Top-matched comps best support the ARV.
Projected returns pro-forma
-3.0% appreciation · 2.69% rent growth · sell at horizon
- IRR
- 9.2%
- Equity multiple
- 1.36×
- Total profit
- $19,133
- Equity at exit
- $28,181
- IRR
- 18.1%
- Equity multiple
- 2.48×
- Total profit
- $78,582
- Equity at exit
- $16,341
Cash invested: $52,920 (down + closing). Projections, not guarantees.
Landlord ↔ Tenant lean methodology
- Overall (STATE)
- 18 Strongly Tenant-Friendly
- State California
- 18 Strongly Tenant-Friendly · D+13
- County
- — inherits STATE
- City
- — inherits STATE
ZIP-level market 94928
- Rents YoY
- 2.7%
- Active inventory
- 100
- Price-to-rent
- 5.7×
Monthly cashflow live
- Estimated rent
- $2,742 high interval (Pro) →
- Mortgage (P&I)
- −$991
- Tax est. 1.5%
- −$236 /mo · $2,835/yr
- Insurance
- −$79
- Flood insurance flood zone
- −$66 /mo · $798/yr
- HOA
- −$0
- Vacancy / Maint / Mgmt
- −$576
- Net cashflow
- $793
Break-even live
UW: 25.0% down · 7.5% · 30yr · 1.5% tax · 5.0% vac · 8.0% maint · 8.0% mgmt
Financing live
Cash to close
- Down payment
- $47,250
- Closing costs
- $5,670
- Reserves months
- —
- Total cash needed
- —
Loan-product check · same deal, 3 products live
Conventional
25% down · 7.5% · 30yr
- Down + closing
- —
- Monthly P&I
- —
- Monthly cashflow
- —
- DSCR
- —
- Eligible?
- —
Personal DTI + credit; lowest rate.
DSCR
20% down · 8.5% · 30yr
- Down + closing
- —
- Monthly P&I
- —
- Monthly cashflow
- —
- DSCR
- —
- Eligible?
- —
No personal income docs; deal must DSCR.
Hard money
10% down · 12.0% · 12mo
- Down + closing
- —
- Monthly P&I
- —
- Monthly cashflow
- —
- DSCR
- —
- Eligible?
- —
Short-term bridge; refi at stabilization.
Rent comps 25 comps
| Address | Beds | Baths | Sqft | Rent | $/sqft | DOM | Units | Dist |
|---|---|---|---|---|---|---|---|---|
| 1358 Parkway Dr Rohnert Park, CA | 2.0 | 2.0 | 1104 | $2,600 | $2.36 | 13d | 1 | 0.18mi |
| 1350 Oak View Cir Rohnert Park, CA | 2.0 | 1.0–2.0 | 750 | $3,310 | $4.41 | 13d | 8 | 0.33mi |
| 4949 Snyder Ln Rohnert Park, CA | 1.0–2.0 | 1.0–2.0 | 779 | $2,621 | $3.36 | 13d | 11 | 0.39mi |
| 5425 Snyder Ln Rohnert Park, CA | 2.0 | 2.0 | 960 | $2,400 | $2.50 | 13d | 1 | 0.60mi |
| 5401 Kaitlyn Pl Rohnert Park, CA | 3.0 | 2.5 | 1838 | $5,000 | $2.72 | 13d | 1 | 0.62mi |
| 687 Racquet Club Cir Rohnert Park, CA | 2.0 | 1.5 | 1162 | $2,550 | $2.19 | 44d | 1 | 0.71mi |
| 658 Racquet Club Cir Rohnert Park, CA | 2.0 | 1.5 | 1162 | $2,995 | $2.58 | 13d | 1 | 0.77mi |
| 1440 Southwest Blvd Rohnert Park, CA | 2.0 | 1.5–2.0 | 890 | $2,249 | $2.53 | 13d | 3 | 0.78mi |
| 1440 Southwest Blvd Unit 18 Rohnert Park, CA | 2.0 | 2.0 | 950 | $2,299 | $2.42 | 13d | 1 | 0.78mi |
| 1440 Southwest Blvd Apt 27 Rohnert Park, CA | 2.0 | 2.0 | 950 | $2,099 | $2.21 | 43d | 1 | 0.78mi |
| 7101 Avenida Cala Unit 02 Rohnert Park, CA | 3.0 | 2.0 | 1250 | $2,850 | $2.28 | 23d | 1 | 0.82mi |
| 423 Enterprise Dr #423 Rohnert Park, CA | 3.0 | 1.5 | 1246 | $3,150 | $2.53 | 23d | 1 | 1.10mi |
| 465 Enterprise Dr Rohnert Park, CA | 3.0 | 2.0 | 1260 | $2,750 | $2.18 | 23d | 1 | 1.11mi |
| 7 Meridian Cir Rohnert Park, CA | 3.0 | 2.5 | 1289 | $3,275 | $2.54 | 43d | 1 | 1.15mi |
| 338 City Center Dr Rohnert Park, CA | 2.0 | 2.5 | 1229 | $3,000 | $2.44 | 21d | 1 | 1.17mi |
| 7272 Camino Colegio Rohnert Park, CA | 1.0–2.0 | 1.0–2.0 | 839 | $2,500 | $2.98 | 13d | 1 | 1.17mi |
| 445 Southwest Blvd Unit 10 Rohnert Park, CA | 3.0 | 2.0 | 1250 | $2,699 | $2.16 | 43d | 1 | 1.34mi |
| 8244 Windmill Farms Dr Unit 1 Cotati, CA | 2.0 | 1.5 | 989 | $2,400 | $2.43 | 43d | 1 | 1.35mi |
| 7300 Boris Ct Unit 4 Rohnert Park, CA | 2.0 | 1.0 | 1000 | $2,350 | $2.35 | 23d | 1 | 1.38mi |
| 7300 Boris Ct Apt 17 Rohnert Park, CA | 2.0 | 1.0 | 1000 | $2,250 | $2.25 | 23d | 1 | 1.38mi |
| 7300 Boris Ct Apt 17 Rohnert Park, CA | 2.0 | 1.0 | 1000 | $2,350 | $2.35 | 43d | 1 | 1.38mi |
| 7300 Boris Ct Apt 17 Rohnert Park, CA | 2.0 | 1.0 | 1000 | $2,250 | $2.25 | 21d | 1 | 1.38mi |
| 7300 Boris Ct Unit 4 Rohnert Park, CA | 2.0 | 1.0 | 1000 | $2,250 | $2.25 | 43d | 1 | 1.38mi |
| 1388 Miramonte Pl Rohnert Park, CA | 3.0 | 2.0 | 1442 | $3,800 | $2.64 | 43d | 1 | 1.39mi |
| 100 Avram Ave Rohnert Park, CA | 3.0 | 1.0–2.0 | 1267 | $2,900 | $2.29 | 2d | 1 | 1.46mi |
Listing history 17 events
-
2026-06-18days on market $189,000 Active 30 DOM
-
2026-06-17days on market $189,000 Active 29 DOM
-
2026-06-16days on market $189,000 Active 28 DOM
-
2026-06-15days on market $189,000 Active 27 DOM
-
2026-06-14days on market $189,000 Active 25 DOM
-
2026-06-13days on market $189,000 Active 24 DOM
-
2026-06-10days on market $189,000 Active 22 DOM
-
2026-06-09days on market $189,000 Active 21 DOM
-
2026-06-08days on market $189,000 Active 20 DOM
-
2026-06-07days on market $189,000 Active 19 DOM
-
2026-06-05days on market $189,000 Active 16 DOM
-
2026-06-03days on market $189,000 Active 15 DOM
-
2026-06-02days on market $189,000 Active 14 DOM
-
2026-06-01days on market $189,000 Active 13 DOM
-
2026-05-31days on market $189,000 Active 12 DOM
-
2026-05-30days on market $189,000 Active 11 DOM
-
2026-05-19$189,000 Active
ⓘ Source: listings_history table (triggers on properties + properties_extension) + one-shot
backfill from property_details.listing_events for pre-trigger history.
Climate risk First Street
- Flood 8/10 Severe FEMA zone X (unshaded) · 99% chance over 30 yrs
- Wildfire 6/10 Major
- Heat 4/10 Moderate 7 d/yr ≥91°F today · 15 d/yr by 30 yrs out
- Wind 1/10 Low
- Air quality 8/10 Severe 15 unhealthy d/yr today · 17 by 30 yrs out
Nearby sold comps map
Loading sold comps map…
Walkable amenities ~0.75 mi
Loading nearby amenities…
Taxation est. · year 1
- Rental income
- $32,901
- − Mortgage interest
- −$10,587
- − Property taxes
- −$2,835
- − Insurance
- −$1,742
- − Repairs & maintenance
- −$2,632
- − Management
- −$2,632
- − Depreciation
- −$5,498
- Taxable income
- $6,974
- Est. tax owed @ 24.0%
- −$1,674
- After-tax cash flow
- $7,847/yr
For passive investors: Depreciation is non-cash, so a rental often shows a tax loss while cash-flowing — sheltering income. Rental losses are passive: they offset passive income freely, and up to $25,000/yr can offset ordinary (W-2) income if you actively participate and your MAGI is under $100k (phasing out to $0 by $150k); unused losses carry forward. On sale, claimed depreciation is recaptured at up to 25%, and gains may owe capital-gains tax (a 1031 exchange can defer both). Figures are a year-1 estimate at your 24.0% rate — not tax advice; consult a CPA.
Schools (NCES district)
- District
- Cotati-Rohnert Park Unified
- NCES district ID
- 0609940
- Math proficiency
- 24% ▼ -6.00%
- Reading proficiency
- 61% ▲ 15.00%
- Median HH income
- $60,499
- Composite
- 37.42/100
- National rank
- #4420
- State rank
- #205 of 517 in CA
Livability — Rohnert Park
- Score
- 75/100
- State rank
- #116
- US rank
- #4166
Category grades
Schools grade is shown separately in the Schools card above.
Census & demographics
- Census place
- Rohnert Park, CA
- County
- Sonoma County · 449,805 people
- City population
- 46,829
- Metro
- Santa Rosa-Petaluma, CA
- Population (ZIP)
- 46,829
- Household income
- $99,280
- Rent vs Own
- Severe rent burden
- 2507.0
Population outlook (Sonoma County) Hauer SSP2
- Today (2025)
- 539,935 people
- By 2030
- 554,870 · +2.8%
- By 2040
- 573,262 · +6.2%
- By 2050
- 580,715 · +7.6%
- By 2075
- 579,229 · +7.3%
- By 2100
- 547,835 · +1.5%
Race, ethnicity, and origin ACS 2023
- Neighborhood character
- Diverse neighborhood (Simpson 0.62)
- Race & ethnicity
- White 52% Hispanic / Latino 33% Two or more races 19% Asian 6% Black 3% Native American 1%
- Hispanic origin (detail)
- Mexican 25%
- Common ancestry
- Italian 5% Slovak 3% Romanian 2%
- Foreign-born
- 15% · Canada, China, Vietnam
- Languages at home
- 72% English-only · Spanish 20% Other Asian/Pacific 2% Russian/Polish/Slavic 1%
Political lean MEDSL · Sonoma
- 2024 margin
- Solid D (+46.2) · D 71.4% · R 25.2% · Other 3.3%
- 2008→2024 swing
- -3.4pp toward R · 2008: 49.6pp · 2024: 46.2pp
- All cycles
- 2024: D+46.2 2020: D+51.5 2016: D+47.9 2012: D+44.9 2008: D+49.6
Not yet ingested
- Civics
- —
Market trends
- HPI YoY
- ▼ -628.14%
- Current HPI
- 259.9121
- Rent YoY
- ▲ 2.69%
- Metro
- Santa Rosa-Petaluma, CA
- State GDP YoY
- ▲ 3.21%
- F500 in state
- 116
Industry mix (Fortune 500 HQ in CA)
| Industry | F500 HQs | Revenue |
|---|---|---|
| Technology | 27 | $1,492B |
|
||
| Financial Services | 3 | $174B |
|
||
| Retail | 3 | $44B |
|
||
| Insurance | 3 | $26B |
|
||
| Media / Entertainment | 2 | $115B |
|
||
| Pharmaceuticals / Biotech | 2 | $62B |
|
||
Price history
1 event — show timeline
- 2026-05-19 Listed $189,000 BAREIS
Property tax history
-4.1%/yrLatest (2025): $118 · +0.6% YoY. Source: county tax records.
Cash-flow waterfall
monthlySold comps — $/sqft
last 12 mo · ≤1 miLoading sold comps…