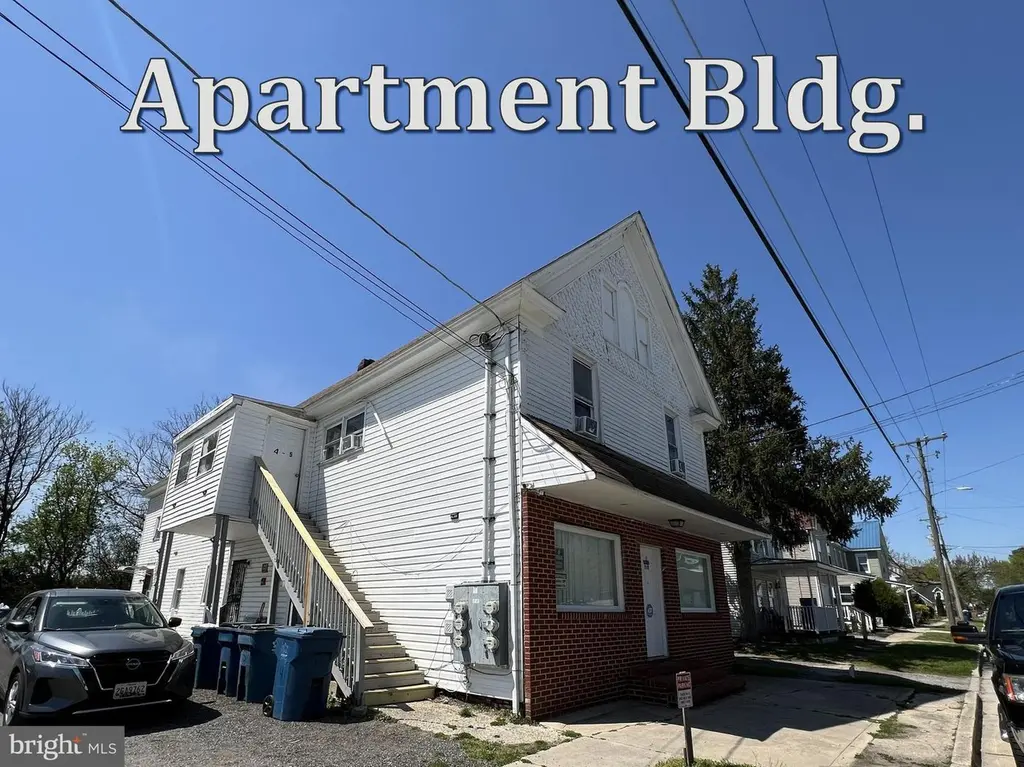
 Fourplex
310 Main St · Marydel, MD
Flood risk 1/10 · Minimal
- FEMA flood zone
- X (unshaded)
- Chance of flooding over 30 yrs
- 0.0%
- Est. flood insurance / yr
- $507 – $1,088
Fire risk 4/10 · Minor
- Est. fire insurance / yr
- $755 – $1,403
Heat risk 8/10 · Major
- Hot days now (above 103°F)
- 7 days/yr
- Hot days in 30 yrs
- 16 days/yr
Wind risk 6/10 · Moderate
- Chance of severe wind over 30 yrs
- 27.0%
Air-quality risk 2/10 · Minimal
- Unhealthy air days now
- 1 days/yr
- Unhealthy air days in 30 yrs
- 2 days/yr
Risk factors via First Street. Map © Google.
Why this score? — see what drove the C grade
The composite is a weighted blend of 9 inputs, each scored 0–100. Each bar is that input's sub-score; the figure is the points it added to the 100-point composite (weight × sub-score).
- Cash flow +20.4/30.0
- ARV discount +7.5/15.0
- Appreciation +6.9/10.0
- DSCR +6.5/10.0
- 1% rule +4.7/10.0
- Livability +2.6/5.0
- Rent growth +2.5/5.0
- Condition / age +2.5/5.0
- Schools +1.9/10.0
$529,900
🖨 Deal sheet 📄 Offer letter ✓ Due diligence
Multi-family units
County records classify this as Multi-Family (5+ Unit). Listing-text estimate: 4 units. estimate disagrees with records
5+ unit building — per-unit beds/baths from public records are typically unavailable; the breakdown below (if shown) is an estimate from the listing text.
Listing remarks MLS
Excellent investment opportunity. Also perfect for a homeowner, live in one unit and let the other units pay your mortgage. 4-unit residential apartments fully rented with long-term tenants. Additional office space available. 5 units total. Current income from 4 units is $5,100/month, potentially $6,100/month including the office. Plenty of parking for tenants, guests, and customers. Updated kitchens and bathrooms. New water heaters. Brand new well system with 20-year warranty. Updated electric panels. 6 separate electric meters. 24 hour notice required for all showings.
Key facts
- 0.34 acre lot
- 14 parking spots
- Built 1900
Neighborhood map
What this means for you Summary
Snapshot
- This is a 4 × 2-bed/?-bath units multifamily listed at $530k.
Deal economics
- At list price, monthly cash flow is $691 ($8k/yr) — positive. Per door: $173/mo.
- The deal already cash-flows at list — no discount required.
- To meet the 1% rule (rent ≥ 1% of price), the offer needs to be $516k (2.6% below list).
- Recommended offer: $498k (6.0% below list) — sets the bar for market timing.
Location & tenants
- Location reads 52/100 on livability (#442 in MD) — a working-class tenant base; expect higher turnover. Strengths: cost of living A+, housing A+; Watch: employment D, schools F, crime F.
- Caroline County Public Schools (rural): math 13% / reading 29% proficiency, ranked #17 of 24 in MD (top 71%) — low school quality limits family demand, transient renter base, plan for 1-2y turnover.
- Market conditions: 8 active listings in the ZIP; 59 units permitted in Caroline County in 2024 (0 in 5+ unit buildings).
Forward outlook
- In year one you build about $24k of equity ($4k loan paydown + $20k appreciation (3.8% local appreciation)).
- Caroline County population projected at -19% by 2050 — secular population decline; favor cash flow + early exit over multi-decade hold.
- At projected returns (3.8% appreciation + 3.0% rent growth), your $148k cash investment doubles in ~5 years — after that, you're playing with house money.
- By year 2, paydown + projected appreciation supports a ~$38k cash-out refi (75% LTV) — recoverable capital for the next deal without selling this one.
Negotiation context
- It's been on market 65 days — a 6% lower offer ($498k) is reasonable based on typical stale-listing flexibility.
- 3 sale attempts; this cycle's ask has dropped $100k (16%) from the opening price — seller is motivated, your offer sets the floor, not the list.
- Current owner paid $160k; list at $530k implies a 231% gain — meaningful room to come down on a strong offer.
Risks & watch-outs
- Watch-outs: built in 1900 — expect roof / HVAC / electrical / plumbing capex.
- Climate carrying-cost: major wind risk, 27% chance of damaging wind over 30y; extreme-heat days projected 7→16/yr by 2055 (HVAC capex compounding) — expect insurance premiums to compound above CPI over the hold.
Questions for the listing agent
- It's been on market 65 days. Have you received any prior offers? Is the seller open to a 6% concession, seller financing, or rate buy-down credit?
- Can we see the unit-by-unit rent roll, current vacancy, and any below-market leases? What's the average tenancy length?
- What capital expenditures (roof, boiler, parking lot, exteriors) have been made in the last 5 years, and what's planned in the next 2?
- Built in 1900 — when were the roof, HVAC, electrical panel, plumbing, and water heater last replaced?
- Why hasn't it sold? Are there any deal-killer items the seller is aware of (foundation, flood, title, zoning, code violations)?
- Is there a deadline driving the sale (1031 exchange, divorce, estate, relocation)? That informs how much negotiation room exists.
- Schools are F-rated, which usually means shorter tenancies and higher turnover. Who's the typical renter profile here, and what's been the actual vacancy rate?
- Crime grade is F in this area — have there been break-ins, vandalism, or insurance claims at this property in the last 3 years? What carrier currently insures it and at what premium?
- What's the average days-on-market for RENTAL listings here right now (not sales)? A rising rental-DOM trend means longer vacancies and softer asking-rent achievability than the comps imply.
- What's the recent tenant-quality profile in this submarket — average credit score on applications, eviction rate, late-payment / NSF rate, and stable-employment percentage? A property-management company in the area should have these aggregated.
- How much new apartment / multifamily construction is in the pipeline within 1–3 miles? Heavy new supply (>2% of stock underway) typically softens rents 12–24 months out; light construction supports rent growth.
Investment metrics
- 1% rule
- 0.97% ✗
- Cap rate
- 7.86%
- Cash-on-cash
- 5.59%
- DSCR
- 1.25
- GRM
- 8.6
CMA / ARV
No comps found within radius.
Projected returns pro-forma
3.76% appreciation · 3.0% rent growth · sell at horizon
- IRR
- 14.7%
- Equity multiple
- 1.87×
- Total profit
- $129,496
- Equity at exit
- $261,414
- IRR
- 15.9%
- Equity multiple
- 3.52×
- Total profit
- $373,234
- Equity at exit
- $421,877
Cash invested: $148,372 (down + closing). Projections, not guarantees.
Landlord ↔ Tenant lean methodology
- Overall (STATE)
- 27 Tenant-Leaning
- State Maryland
- 27 Tenant-Leaning · D+14
- County
- — inherits STATE
- City
- — inherits STATE
ZIP-level market 21649
- Home prices YoY
- 1.2%
- Active inventory
- 8
- Price-to-rent
- 34.2×
Monthly cashflow live
- Estimated rent
- $5,161 medium interval (Pro) →
- Mortgage (P&I)
- −$2,779
- Tax from tax record
- −$387 /mo · $4,642/yr
- Insurance
- −$221
- HOA
- −$0
- Vacancy / Maint / Mgmt
- −$1,084
- Net cashflow
- $691
Break-even live
4-unit breakdown (identical units grouped — click to expand)
| Units | Beds | Baths | Est. rent |
|---|---|---|---|
| 4× units | 2 | — | $5,160 |
| #1 | 2 | — | $1,290 |
| #2 | 2 | — | $1,290 |
| #3 | 2 | — | $1,290 |
| #4 | 2 | — | $1,290 |
| Total (4 units) | $5,161 | ||
UW: 25.0% down · 7.5% · 30yr · 1.5% tax · 5.0% vac · 8.0% maint · 8.0% mgmt
Financing live
Cash to close
- Down payment
- $132,475
- Closing costs
- $15,897
- Reserves months
- —
- Total cash needed
- —
Loan-product check · same deal, 3 products live
Conventional
25% down · 7.5% · 30yr
- Down + closing
- —
- Monthly P&I
- —
- Monthly cashflow
- —
- DSCR
- —
- Eligible?
- —
Personal DTI + credit; lowest rate.
DSCR
20% down · 8.5% · 30yr
- Down + closing
- —
- Monthly P&I
- —
- Monthly cashflow
- —
- DSCR
- —
- Eligible?
- —
No personal income docs; deal must DSCR.
Hard money
10% down · 12.0% · 12mo
- Down + closing
- —
- Monthly P&I
- —
- Monthly cashflow
- —
- DSCR
- —
- Eligible?
- —
Short-term bridge; refi at stabilization.
Listing history 25 events
-
2026-06-18days on market $529,900 Active 65 DOM
-
2026-06-17days on market $529,900 Active 64 DOM
-
2026-06-16days on market $529,900 Active 63 DOM
-
2026-06-15days on market $529,900 Active 62 DOM
-
2026-06-13days on market $529,900 Active 60 DOM
-
2026-06-12days on market $529,900 Active 59 DOM
-
2026-06-09days on market $529,900 Active 56 DOM
-
2026-06-08days on market $529,900 Active 55 DOM
-
2026-06-07days on market $529,900 Active 54 DOM
-
2026-06-07days on market $529,900 Active 53 DOM
-
2026-06-04days on market $529,900 Active 50 DOM
-
2026-06-02days on market $529,900 Active 49 DOM
-
2026-06-01pricedays on market $529,900 Active 48 DOM
-
2026-05-31days on market $629,900 Active 47 DOM
-
2026-05-31days on market $629,900 Active 46 DOM
-
2026-04-15$629,900 Active 577-char remark
Show marketing remark (577 chars)
Excellent investment opportunity. Also perfect for a homeowner, live in one unit and let the other units pay your mortgage. 4-unit residential apartments fully rented with long-term tenants. Additional office space available. 5 units total. Current income from 4 units is $5,100/month, potentially $6,100/month including the office. Plenty of parking for tenants, guests, and customers. Updated kitchens and bathrooms. New water heaters. Brand new well system with 20-year warranty. Updated electric panels. 6 separate electric meters. 24 hour notice required for all showings.
-
2026-03-28historical
-
2025-08-26$620,000 Active
-
2025-08-06historical
-
2025-05-27price $630,000
-
2025-04-25$650,000 Active
-
2005-09-22soldstatus $160,000
-
2003-11-26soldstatus $150,000
-
2001-02-09soldstatus $85,000
-
1997-01-21soldstatus $62,000
ⓘ Source: listings_history table (triggers on properties + properties_extension) + one-shot
backfill from property_details.listing_events for pre-trigger history.
Tax reassessment forecast MD · Partial reset (capped growth)
- Current annual tax
- $4,642 · $387/mo
- Projected year-2 tax
- $5,209 · $434/mo
- Expected delta
- +$567/yr (+$47/mo · 12.2%)
ⓘ Screening estimate from a state-policy table — verify with the county assessor before closing.
Climate risk First Street
- Flood 1/10 Low FEMA zone X (unshaded) · 0% chance over 30 yrs
- Wildfire 4/10 Moderate
- Heat 8/10 Severe 7 d/yr ≥103°F today · 16 d/yr by 30 yrs out
- Wind 6/10 Major 27% chance of damaging wind over 30 yrs
- Air quality 2/10 Low 1 unhealthy d/yr today · 2 by 30 yrs out
Nearby sold comps map
Loading sold comps map…
Walkable amenities ~0.75 mi
Loading nearby amenities…
Taxation est. · year 1
- Rental income
- $61,932
- − Mortgage interest
- −$29,683
- − Property taxes
- −$4,642
- − Insurance
- −$2,650
- − Repairs & maintenance
- −$4,955
- − Management
- −$4,955
- − Depreciation
- −$15,415
- Taxable loss
- −$366
- Est. tax savings @ 24.0%
- +$88
- After-tax cash flow
- $8,377/yr
For passive investors: Depreciation is non-cash, so a rental often shows a tax loss while cash-flowing — sheltering income. Rental losses are passive: they offset passive income freely, and up to $25,000/yr can offset ordinary (W-2) income if you actively participate and your MAGI is under $100k (phasing out to $0 by $150k); unused losses carry forward. On sale, claimed depreciation is recaptured at up to 25%, and gains may owe capital-gains tax (a 1031 exchange can defer both). Figures are a year-1 estimate at your 24.0% rate — not tax advice; consult a CPA.
Schools (NCES district)
- District
- Caroline County Public Schools
- NCES district ID
- 2400180
- Math proficiency
- 13% ▼ -22.00%
- Reading proficiency
- 29% ▼ -14.00%
- Median HH income
- $55,076
- Composite
- 19.16/100
- National rank
- #8823
- State rank
- #17 of 24 in MD
Livability — Marydel
- Score
- 52/100
- State rank
- #442
- US rank
- #25110
Category grades
Schools grade is shown separately in the Schools card above.
Census & demographics
- Census place
- Marydel, MD
- Population (ZIP)
- 1,938
Population outlook (Caroline County) Hauer SSP2
- Today (2025)
- 31,205 people
- By 2030
- 30,204 · -3.2%
- By 2040
- 27,866 · -10.7%
- By 2050
- 25,342 · -18.8%
- By 2075
- 20,554 · -34.1%
- By 2100
- 17,415 · -44.2%
Race, ethnicity, and origin ACS 2023
- Neighborhood character
- Diverse neighborhood (Simpson 0.60)
- Race & ethnicity
- White 47% Hispanic / Latino 42% Two or more races 16% Black 4% Asian 3%
- Hispanic origin (detail)
- Mexican 3%
- Common ancestry
- Italian 1%
- Foreign-born
- 32% · Canada
- Languages at home
- 60% English-only · Spanish 37% Other Indo-European 3%
Political lean MEDSL · Caroline
- 2024 margin
- Solid R (+38.0) · D 29.9% · R 67.9% · Other 2.2%
- 2008→2024 swing
- -15.0pp toward R · 2008: -23.0pp · 2024: -38.0pp
- All cycles
- 2024: R+38.0 2020: R+32.9 2016: R+39.5 2012: R+24.4 2008: R+23.0
Not yet ingested
- Civics
- —
Market trends
- HPI YoY
- ▲ 3.76%
- Current HPI
- 310.7166
- Rent YoY
- —
- Metro
- —
- State GDP YoY
- ▲ 2.97%
- F500 in state
- 12
Industry mix (Fortune 500 HQ in MD)
| Industry | F500 HQs | Revenue |
|---|---|---|
| Aerospace / Defense | 1 | $71B |
|
||
| Utilities | 1 | $25B |
|
||
| Hotels | 1 | $24B |
|
||
| Consumer Goods | 1 | $7B |
|
||
| Real Estate | 1 | $6B |
|
||
| Chemicals | 1 | $2B |
|
||
Price history
+916.0% since first listed10 events — show timeline
- 2026-04-15 Listed $629,900 BRIGHT MLS
- 2026-03-28 Listing Removed — BRIGHT MLS
- 2025-08-26 Listed $620,000 BRIGHT MLS
- 2025-08-06 Listing Removed — BRIGHT MLS
- 2025-05-27 Price Changed $630,000 BRIGHT MLS
- 2025-04-25 Listed $650,000 BRIGHT MLS
- 2005-09-22 Sold (Public Records) $160,000 Public Records
- 2003-11-26 Sold (Public Records) $150,000 Public Records
- 2001-02-09 Sold (Public Records) $85,000 Public Records
- 1997-01-21 Sold (Public Records) $62,000 Public Records
Property tax history
+4.2%/yrLatest (2025): $4,642 · +1.6% YoY. Source: county tax records.
Cash-flow waterfall
monthlySold comps — $/sqft
last 12 mo · ≤1 miLoading sold comps…