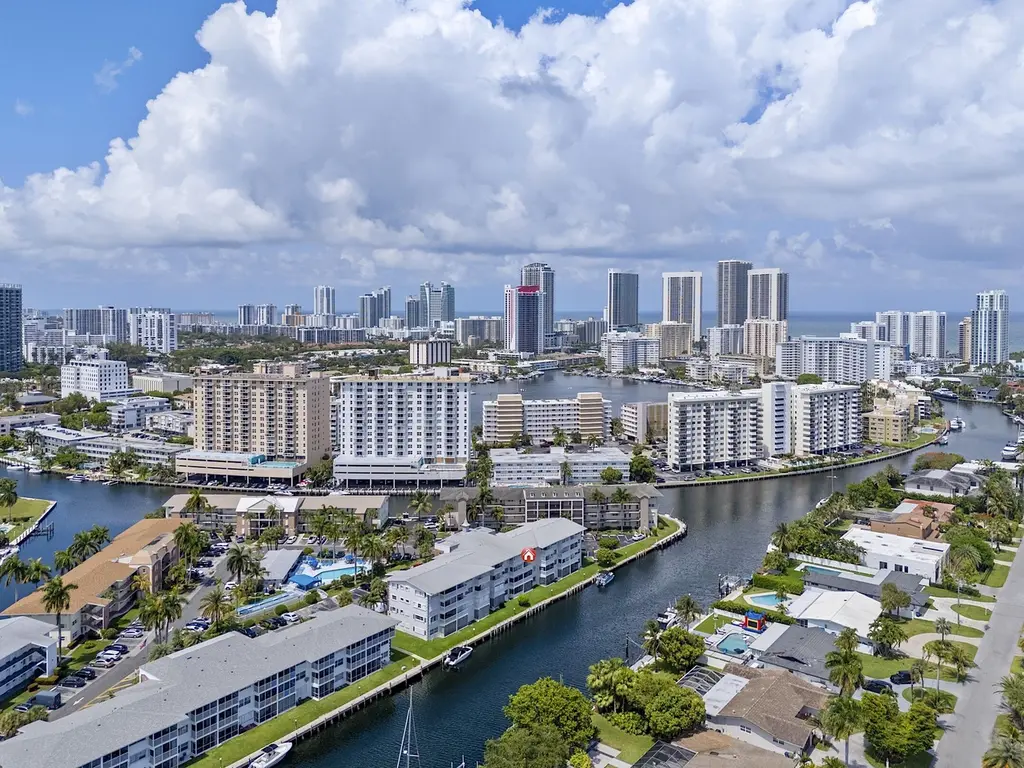
455 Paradise Isle Blvd · Hallandale Beach, FL
Flood risk 8/10 · Major
- FEMA flood zone
- AE
- Chance of flooding over 30 yrs
- 0.97%
- Est. flood insurance / yr
- $1,737 – $8,500
Fire risk 1/10 · Minimal
- Est. fire insurance / yr
- $947 – $1,759
Heat risk 10/10 · Severe
- Hot days now (above 103°F)
- 6 days/yr
- Hot days in 30 yrs
- 21 days/yr
Wind risk 10/10 · Severe
- Chance of severe wind over 30 yrs
- 99.0%
Air-quality risk 2/10 · Minimal
- Unhealthy air days now
- 1 days/yr
- Unhealthy air days in 30 yrs
- 2 days/yr
Risk factors via First Street. Map © Google.
Why this score? — see what drove the B- grade
The composite is a weighted blend of 9 inputs, each scored 0–100. Each bar is that input's sub-score; the figure is the points it added to the 100-point composite (weight × sub-score).
- Cash flow +26.9/30.0
- DSCR +9.3/10.0
- 1% rule +9.2/10.0
- ARV discount +7.5/15.0
- Schools +4.1/10.0
- Livability +4.0/5.0
- Rent growth +2.6/5.0
- Condition / age +2.5/5.0
- Appreciation +0.0/10.0
$289,000
🖨 Deal sheet 📄 Offer letter ✓ Due diligence
Listing remarks
Welcome to waterfront living in Hallandale Beach on the hidden Isle of Paradise. This beautifully remodeled 2BR/2BA co-op offers wide canal views and a multi-million-dollar waterfront feel the moment you enter. Fully furnished and turnkey, featuring two primary suites—just bring your suitcase and enjoy effortless South Florida living. Relax on your screened balcony and take in peaceful island breezes. Walk or bike to beach, dining, shopping, entertainment, banking, and casino. Boaters will appreciate dock space available through a community waiting list, no fixed bridges, and has ocean access. HOPA 55 + co-op with heated pool, elevator, assigned and guest parking. Rare waterfront opp
Key facts
- Screened balcony
- Wide canal views
- Waterfront living
Tags
Property features AI
Finance
- HOA & community: Association: Isle of Paradise; Monthly association fee of $445; Association amenities include elevator(s), parking, and pool; Association fee covers common areas, elevator, and pool service; Senior community; Pets not allowed; Community contains 216 units
Exterior
- Parking: Guest parking (total 1 parking space); No carport
- Utilities: Public water; Public sewer; Cable available
- Home design: Stock cooperative; One level; Faces north; Resale condition
- Construction: Brick veneer construction; Flat roof; Building has four stories
- Exterior features: Ocean access with no fixed bridge; Asphalt-paved roads
Interior
- Kitchen: Dishwasher; Electric range; Electric cooktop; Microwave; Refrigerator
- Bedrooms: One main-level bedroom
- Flooring: Tile
- Bathrooms: Two full bathrooms (one on the main level)
- Heating & cooling: Central heating; Central air conditioning
- Interior features: Accessible entrance with ramp and accessible stairway; Common areas accessible and adaptable for elevator
- Laundry & utility: Laundry in common area
Neighborhood map
What this means for you Summary
Snapshot
- This is a 2-bed/2.0-bath other listed at $289k.
Deal economics
- At list price, monthly cash flow is $374 ($4k/yr) — positive.
- The deal already cash-flows at list — no discount required.
- Meets the 1% rule at list price ($4k rent vs $289k).
- Cap rate 9.6% vs local median 5.2% in Hallandale Beach — top-decile yield for the area; either an underpriced asset or a hidden risk that comps aren't pricing in. Stress-test before assuming the spread holds.
Location & tenants
- Location reads 81/100 on livability (#86 in FL, #1,400 nationally) — a professional / high-income tenant draw. Strengths: commute A+, health & safety A+, crime B+; Watch: employment D-.
- Broward (suburban): math 42% / reading 53% proficiency, ranked #46 of 73 in FL (top 63%) — families likely to look elsewhere, expect single-tenant / working-renter base with shorter leases.
- Zoned schools: Gulfstream Academy of Hallandale Beach (math 32% / reading 40%, grade F, #1,670 of 2,144 statewide, top 78%, 1,317 students, 73% FRL); Hallandale High School (math 10% / reading 24%, grade F, #597 of 667 statewide, top 90%, 1,104 students, 70% FRL) — zoned schools average 71% FRL vs 51% district-wide (20 pts higher); higher-poverty schools than district average — tighter screening recommended.
- Zoned-school proficiency averages 26% at this address vs 48% district-wide (-21 pts) — the specific schools serving this property underperform the Broward average; the district grade overstates school quality for this exact location.
- Market conditions: Rents flat; 1373 active listings in the ZIP; 40 comparable units currently listed for rent nearby; rentals at typical pace (median 17d on market — plan ~3-4 weeks tenant-placement turnaround); 2,111 units permitted in Broward County in 2024 (1,265 in 5+ unit buildings).
- At $4,104/mo this rent would consume 95% of the median local household income ($52k/yr) (locally 3293% of renters already pay >50% of income on rent) — very limited rent-growth headroom before tenants either downsize or default.
Forward outlook
- Local home prices are declining (-3.0%/yr); year-one equity from $2k of loan paydown is wiped out by about $9k of value loss. Plan a longer hold.
- Broward County population projected at +34% by 2050 — long-run rental-demand tailwind backs the buy-and-hold thesis.
Negotiation context
- Only 1 days on market — expect competitive offers; lowballing is unlikely to land.
- 2 sale attempts since 13y ago with the ask held roughly flat each time — persistent listings suggest the price (not the market) is what's stuck; bring a comps-based counter.
Risks & watch-outs
- Watch-outs: flood insurance adds $427/mo.
- Climate carrying-cost: in FEMA flood zone AE (mandatory federal flood insurance); severe wind risk, 99% chance of damaging wind over 30y; extreme-heat days projected 6→21/yr by 2055 (HVAC capex compounding) — expect insurance premiums to compound above CPI over the hold.
Questions for the listing agent
- Built in 1965 — when were the roof, HVAC, electrical panel, plumbing, and water heater last replaced?
- What's the actual annual flood-insurance premium (NFIP or private), and is the property in a SFHA with mandatory coverage?
- What does the HOA fee cover, when was the last increase, and are there any pending special assessments or reserve-fund shortfalls?
- Is there a deadline driving the sale (1031 exchange, divorce, estate, relocation)? That informs how much negotiation room exists.
- What's the average days-on-market for RENTAL listings here right now (not sales)? A rising rental-DOM trend means longer vacancies and softer asking-rent achievability than the comps imply.
- What's the recent tenant-quality profile in this submarket — average credit score on applications, eviction rate, late-payment / NSF rate, and stable-employment percentage? A property-management company in the area should have these aggregated.
- How much new for-sale + rental construction is in the pipeline within 1–3 miles? Heavy new supply typically softens prices + rents 12–24 months out; constrained supply supports both.
Investment metrics
- 1% rule
- 1.42% ✓
- Cap rate
- 9.62%
- Cash-on-cash
- 11.87%
- DSCR
- 1.53
- GRM
- 5.9
CMA / ARV
No comps found within radius.
Projected returns pro-forma
-3.0% appreciation · 0.43% rent growth · sell at horizon
- IRR
- -11.6%
- Equity multiple
- 0.59×
- Total profit
- $-32,783
- Equity at exit
- $43,091
- IRR
- -8.4%
- Equity multiple
- 0.56×
- Total profit
- $-35,808
- Equity at exit
- $24,987
Cash invested: $80,920 (down + closing). Projections, not guarantees.
Landlord ↔ Tenant lean methodology
- Overall (STATE)
- 87 Strongly Landlord-Friendly
- State Florida
- 87 Strongly Landlord-Friendly · R+3
- County
- — inherits STATE
- City
- — inherits STATE
ZIP-level market 33009
- Rents YoY
- 0.4%
- Active inventory
- 1373
- Price-to-rent
- 5.9×
Monthly cashflow live
- Estimated rent
- $4,104 high interval (Pro) →
- Mortgage (P&I)
- −$1,516
- Tax est. 1.5%
- −$361 /mo · $4,335/yr
- Insurance
- −$120
- Flood insurance flood zone
- −$427 /mo · $5,118/yr
- HOA
- −$445
- Vacancy / Maint / Mgmt
- −$862
- Net cashflow
- $374
Break-even live
UW: 25.0% down · 7.5% · 30yr · 1.5% tax · 5.0% vac · 8.0% maint · 8.0% mgmt
Financing live
Cash to close
- Down payment
- $72,250
- Closing costs
- $8,670
- Reserves months
- —
- Total cash needed
- —
Loan-product check · same deal, 3 products live
Conventional
25% down · 7.5% · 30yr
- Down + closing
- —
- Monthly P&I
- —
- Monthly cashflow
- —
- DSCR
- —
- Eligible?
- —
Personal DTI + credit; lowest rate.
DSCR
20% down · 8.5% · 30yr
- Down + closing
- —
- Monthly P&I
- —
- Monthly cashflow
- —
- DSCR
- —
- Eligible?
- —
No personal income docs; deal must DSCR.
Hard money
10% down · 12.0% · 12mo
- Down + closing
- —
- Monthly P&I
- —
- Monthly cashflow
- —
- DSCR
- —
- Eligible?
- —
Short-term bridge; refi at stabilization.
Rent comps 40 comps
| Address | Beds | Baths | Sqft | Rent | $/sqft | DOM | Units | Dist |
|---|---|---|---|---|---|---|---|---|
| 201 Golden Isles Dr #302 Hallandale Beach, FL | 2.0 | 2.0 | 1150 | $3,975 | $3.46 | 24d | 1 | 0.33mi |
| 121 Golden Isles Dr #1 Hallandale Beach, FL | 2.0 | 2.0 | 1379 | $4,000 | $2.90 | 24d | 1 | 0.42mi |
| 1745 E Hallandale Beach Blvd Unit 802W Hallandale Beach, FL | 3.0 | 2.0 | 1481 | $3,600 | $2.43 | 24d | 1 | 0.45mi |
| 1745 E Hallandale Beach Blvd Unit 2302W Hallandale Beach, FL | 3.0 | 2.0 | 1481 | $3,900 | $2.63 | 24d | 1 | 0.45mi |
| 1745 E Hallandale Beach Blvd Unit 2302W Hallandale Beach, FL | 3.0 | 2.0 | 1481 | $3,900 | $2.63 | 15d | 1 | 0.45mi |
| 1180 E Hallandale Beach Blvd Unit 1241877P Hallandale Beach, FL | 1.0–2.0 | 1.0–2.0 | 844 | $5,453 | $6.46 | 3d | 2 | 0.46mi |
| 101 Diplomat Pkwy Hallandale Beach, FL | 1.0 | 1.0 | 859 | $3,740 | $4.35 | 24d | 1 | 0.46mi |
| 1755 E Hallandale Beach Blvd Unit 1407E Hallandale Beach, FL | 2.0 | 2.0 | 1354 | $3,650 | $2.70 | 24d | 1 | 0.48mi |
| 1755 E Hallandale Beach Blvd Unit 2207E Hallandale Beach, FL | 2.0 | 2.0 | 1354 | $3,950 | $2.92 | 24d | 1 | 0.48mi |
| 2017 S Ocean Dr #1107 Hallandale Beach, FL | 2.0 | 2.0 | 1270 | $3,900 | $3.07 | 14d | 1 | 0.53mi |
| 1985 S Ocean Dr Unit 21P Hallandale Beach, FL | 2.0 | 2.0 | 1380 | $3,800 | $2.75 | 7d | 1 | 0.55mi |
| 1985 S Ocean Dr Unit 22P Hallandale Beach, FL | 2.0 | 2.0 | 1380 | $4,000 | $2.90 | 24d | 1 | 0.55mi |
| 1985 S Ocean Dr Unit 9G Hallandale Beach, FL | 2.0 | 2.0 | 1240 | $3,700 | $2.98 | 24d | 1 | 0.55mi |
| 2601 E Hallandale Beach Blvd Unit 1227344P Hallandale Beach, FL | 1.0–2.0 | 1.0–2.0 | 844 | $4,219 | $5.00 | 1d | 2 | 0.56mi |
| 2602 E Hallandale Beach Blvd Hallandale Beach, FL | 1.0–2.0 | 1.0–2.0 | 1070 | $5,950 | $5.56 | 20d | 4 | 0.56mi |
| 2602 E Hallandale Beach Blvd Hallandale Beach, FL | 1.0–2.0 | 1.0–2.0 | 1092 | $5,950 | $5.45 | 24d | 3 | 0.56mi |
| 2602 E Hallandale Beach Blvd Hallandale Beach, FL | 3.0 | 1.0–3.0 | 1011 | $5,495 | $5.44 | 1d | 5 | 0.56mi |
| 2600 E Hallandale Beach Blvd Unit T3208 Hallandale Beach, FL | 2.0 | 2.0 | 1030 | $6,950 | $6.75 | 24d | 1 | 0.56mi |
| 2600 E Hallandale Beach Blvd Unit T3307 Hallandale Beach, FL | 2.0 | 2.0 | 1030 | $4,500 | $4.37 | 24d | 1 | 0.56mi |
| 2600 E Hallandale Beach Blvd Unit T3110 Hallandale Beach, FL | 2.0 | 2.0 | 1028 | $3,650 | $3.55 | 24d | 1 | 0.56mi |
| 2069 S Ocean Dr Unit TH12 Hallandale Beach, FL | 3.0 | 3.0 | 1500 | $4,800 | $3.20 | 10d | 1 | 0.59mi |
| 2069 S Ocean Dr Unit TH12 Hallandale Beach, FL | 3.0 | 3.0 | 1500 | $4,800 | $3.20 | 24d | 1 | 0.59mi |
| 1945 S Ocean Dr Hallandale Beach, FL | 2.0–3.0 | 2.0–3.0 | 1542 | $4,500 | $2.92 | 7d | 2 | 0.59mi |
| 1945 S Ocean Dr Hallandale Beach, FL | 2.0–3.0 | 2.0–2.5 | 1522 | $3,650 | $2.40 | 18d | 3 | 0.59mi |
| 1945 S Ocean Dr Hallandale Beach, FL | 2.0–3.0 | 2.0–3.0 | 1542 | $4,000 | $2.59 | 15d | 3 | 0.59mi |
| 1945 S Ocean Dr Hallandale Beach, FL | 2.0–3.0 | 2.0–3.0 | 1542 | $4,500 | $2.92 | 12d | 2 | 0.59mi |
| 2065 S Ocean Dr Unit 1049793P Hallandale Beach, FL | 2.0 | 2.0 | 871 | $4,971 | $5.71 | 7d | 1 | 0.67mi |
| 1880 N Ocean Dr Unit TS705 Hallandale Beach, FL | 2.0 | 2.0 | 1350 | $5,000 | $3.70 | 16d | 1 | 0.68mi |
| 1880 N Ocean Dr Unit TS705 Hallandale Beach, FL | 2.0 | 2.0 | 1350 | $5,000 | $3.70 | 24d | 1 | 0.68mi |
| 1880 N Ocean Dr Unit TS705 Hallandale Beach, FL | 2.0 | 2.0 | 1350 | $4,900 | $3.63 | 15d | 1 | 0.68mi |
| 2030 S Ocean Dr Hallandale Beach, FL | 2.0 | 2.0 | 1280 | $4,750 | $3.71 | 2d | 9 | 0.69mi |
| 2030 S Ocean Dr Hallandale Beach, FL | 2.0 | 2.0 | 1280 | $4,825 | $3.77 | 24d | 9 | 0.69mi |
| 2030 S Ocean Dr Hallandale Beach, FL | 2.0 | 2.0 | 1280 | $4,850 | $3.79 | 4d | 7 | 0.69mi |
| 2030 S Ocean Dr Hallandale Beach, FL | 2.0 | 2.0 | 1280 | $4,800 | $3.75 | 3d | 7 | 0.69mi |
| 2030 S Ocean Dr Hallandale Beach, FL | 2.0 | 2.0 | 1280 | $4,775 | $3.73 | 2d | 8 | 0.69mi |
| 2721 E Hallandale Beach Blvd Unit 1049818P Hollywood, FL | 1.0–2.0 | 1.0–2.0 | 946 | $5,897 | $6.23 | 3d | 2 | 0.69mi |
| 1904 S Ocean Dr #1707 Hallandale Beach, FL | 2.0 | 2.0 | 1350 | $5,000 | $3.70 | 24d | 1 | 0.70mi |
| 1950 S Ocean Dr Unit 12M Hallandale Beach, FL | 1.0 | 1.5 | 870 | $3,800 | $4.37 | 2d | 1 | 0.70mi |
| 1950 S Ocean Dr Unit 3D Hallandale Beach, FL | 1.0 | 1.5 | 870 | $3,950 | $4.54 | 5d | 1 | 0.70mi |
| 1950 S Ocean Dr Unit 3D Hallandale Beach, FL | 1.0 | 1.5 | 870 | $3,950 | $4.54 | 12d | 1 | 0.70mi |
HOA detail
- Monthly dues
- $445 · $5,340/yr
- Likely covers
- waterpool
Listing history 5 events
-
2026-05-25$289,000 Active
-
2013-10-29historical
-
2013-08-06$159,900 Active
-
2013-08-04historical
-
2013-06-03price $159,900
ⓘ Source: listings_history table (triggers on properties + properties_extension) + one-shot
backfill from property_details.listing_events for pre-trigger history.
Climate risk First Street
- Flood 8/10 Severe FEMA zone AE · 97% chance over 30 yrs
- Wildfire 1/10 Low
- Heat 10/10 Extreme 6 d/yr ≥103°F today · 21 d/yr by 30 yrs out
- Wind 10/10 Extreme 99% chance of damaging wind over 30 yrs
- Air quality 2/10 Low 1 unhealthy d/yr today · 2 by 30 yrs out
Nearby sold comps map
Loading sold comps map…
Walkable amenities ~0.75 mi
Loading nearby amenities…
Taxation est. · year 1
- Rental income
- $49,252
- − Mortgage interest
- −$16,188
- − Property taxes
- −$4,335
- − Insurance
- −$6,564
- − Repairs & maintenance
- −$3,940
- − Management
- −$3,940
- − HOA
- −$5,340
- − Depreciation
- −$8,407
- Taxable income
- $537
- Est. tax owed @ 24.0%
- −$129
- After-tax cash flow
- $4,355/yr
For passive investors: Depreciation is non-cash, so a rental often shows a tax loss while cash-flowing — sheltering income. Rental losses are passive: they offset passive income freely, and up to $25,000/yr can offset ordinary (W-2) income if you actively participate and your MAGI is under $100k (phasing out to $0 by $150k); unused losses carry forward. On sale, claimed depreciation is recaptured at up to 25%, and gains may owe capital-gains tax (a 1031 exchange can defer both). Figures are a year-1 estimate at your 24.0% rate — not tax advice; consult a CPA.
Schools (NCES district)
- District
- Broward
- NCES district ID
- 1200180
- Math proficiency
- 42% ▼ -18.00%
- Reading proficiency
- 53% ▼ -5.00%
- Median HH income
- $52,139
- Composite
- 40.88/100
- National rank
- #3621
- State rank
- #46 of 73 in FL
Livability — Hallandale Beach
- Score
- 81/100
- State rank
- #86
- US rank
- #1400
Category grades
Schools grade is shown separately in the Schools card above.
Census & demographics
- Census place
- Hallandale Beach, FL
- County
- Broward County · 1,963,430 people
- City population
- 44,021
- Metro
- Miami-Fort Lauderdale-Pompano Beach, FL
- Population (ZIP)
- 44,502
- Household income
- $52,079
- Rent vs Own
- Severe rent burden
- 3293.0
Population outlook (Broward County) Hauer SSP2
- Today (2025)
- 2,207,033 people
- By 2030
- 2,360,704 · +7.0%
- By 2040
- 2,661,208 · +20.6%
- By 2050
- 2,946,698 · +33.5%
- By 2075
- 3,602,273 · +63.2%
- By 2100
- 3,970,984 · +79.9%
Race, ethnicity, and origin ACS 2023
- Neighborhood character
- Diverse neighborhood (Simpson 0.67)
- Race & ethnicity
- Hispanic / Latino 39% White 39% Two or more races 24% Black 17% Asian 1%
- Hispanic origin (detail)
- Mexican 2% Puerto Rican 3% Cuban 9% Dominican 3% Salvadoran 2%
- Common ancestry
- Scotch-Irish 5% Hispanic 5% Subsaharan African 3%
- Foreign-born
- 51% · Canada, Jamaica, Dominican Republic
- Languages at home
- 38% English-only · Spanish 36% Russian/Polish/Slavic 12% French/Haitian/Cajun 7%
Political lean MEDSL · Broward
- 2024 margin
- D (+17.0) · D 58.0% · R 41.0%
- 2008→2024 swing
- -17.8pp toward R · 2008: 34.7pp · 2024: 17.0pp
- All cycles
- 2024: D+17.0 2020: D+29.8 2016: D+35.0 2012: D+34.9 2008: D+34.7
Not yet ingested
- Civics
- —
Market trends
- HPI YoY
- ▼ -299.13%
- Current HPI
- 329.9081
- Rent YoY
- ▲ 0.43%
- Metro
- Miami-Fort Lauderdale-Pompano Beach, FL
- State GDP YoY
- ▲ 3.28%
- F500 in state
- 36
Industry mix (Fortune 500 HQ in FL)
| Industry | F500 HQs | Revenue |
|---|---|---|
| Industrial Technology | 2 | $29B |
|
||
| Insurance | 2 | $17B |
|
||
| Retail | 1 | $60B |
|
||
| Technology Distribution | 1 | $58B |
|
||
| Homebuilding | 1 | $35B |
|
||
| Technology Manufacturing | 1 | $35B |
|
||
Price history
+80.7% since first listed5 events — show timeline
- 2026-05-25 Listed $289,000 Beaches MLS
- 2013-10-29 Listing Removed — MARMLS
- 2013-08-06 Listed $159,900 MARMLS
- 2013-08-04 Listing Removed — MARMLS
- 2013-06-03 Price Changed $159,900 MARMLS
Cash-flow waterfall
monthlySold comps — $/sqft
last 12 mo · ≤1 miLoading sold comps…