 🏗️ New Construction
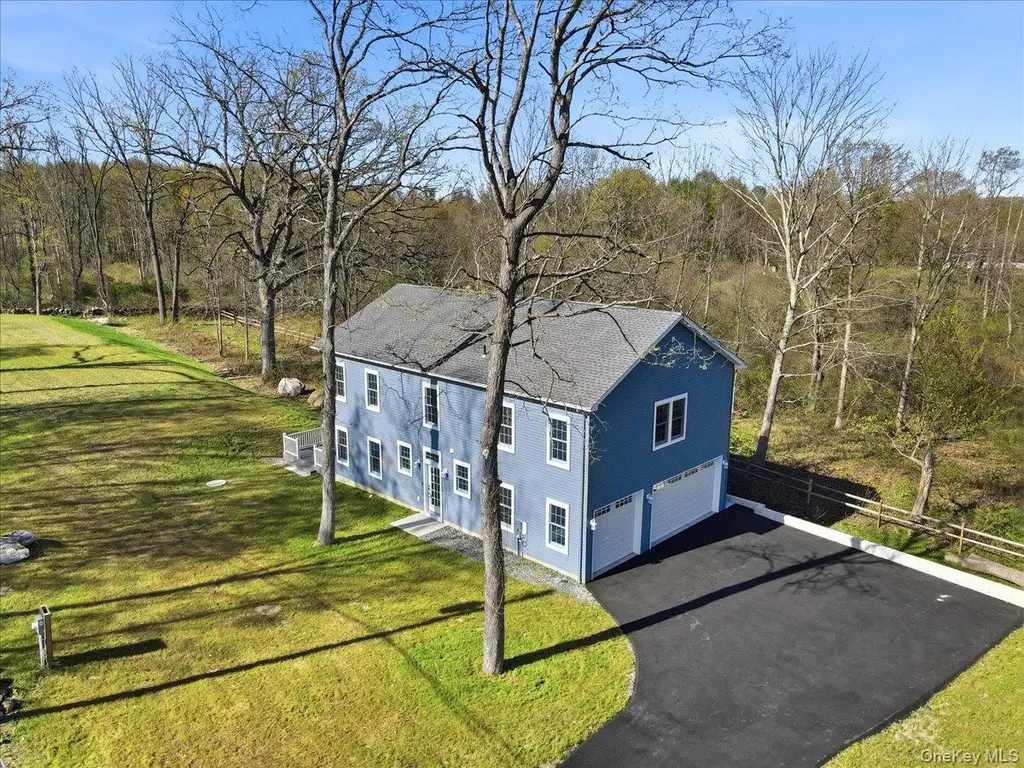
40 Cushman Rd · Lake Carmel, NY
Flood risk 6/10 · Moderate
- FEMA flood zone
- X (unshaded)
- Chance of flooding over 30 yrs
- 0.71%
- Est. flood insurance / yr
- $507 – $1,088
Fire risk 5/10 · Moderate
- Est. fire insurance / yr
- $691 – $1,283
Heat risk 4/10 · Minor
- Hot days now (above 97°F)
- 7 days/yr
- Hot days in 30 yrs
- 15 days/yr
Wind risk 4/10 · Minor
- Chance of severe wind over 30 yrs
- 17.0%
Air-quality risk 3/10 · Minor
- Unhealthy air days now
- 2 days/yr
- Unhealthy air days in 30 yrs
- 3 days/yr
Risk factors via First Street. Map © Google.
Why this score? — see what drove the C+ grade
The composite is a weighted blend of 9 inputs, each scored 0–100. Each bar is that input's sub-score; the figure is the points it added to the 100-point composite (weight × sub-score).
- Cash flow +25.6/30.0
- DSCR +8.5/10.0
- ARV discount +7.5/15.0
- 1% rule +6.5/10.0
- Schools +5.0/10.0
- Livability +3.3/5.0
- Rent growth +2.5/5.0
- Condition / age +2.5/5.0
- Appreciation +0.0/10.0
$750,000
🖨 Deal sheet (PDF) 📄 Offer letter ✓ Due diligence
Listing remarks MLS
New custom built colonial inspired smart home in Patterson NY. Constructed with the highest quality materials by trusted local contractors. A modern, energy efficient, zero emissions home. Located in an extraordinarily desirable location of town. Surrounded by pristine nature and quaint equine properties. Nestled along a quiet historic road, this neighborhood has a country atmosphere in a friendly community that's great for families. Large yard with a generous outdoor deck, perfect for enjoying our famous Hudson valley sunsets.
Key facts
- Open floor plan
- Large outdoor deck
- 3.3 acre lot
Tags
Property features AI
Exterior
- Parking: Driveway; 3-car garage
- Utilities: Septic tank; Cable available
- Home design: Single family residence; New construction; Two levels
- Construction: Frame construction; Vinyl siding; Foam insulation; Energy Star compliant
- Exterior features: Vinyl siding; Foam insulation; Energy Star construction features; Not waterfront
Interior
- Kitchen: Granite counters; Kitchen island; Open kitchen; Pantry; Electric range; Microwave; Dishwasher; Refrigerator
- Bedrooms: Two levels (total rooms: 8)
- Bathrooms: Two full bathrooms; One half bathroom
- Heating & cooling: Forced air heating with heat pump; ENERGY STAR qualified heating equipment; Central air conditioning; ENERGY STAR qualified cooling equipment; Zoned climate control
- Interior features: Ceiling fans; Eat-in kitchen; Entrance foyer; Granite counters; Kitchen island; Open floorplan with open kitchen; Pantry; Primary bathroom; Recessed lighting; Smart thermostat; Soaking tub; Walk-through kitchen; Walk-in closets; Washer/dryer hookup; Attic with pull-down stairs; No basement
- Laundry & utility: Laundry room; Washer and dryer included; Washer/dryer hookup
Neighborhood map
What this means for you Summary
Snapshot
- This is a 4-bed/2.5-bath single-family listed at $750k.
Deal economics
- At list price, monthly cash flow is $2k ($20k/yr) — positive.
- The deal already cash-flows at list — no discount required.
- Meets the 1% rule at list price ($8k rent vs $750k).
- Recommended offer: $728k (3.0% below list) — sets the bar for market timing.
- Cap rate 9.1% vs local median 2.3% in Lake Carmel — top-decile yield for the area; either an underpriced asset or a hidden risk that comps aren't pricing in. Stress-test before assuming the spread holds.
Location & tenants
- Location reads 66/100 on livability (#650 in NY) — a middle-class / working-renter tenant base. Strengths: employment A+, housing A+; Watch: amenities F, commute F, cost of living F.
- Carmel Central School District (suburban): math 46% / reading 63% proficiency, ranked #258 of 590 in NY (top 44%) — acceptable for families but not a draw, mixed tenant base, ~2y average lease; only 17% free/reduced lunch — higher-income household profile.
- Zoned schools: Matthew Paterson Elementary School (math 47% / reading 62%, grade C, #908 of 2,108 statewide, top 46%, 488 students, 41% FRL); George Fischer Middle School (math 21% / reading 56%, grade F, #437 of 729 statewide, top 60%, 1,130 students, 38% FRL); Carmel High School (math 97% / reading 87%, grade A+, #171 of 1,100 statewide, top 18%, 1,365 students, 36% FRL) — zoned schools average 38% FRL vs 17% district-wide (22 pts higher); higher-poverty schools than district average — tighter screening recommended.
- Market conditions: 49 active listings in the ZIP; 1 comparable units currently listed for rent nearby; 142 units permitted in Putnam County in 2024 (75 in 5+ unit buildings).
Forward outlook
- Local home prices are declining (-3.0%/yr); year-one equity from $5k of loan paydown is wiped out by about $21k of value loss. Plan a longer hold.
- Putnam County population projected to shrink 3% by 2050 — rents likely to lag national; underwrite the cash flow, not the appreciation.
Negotiation context
- It's been on market 59 days — a 3% lower offer ($728k) is reasonable based on typical stale-listing flexibility.
- 7 sale attempts since 10y ago; this cycle's ask has dropped $100k (12%) from the opening price — seller is motivated, your offer sets the floor, not the list.
- Current owner paid $300k; list at $750k implies a 150% gain — meaningful room to come down on a strong offer.
Risks & watch-outs
- Climate carrying-cost: major flood risk; moderate wildfire risk — expect insurance premiums to compound above CPI over the hold.
Questions for the listing agent
- It's been on market 59 days. Have you received any prior offers? Is the seller open to a 3% concession, seller financing, or rate buy-down credit?
- Is there a deadline driving the sale (1031 exchange, divorce, estate, relocation)? That informs how much negotiation room exists.
- Schools are D-rated, which usually means shorter tenancies and higher turnover. Who's the typical renter profile here, and what's been the actual vacancy rate?
- What's the average days-on-market for RENTAL listings here right now (not sales)? A rising rental-DOM trend means longer vacancies and softer asking-rent achievability than the comps imply.
- What's the recent tenant-quality profile in this submarket — average credit score on applications, eviction rate, late-payment / NSF rate, and stable-employment percentage? A property-management company in the area should have these aggregated.
- How much new for-sale + rental construction is in the pipeline within 1–3 miles? Heavy new supply typically softens prices + rents 12–24 months out; constrained supply supports both.
Investment metrics
- 1% rule
- 1.15% ✓
- Cap rate
- 9.13%
- Cash-on-cash
- 10.13%
- DSCR
- 1.45
- GRM
- 7.2
CMA / ARV
- ARV (median comp)
- $692,930
- List price
- $750,000
- Delta
- 8.24%
- Verdict
- FAIR
- Comps
- 9 within 1.0 mi
Show comp detail 1 sale within ~0.75 mi
| Address | Dist | Beds/Ba | Sqft | Sold | Price | $/sf | Match |
|---|---|---|---|---|---|---|---|
| 281 Mcmanus Rd N | 0.49mi | 3/3.0 (-1) | 2,288 (-8%) | 9mo | $590,000 | $258 | 48 |
Match score weights: distance 35% · size 25% · config 20% · recency 20%. Top-matched comps best support the ARV.
Projected returns pro-forma
-3.0% appreciation · 3.0% rent growth · sell at horizon
- IRR
- -1.1%
- Equity multiple
- 0.96×
- Total profit
- $-7,865
- Equity at exit
- $103,318
- IRR
- 8.6%
- Equity multiple
- 1.66×
- Total profit
- $127,761
- Equity at exit
- $59,912
Cash invested: $194,020 (down + closing). Projections, not guarantees.
Landlord ↔ Tenant lean methodology
- Overall (STATE)
- 15 Strongly Tenant-Friendly
- State New York
- 15 Strongly Tenant-Friendly · D+10
- County
- — inherits STATE
- City
- — inherits STATE
ZIP-level market 12563
- Home prices YoY
- -12.7%
- Active inventory
- 49
- Price-to-rent
- 7.8×
Monthly cashflow live
- Estimated rent
- $8,000 medium interval (Pro) →
- Mortgage (P&I)
- −$3,634
- Tax from tax record
- −$759 /mo · $9,106/yr
- Insurance
- −$289
- HOA
- −$0
- Vacancy / Maint / Mgmt
- −$1,680
- Net cashflow
- $1,639
Break-even live
Sensitivity live
| Price | -10% $2,031 | -5% $1,835 | +0% $1,639 | +5% $1,442 | +10% $1,246 |
|---|---|---|---|---|---|
| Rent | -10% $1,007 | -5% $1,323 | +0% $1,639 | +5% $1,955 | +10% $2,271 |
| Rate | -1.0pp $1,988 | -0.5pp $1,815 | base $1,639 | +0.5pp $1,459 | +1.0pp $1,276 |
UW: 25.0% down · 7.5% · 30yr · 1.5% tax · 5.0% vac · 8.0% maint · 8.0% mgmt
Financing live
Cash to close
- Down payment
- $173,232
- Closing costs
- $20,788
- Reserves months
- —
- Total cash needed
- —
Loan-product check · same deal, 3 products live
Conventional
25% down · 7.5% · 30yr
- Down + closing
- —
- Monthly P&I
- —
- Monthly cashflow
- —
- DSCR
- —
- Eligible?
- —
Personal DTI + credit; lowest rate.
DSCR
20% down · 8.5% · 30yr
- Down + closing
- —
- Monthly P&I
- —
- Monthly cashflow
- —
- DSCR
- —
- Eligible?
- —
No personal income docs; deal must DSCR.
Hard money
10% down · 12.0% · 12mo
- Down + closing
- —
- Monthly P&I
- —
- Monthly cashflow
- —
- DSCR
- —
- Eligible?
- —
Short-term bridge; refi at stabilization.
Rent comps 1 comps
| Address | Beds | Baths | Sqft | Rent | $/sqft | DOM | Units | Dist |
|---|---|---|---|---|---|---|---|---|
| 90 Cushman Rd Patterson, NY | 3.0 | 2.0 | 2286 | $8,000 | $3.50 | 13d | 1 | 0.28mi |
Listing history 38 events
-
2026-06-21days on market $750,000 Active 59 DOM
-
2026-06-18days on market $750,000 Active 56 DOM
-
2026-06-17days on market $750,000 Active 55 DOM
-
2026-06-16days on market $750,000 Active 54 DOM
-
2026-06-15days on market $750,000 Active 53 DOM
-
2026-06-14days on market $750,000 Active 51 DOM
-
2026-06-13days on market $750,000 Active 50 DOM
-
2026-06-10days on market $750,000 Active 48 DOM
-
2026-06-09days on market $750,000 Active 47 DOM
-
2026-06-08days on market $750,000 Active 46 DOM
-
2026-06-07days on market $750,000 Active 45 DOM
-
2026-06-05days on market $750,000 Active 42 DOM
-
2026-06-03days on market $750,000 Active 41 DOM
-
2026-06-02days on market $750,000 Active 40 DOM
-
2026-06-01pricedays on market $750,000 Active 39 DOM
-
2026-05-31days on market $850,000 Active 38 DOM
-
2026-05-30days on market $850,000 Active 37 DOM
-
2026-04-23$850,000 Active 1425-char remark
-
2026-04-21historical
-
2026-02-11price $899,000
-
2025-11-10price $990,000
-
2025-10-30$1,200,000 Active
-
2025-10-28$1,200,000 Active
Show marketing remark (533 chars)
New custom built colonial inspired smart home in Patterson NY. Constructed with the highest quality materials by trusted local contractors. A modern, energy efficient, zero emissions home. Located in an extraordinarily desirable location of town. Surrounded by pristine nature and quaint equine properties. Nestled along a quiet historic road, this neighborhood has a country atmosphere in a friendly community that's great for families. Large yard with a generous outdoor deck, perfect for enjoying our famous Hudson valley sunsets.
-
2024-06-04soldstatus $300,000
-
2024-06-04soldstatus $155,000
-
2024-05-02soldstatus $155,000 Closed
-
2023-11-18status Pending
-
2023-02-28price $189,000
-
2023-01-02$239,000 Active
-
2019-03-01historical
-
2018-09-30$149,000 Active
-
2018-06-29historical
-
2018-02-24price $149,000
-
2018-01-11price $139,000
-
2017-11-06price $109,000
-
2017-06-28$119,500 Active
-
2017-05-11historical
-
2016-11-10$129,000 Active
ⓘ Source: listings_history table (triggers on properties + properties_extension) + one-shot
backfill from property_details.listing_events for pre-trigger history.
Tax reassessment forecast NY · Partial reset (capped growth)
- Current annual tax
- $9,106 · $759/mo
- Projected year-2 tax
- $10,891 · $908/mo
- Expected delta
- +$1,784/yr (+$149/mo · 19.6%)
ⓘ Screening estimate from a state-policy table — verify with the county assessor before closing.
Climate risk First Street
- Flood 6/10 Major FEMA zone X (unshaded) · 71% chance over 30 yrs
- Wildfire 5/10 Major
- Heat 4/10 Moderate 7 d/yr ≥97°F today · 15 d/yr by 30 yrs out
- Wind 4/10 Moderate 17% chance of damaging wind over 30 yrs
- Air quality 3/10 Moderate 2 unhealthy d/yr today · 3 by 30 yrs out
Nearby sold comps map
Loading sold comps map…
Walkable amenities ~0.75 mi
Loading nearby amenities…
Taxation est. · year 1
- Rental income
- $96,000
- − Mortgage interest
- −$38,815
- − Property taxes
- −$9,106
- − Insurance
- −$3,465
- − Repairs & maintenance
- −$7,680
- − Management
- −$7,680
- − Depreciation
- −$20,158
- Taxable income
- $9,096
- Est. tax owed @ 24.0%
- −$2,183
- After-tax cash flow
- $17,480/yr
For passive investors: Depreciation is non-cash, so a rental often shows a tax loss while cash-flowing — sheltering income. Rental losses are passive: they offset passive income freely, and up to $25,000/yr can offset ordinary (W-2) income if you actively participate and your MAGI is under $100k (phasing out to $0 by $150k); unused losses carry forward. On sale, claimed depreciation is recaptured at up to 25%, and gains may owe capital-gains tax (a 1031 exchange can defer both). Figures are a year-1 estimate at your 24.0% rate — not tax advice; consult a CPA.
Schools (NCES district)
- District
- Carmel Central School District
- NCES district ID
- 3606570
- Math proficiency
- 46% ▼ -15.00%
- Reading proficiency
- 63% ▲ 11.00%
- Median HH income
- $87,665
- Composite
- 50.05/100
- National rank
- #1914
- State rank
- #258 of 590 in NY
Livability — Lake Carmel
- Score
- 66/100
- State rank
- #650
- US rank
- #12139
Category grades
Schools grade is shown separately in the Schools card above.
Census & demographics
- Population (ZIP)
- 7,456
Population outlook (Putnam County) Hauer SSP2
- Today (2025)
- 99,705 people
- By 2030
- 99,650 · -0.1%
- By 2040
- 98,641 · -1.1%
- By 2050
- 96,348 · -3.4%
- By 2075
- 94,412 · -5.3%
- By 2100
- 88,728 · -11.0%
Race, ethnicity, and origin ACS 2023
- Neighborhood character
- Predominantly White (69%)
- Race & ethnicity
- White 69% Hispanic / Latino 17% Black 9% Two or more races 6% Asian 2%
- Hispanic origin (detail)
- Mexican 4% Puerto Rican 3% Cuban 1% Dominican 3%
- Common ancestry
- Romanian 5% Portuguese 2% Slovak 1%
- Foreign-born
- 14% · Canada, South Korea, Dominican Republic
- Languages at home
- 79% English-only · Spanish 12% Other Indo-European 3% Russian/Polish/Slavic 2%
Political lean MEDSL · Putnam
- 2024 margin
- R (+13.7) · D 43.2% · R 56.8%
- 2008→2024 swing
- -6.2pp toward R · 2008: -7.5pp · 2024: -13.7pp
- All cycles
- 2024: R+13.7 2020: R+7.9 2016: R+17.8 2012: R+11.2 2008: R+7.5
Not yet ingested
- Civics
- —
Market trends
- HPI YoY
- ▼ -36.07%
- Current HPI
- 247.1582
- Rent YoY
- —
- Metro
- —
- State GDP YoY
- ▲ 2.60%
- F500 in state
- 92
Industry mix (Fortune 500 HQ in NY)
| Industry | F500 HQs | Revenue |
|---|---|---|
| Financial Services | 10 | $950B |
|
||
| Consumer Goods | 9 | $162B |
|
||
| Insurance | 4 | $225B |
|
||
| Telecommunications | 2 | $144B |
|
||
| Pharmaceuticals | 2 | $112B |
|
||
| Media / Entertainment | 2 | $69B |
|
||
Price history
+481.4% since first listed22 events — show timeline
- 2026-06-01 Price Changed $750,000 OneKey® MLS as Distributed by MLS Grid
- 2026-04-23 Listed $850,000 OneKey® MLS as Distributed by MLS Grid
- 2026-04-21 Listing Removed — OneKey® MLS as Distributed by MLS Grid
- 2026-02-11 Price Changed $899,000 OneKey® MLS as Distributed by MLS Grid
- 2025-11-10 Price Changed $990,000 OneKey® MLS as Distributed by MLS Grid
- 2025-10-30 Listed $1,200,000 OneKey® MLS as Distributed by MLS Grid
- 2025-10-28 Listed $1,200,000 Fizber.com
- 2024-06-04 Sold (Public Records) $155,000 Public Records
- 2024-06-04 Sold (Public Records) $300,000 Public Records
- 2024-05-02 Sold (MLS) $155,000 OneKey® MLS as Distributed by MLS Grid
- 2023-11-18 Pending — OneKey® MLS as Distributed by MLS Grid
- 2023-02-28 Price Changed $189,000 OneKey® MLS as Distributed by MLS Grid
- 2023-01-02 Listed $239,000 OneKey® MLS as Distributed by MLS Grid
- 2019-03-01 Listing Removed — OneKey® MLS as Distributed by MLS Grid
- 2018-09-30 Listed $149,000 OneKey® MLS as Distributed by MLS Grid
- 2018-06-29 Listing Removed — OneKey® MLS as Distributed by MLS Grid
- 2018-02-24 Price Changed $149,000 OneKey® MLS as Distributed by MLS Grid
- 2018-01-11 Price Changed $139,000 OneKey® MLS as Distributed by MLS Grid
- 2017-11-06 Price Changed $109,000 OneKey® MLS as Distributed by MLS Grid
- 2017-06-28 Listed $119,500 OneKey® MLS as Distributed by MLS Grid
- 2017-05-11 Listing Removed — OneKey® MLS as Distributed by MLS Grid
- 2016-11-10 Listed $129,000 OneKey® MLS as Distributed by MLS Grid
Property tax history
+15.1%/yrLatest (2025): $9,106 · +455.0% YoY. Source: county tax records.
Cash-flow waterfall
monthlySold comps — $/sqft
last 12 mo · ≤1 miLoading sold comps…