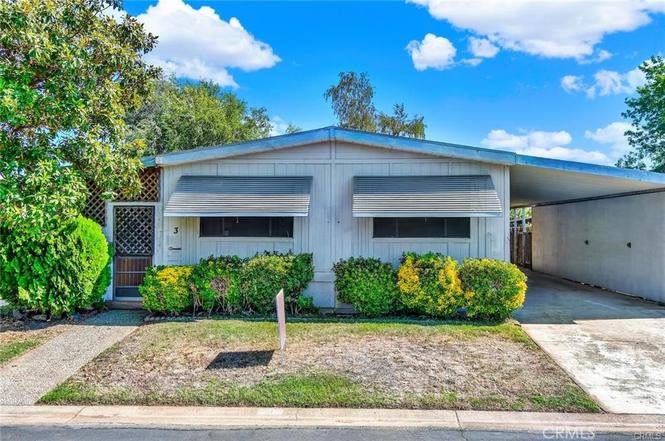
3835 GARDINER Fry #3 · Vina, CA
Flood risk 4/10 · Minor
- FEMA flood zone
- X (unshaded)
- Chance of flooding over 30 yrs
- 0.21%
- Est. flood insurance / yr
- $507 – $1,088
Fire risk 8/10 · Major
- Est. fire insurance / yr
- $659 – $1,223
Heat risk 8/10 · Major
- Hot days now (above 106°F)
- 7 days/yr
- Hot days in 30 yrs
- 16 days/yr
Wind risk 1/10 · Minimal
- Chance of severe wind over 30 yrs
- —
Air-quality risk 10/10 · Severe
- Unhealthy air days now
- 35 days/yr
- Unhealthy air days in 30 yrs
- 38 days/yr
Risk factors via First Street. Map © Google.
Why this score? — see what drove the B grade
The composite is a weighted blend of 9 inputs, each scored 0–100. Each bar is that input's sub-score; the figure is the points it added to the 100-point composite (weight × sub-score).
- Cash flow +30.0/30.0
- ARV discount +15.0/15.0
- 1% rule +10.0/10.0
- DSCR +10.0/10.0
- Rent growth +2.5/5.0
- Schools +2.5/10.0
- Condition / age +2.5/5.0
- Livability +2.2/5.0
- Appreciation +0.0/10.0
$75,000
🖨 Deal sheet 📄 Offer letter ✓ Due diligence
Listing remarks
WELCOME TO THE WOODSON BRIDGE SENIOR PARK, ONE OF THE MOST WELL DESIRED PARKS IN NORTHERN CALIFORNIA. FEATURING A VERY LARGE LIVING ROOM. A COUNTRY STYLE KITCHEN WITH LOTS OF COUNTER SPACE AND AMPLE CUPBOARD SPACE. LARGE LAUNDRY ROOM AND 2 GOOD SIZED BEDROOMS. OUTSIDE HAS A CUTE BACK YARD WITH A WORK SHED. THERE IS A LONG CARPORT THAT SHOULD HOLD 2 CARS. THE PARK FEATURES A HUGE CLUB HOUSE, NICE SIZE SWIMMING POOL AND JACUZZI. JUST ACCROSS THE WAY FROM THE PARK IS THE HISTORICAL SACRAMENTO RIVER. THERE IS A NICE STORE JUST DOWN THE ROAD FOR ALL OF THE NECESSARY ITEMS YOU MAY NEED AS WELL. DO NOT MISS OUT ON THIS WONDERFUL OPPORTUNITY TO OWN A HOME IN SUCH A BEAUTIFUL SENIOR COMMUNITY!
Key facts
- Cute back yard
- Swimming pool
- Work shed
Tags
Property features AI
Finance
- Financial info: Land lease of $720
- HOA & community: Part of an association; Senior community; Community amenities include horse trails, golf course, biking, hiking, fishing, and park access
Exterior
- Parking: Located in the Woodson Bridge park
- Utilities: Shared well water; Community septic
- Home design: Single-story home; Mobile home (model LAJ1593); Mobile home remains on site
- Construction: Built (year source: Assessor); Mobile construction; 31 ft by 40 ft unit dimensions
- Exterior features: Community pool; Front yard; Back yard; 0–1 unit per acre
Interior
- Bathrooms: Two full bathrooms; Bathtub in bathroom(s)
- Heating & cooling: Central cooling; Central furnace heating
- Interior features: Entry is on the main level
- Laundry & utility: Laundry in a dedicated room
Neighborhood map
What this means for you Summary
Snapshot
- This is a 2-bed/2.0-bath manufactured listed at $75k.
Deal economics
- At list price, monthly cash flow is $593 ($7k/yr) — positive.
- The deal already cash-flows at list — no discount required.
- Meets the 1% rule at list price ($1k rent vs $75k).
- Recommended offer: $66k (12.0% below list) — sets the bar for market timing.
Location & tenants
- Location reads 44/100 on livability (#1,345 in CA) — a working-class tenant base; expect higher turnover. Strengths: housing A+, crime A; Watch: schools F, amenities F, commute F.
- Corning Union High (rural): math 12% / reading 41% proficiency, ranked #1,151 of 1,400 in CA (top 82%) — low school quality limits family demand, transient renter base, plan for 1-2y turnover.
- Market conditions: 175 active listings in the ZIP; 186 units permitted in Tehama County in 2024 (0 in 5+ unit buildings).
Forward outlook
- Local home prices are declining (-3.0%/yr); year-one equity from $519 of loan paydown is wiped out by about $2k of value loss. Plan a longer hold.
- Tehama County population projected at -14% by 2050 — secular population decline; favor cash flow + early exit over multi-decade hold.
- At projected returns (-3.0% appreciation + 3.0% rent growth), your $21k cash investment doubles in ~4 years — after that, you're playing with house money.
Negotiation context
- It's been on market 238 days — a 12% lower offer ($66k) is reasonable based on typical stale-listing flexibility.
- 2 sale attempts since 2y ago; this cycle's ask has dropped $15k (17%) from the opening price — seller is motivated, your offer sets the floor, not the list.
Risks & watch-outs
- Climate carrying-cost: severe wildfire risk; extreme-heat days projected 7→16/yr by 2055 (HVAC capex compounding) — expect insurance premiums to compound above CPI over the hold.
Questions for the listing agent
- It's been on market 238 days. Have you received any prior offers? Is the seller open to a 12% concession, seller financing, or rate buy-down credit?
- Why hasn't it sold? Are there any deal-killer items the seller is aware of (foundation, flood, title, zoning, code violations)?
- Is there a deadline driving the sale (1031 exchange, divorce, estate, relocation)? That informs how much negotiation room exists.
- Schools are F-rated, which usually means shorter tenancies and higher turnover. Who's the typical renter profile here, and what's been the actual vacancy rate?
- What's the average days-on-market for RENTAL listings here right now (not sales)? A rising rental-DOM trend means longer vacancies and softer asking-rent achievability than the comps imply.
- What's the recent tenant-quality profile in this submarket — average credit score on applications, eviction rate, late-payment / NSF rate, and stable-employment percentage? A property-management company in the area should have these aggregated.
- How much new for-sale + rental construction is in the pipeline within 1–3 miles? Heavy new supply typically softens prices + rents 12–24 months out; constrained supply supports both.
Investment metrics
- 1% rule
- 1.81% ✓
- Cap rate
- 15.78%
- Cash-on-cash
- 33.87%
- DSCR
- 2.51
- GRM
- 4.6
CMA / ARV
- ARV (on-the-fly)
- $118,560
- Comps found
- 4
Show comp detail 4 sales within ~0.75 mi
| Address | Dist | Beds/Ba | Sqft | Sold | Price | $/sf | Match |
|---|---|---|---|---|---|---|---|
| 3835 Gardiner Ferry Rd #89 | 0.00mi | 2/2.0 | 1,248 (0%) | 23mo | $95,000 | $76 | 81 |
| 3835 Gardiner Ferry Rd #1 | 0.00mi | 2/2.0 | 1,416 (+14%) | 3mo | $135,000 | $95 | 75 |
| 3835 Gardiner Ferry Rd Rd #76 | 0.00mi | 3/2.0 (+1) | 1,223 (-2%) | 24mo | $115,000 | $94 | 72 |
| 3835 GARDINER Fry #95 | 0.00mi | 2/2.0 | 1,152 (-8%) | 19mo | $115,000 | $100 | 71 |
Match score weights: distance 35% · size 25% · config 20% · recency 20%. Top-matched comps best support the ARV.
Projected returns pro-forma
-3.0% appreciation · 3.0% rent growth · sell at horizon
- IRR
- 29.2%
- Equity multiple
- 2.22×
- Total profit
- $25,598
- Equity at exit
- $11,183
- IRR
- 36.6%
- Equity multiple
- 4.38×
- Total profit
- $70,889
- Equity at exit
- $6,485
Cash invested: $21,000 (down + closing). Projections, not guarantees.
Landlord ↔ Tenant lean methodology
- Overall (STATE)
- 18 Strongly Tenant-Friendly
- State California
- 18 Strongly Tenant-Friendly · D+13
- County
- — inherits STATE
- City
- — inherits STATE
ZIP-level market 96021
- Home prices YoY
- -34.8%
- Active inventory
- 175
- Price-to-rent
- 4.6×
Monthly cashflow live
- Estimated rent
- $1,355 medium interval (Pro) →
- Mortgage (P&I)
- −$393
- Tax from tax record
- −$53 /mo · $634/yr
- Insurance
- −$31
- HOA
- −$0
- Vacancy / Maint / Mgmt
- −$284
- Net cashflow
- $593
Break-even live
UW: 25.0% down · 7.5% · 30yr · 1.5% tax · 5.0% vac · 8.0% maint · 8.0% mgmt
Financing live
Cash to close
- Down payment
- $18,750
- Closing costs
- $2,250
- Reserves months
- —
- Total cash needed
- —
Loan-product check · same deal, 3 products live
Conventional
25% down · 7.5% · 30yr
- Down + closing
- —
- Monthly P&I
- —
- Monthly cashflow
- —
- DSCR
- —
- Eligible?
- —
Personal DTI + credit; lowest rate.
DSCR
20% down · 8.5% · 30yr
- Down + closing
- —
- Monthly P&I
- —
- Monthly cashflow
- —
- DSCR
- —
- Eligible?
- —
No personal income docs; deal must DSCR.
Hard money
10% down · 12.0% · 12mo
- Down + closing
- —
- Monthly P&I
- —
- Monthly cashflow
- —
- DSCR
- —
- Eligible?
- —
Short-term bridge; refi at stabilization.
Listing history 22 events
-
2026-06-19days on market $75,000 Active 238 DOM
-
2026-06-18days on market $75,000 Active 237 DOM
-
2026-06-17days on market $75,000 Active 236 DOM
-
2026-06-16days on market $75,000 Active 235 DOM
-
2026-06-15days on market $75,000 Active 234 DOM
-
2026-06-14days on market $75,000 Active 232 DOM
-
2026-06-13days on market $75,000 Active 231 DOM
-
2026-06-10days on market $75,000 Active 229 DOM
-
2026-06-09days on market $75,000 Active 228 DOM
-
2026-06-08days on market $75,000 Active 227 DOM
-
2026-06-07days on market $75,000 Active 226 DOM
-
2026-06-05days on market $75,000 Active 223 DOM
-
2026-06-03days on market $75,000 Active 222 DOM
-
2026-06-02days on market $75,000 Active 221 DOM
-
2026-06-01days on market $75,000 Active 220 DOM
-
2026-05-31days on market $75,000 Active 219 DOM
-
2026-05-30days on market $75,000 Active 218 DOM
-
2026-03-26price $75,000
-
2025-10-24$90,000 Active
-
2025-07-17historical
-
2024-09-03price $99,000
-
2024-07-20$125,000 Active
ⓘ Source: listings_history table (triggers on properties + properties_extension) + one-shot
backfill from property_details.listing_events for pre-trigger history.
Tax reassessment forecast CA · Resets to sale price
- Current annual tax
- $634 · $53/mo
- Projected year-2 tax
- $634 · $53/mo
- Expected delta
- $0/yr ($0/mo · 0.0%)
ⓘ Screening estimate from a state-policy table — verify with the county assessor before closing.
Climate risk First Street
- Flood 4/10 Moderate FEMA zone X (unshaded) · 21% chance over 30 yrs
- Wildfire 8/10 Severe
- Heat 8/10 Severe 7 d/yr ≥106°F today · 16 d/yr by 30 yrs out
- Wind 1/10 Low
- Air quality 10/10 Extreme 35 unhealthy d/yr today · 38 by 30 yrs out
Nearby sold comps map
Loading sold comps map…
Walkable amenities ~0.75 mi
Loading nearby amenities…
Taxation est. · year 1
- Rental income
- $16,256
- − Mortgage interest
- −$4,201
- − Property taxes
- −$634
- − Insurance
- −$375
- − Repairs & maintenance
- −$1,300
- − Management
- −$1,300
- − Depreciation
- −$2,182
- Taxable income
- $6,263
- Est. tax owed @ 24.0%
- −$1,503
- After-tax cash flow
- $5,611/yr
For passive investors: Depreciation is non-cash, so a rental often shows a tax loss while cash-flowing — sheltering income. Rental losses are passive: they offset passive income freely, and up to $25,000/yr can offset ordinary (W-2) income if you actively participate and your MAGI is under $100k (phasing out to $0 by $150k); unused losses carry forward. On sale, claimed depreciation is recaptured at up to 25%, and gains may owe capital-gains tax (a 1031 exchange can defer both). Figures are a year-1 estimate at your 24.0% rate — not tax advice; consult a CPA.
Schools (NCES district)
- District
- Corning Union High
- NCES district ID
- 0609810
- Math proficiency
- 12% ▼ -10.00%
- Reading proficiency
- 41% ▼ -2.00%
- Median HH income
- $39,060
- Composite
- 25.18/100
- National rank
- #12925
- State rank
- #1151 of 1400 in CA
Livability — Vina
- Score
- 44/100
- State rank
- #1345
- US rank
- #26820
Category grades
Schools grade is shown separately in the Schools card above.
Census & demographics
- Population (ZIP)
- 15,076
Population outlook (Tehama County) Hauer SSP2
- Today (2025)
- 61,058 people
- By 2030
- 59,493 · -2.6%
- By 2040
- 56,076 · -8.2%
- By 2050
- 52,372 · -14.2%
- By 2075
- 43,895 · -28.1%
- By 2100
- 34,186 · -44.0%
Race, ethnicity, and origin ACS 2023
- Neighborhood character
- Diverse neighborhood (Simpson 0.55)
- Race & ethnicity
- Hispanic / Latino 51% White 44% Two or more races 20% Asian 3%
- Hispanic origin (detail)
- Mexican 46%
- Common ancestry
- Slovak 2% Serbian 2% Portuguese 1%
- Foreign-born
- 23% · Canada
- Languages at home
- 59% English-only · Spanish 40%
Political lean MEDSL · Tehama
- 2024 margin
- Solid R (+41.8) · D 27.9% · R 69.7% · Other 2.3%
- 2008→2024 swing
- -17.7pp toward R · 2008: -24.1pp · 2024: -41.8pp
- All cycles
- 2024: R+41.8 2020: R+35.6 2016: R+36.8 2012: R+27.4 2008: R+24.1
Not yet ingested
- Civics
- —
Market trends
- HPI YoY
- ▼ -145.81%
- Current HPI
- 272.9407
- Rent YoY
- —
- Metro
- —
- State GDP YoY
- ▲ 3.21%
- F500 in state
- 116
Industry mix (Fortune 500 HQ in CA)
| Industry | F500 HQs | Revenue |
|---|---|---|
| Technology | 27 | $1,492B |
|
||
| Financial Services | 3 | $174B |
|
||
| Retail | 3 | $44B |
|
||
| Insurance | 3 | $26B |
|
||
| Media / Entertainment | 2 | $115B |
|
||
| Pharmaceuticals / Biotech | 2 | $62B |
|
||
Price history
-40.0% since first listed5 events — show timeline
- 2026-03-26 Price Changed $75,000 CRMLS
- 2025-10-24 Listed $90,000 CRMLS
- 2025-07-17 Listing Removed — CRMLS
- 2024-09-03 Price Changed $99,000 CRMLS
- 2024-07-20 Listed $125,000 CRMLS
Property tax history
+15.2%/yrLatest (2025): $634 · +111.0% YoY. Source: county tax records.
Cash-flow waterfall
monthlySold comps — $/sqft
last 12 mo · ≤1 miLoading sold comps…