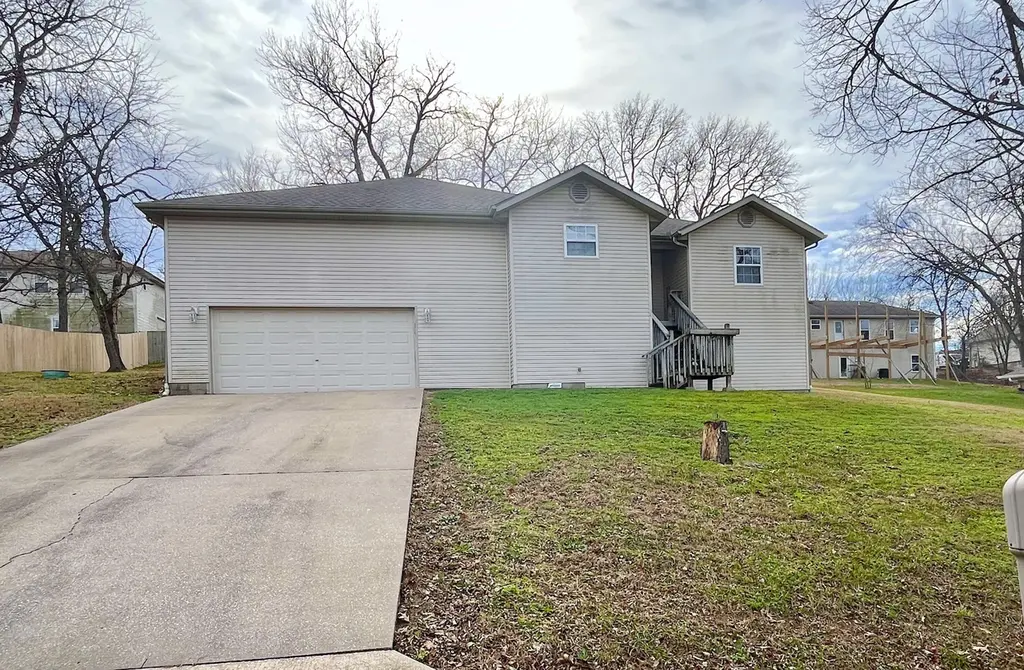
134 Wright Rd · Kimberling City, MO
Flood risk 1/10 · Minimal
- FEMA flood zone
- X (unshaded)
- Chance of flooding over 30 yrs
- 0.0%
- Est. flood insurance / yr
- $507 – $1,088
Fire risk 3/10 · Minor
- Est. fire insurance / yr
- $1,054 – $1,958
Heat risk 5/10 · Moderate
- Hot days now (above 104°F)
- 7 days/yr
- Hot days in 30 yrs
- 21 days/yr
Wind risk 2/10 · Minimal
- Chance of severe wind over 30 yrs
- 1.0%
Air-quality risk 1/10 · Minimal
- Unhealthy air days now
- 0 days/yr
- Unhealthy air days in 30 yrs
- 0 days/yr
Risk factors via First Street. Map © Google.
Why this score? — see what drove the C- grade
The composite is a weighted blend of 9 inputs, each scored 0–100. Each bar is that input's sub-score; the figure is the points it added to the 100-point composite (weight × sub-score).
- Cash flow +15.9/30.0
- ARV discount +15.0/15.0
- DSCR +4.9/10.0
- Appreciation +3.9/10.0
- 1% rule +3.6/10.0
- Livability +3.5/5.0
- Schools +3.2/10.0
- Rent growth +2.5/5.0
- Condition / age +2.5/5.0
$179,900
🖨 Deal sheet (PDF) 📄 Offer letter ✓ Due diligence
Listing remarks MLS
This spacious three-bedroom, two-bath home welcomes you with charming wood steps leading to the front door. Inside, the layout offers comfortable living and functional spaces throughout, along with ample closet storage. The large garage provides extra room for storage or projects, and the expansive backyard offers endless possibilities for outdoor activities--bringing together space, versatility, and opportunity to make it your own.
Key facts
- Ample closet storage
- Large garage
- Expansive backyard
Tags
Neighborhood map
What this means for you Summary
Snapshot
- This is a 3-bed/2.0-bath other listed at $180k.
Deal economics
- At list price, monthly cash flow is $85 ($1k/yr) — positive.
- The deal already cash-flows at list — no discount required.
- To meet the 1% rule (rent ≥ 1% of price), the offer needs to be $155k (13.8% below list).
- Recommended offer: $155k (13.8% below list) — sets the bar for 1% rule.
- Cap rate 6.9% vs local median 1.6% in Kimberling City — top-decile yield for the area; either an underpriced asset or a hidden risk that comps aren't pricing in. Stress-test before assuming the spread holds.
Location & tenants
- Location reads 69/100 on livability (#162 in MO) — a middle-class / working-renter tenant base. Strengths: crime A+, cost of living A+, housing A+; Watch: health & safety C-, schools D, employment D.
- Reeds Spring R-IV (rural): math 34% / reading 42% proficiency, ranked #182 of 324 in MO (top 56%) — families likely to look elsewhere, expect single-tenant / working-renter base with shorter leases.
- Market conditions: 342 active listings in the ZIP; 1 comparable units currently listed for rent nearby; 191 units permitted in Stone County in 2024 (0 in 5+ unit buildings).
Forward outlook
- Local home prices are declining (-2.2%/yr); year-one equity from $1k of loan paydown is wiped out by about $4k of value loss. Plan a longer hold.
- Stone County population projected at -30% by 2050 — secular population decline; favor cash flow + early exit over multi-decade hold.
Negotiation context
- It's been on market 159 days — a 12% lower offer ($158k) is reasonable based on typical stale-listing flexibility.
- 8 sale attempts since 18y ago; this cycle's ask has dropped $20k (10%) from the opening price — seller is motivated, your offer sets the floor, not the list.
Risks & watch-outs
- Climate carrying-cost: extreme-heat days projected 7→21/yr by 2055 (HVAC capex compounding) — expect insurance premiums to compound above CPI over the hold.
Questions for the listing agent
- It's been on market 159 days. Have you received any prior offers? Is the seller open to a 14% concession, seller financing, or rate buy-down credit?
- What does the HOA fee cover, when was the last increase, and are there any pending special assessments or reserve-fund shortfalls?
- Why hasn't it sold? Are there any deal-killer items the seller is aware of (foundation, flood, title, zoning, code violations)?
- Is there a deadline driving the sale (1031 exchange, divorce, estate, relocation)? That informs how much negotiation room exists.
- Schools are D-rated, which usually means shorter tenancies and higher turnover. Who's the typical renter profile here, and what's been the actual vacancy rate?
- What's the average days-on-market for RENTAL listings here right now (not sales)? A rising rental-DOM trend means longer vacancies and softer asking-rent achievability than the comps imply.
- What's the recent tenant-quality profile in this submarket — average credit score on applications, eviction rate, late-payment / NSF rate, and stable-employment percentage? A property-management company in the area should have these aggregated.
- How much new for-sale + rental construction is in the pipeline within 1–3 miles? Heavy new supply typically softens prices + rents 12–24 months out; constrained supply supports both.
Investment metrics
- 1% rule
- 0.86% ✗
- Cap rate
- 6.86%
- Cash-on-cash
- 2.03%
- DSCR
- 1.09
- GRM
- 9.7
CMA / ARV
- ARV (median comp)
- $258,438
- List price
- $179,900
- Delta
- -30.39%
- Verdict
- UNDERPRICED
- Comps
- 20 within 1.0 mi
Projected returns pro-forma
-2.17% appreciation · 3.0% rent growth · sell at horizon
- IRR
- -8.8%
- Equity multiple
- 0.65×
- Total profit
- $-17,487
- Equity at exit
- $33,515
- IRR
- -0.7%
- Equity multiple
- 0.94×
- Total profit
- $-2,859
- Equity at exit
- $27,296
Cash invested: $50,372 (down + closing). Projections, not guarantees.
Landlord ↔ Tenant lean methodology
- Overall (STATE)
- 81 Strongly Landlord-Friendly
- State Missouri
- 81 Strongly Landlord-Friendly · R+10
- County
- — inherits STATE
- City
- — inherits STATE
ZIP-level market 65737
- Home prices YoY
- -0.9%
- Active inventory
- 342
- Price-to-rent
- 9.7×
Monthly cashflow live
- Estimated rent
- $1,550 medium interval (Pro) →
- Mortgage (P&I)
- −$943
- Tax from tax record
- −$81 /mo · $973/yr
- Insurance
- −$75
- HOA
- −$40
- Vacancy / Maint / Mgmt
- −$326
- Net cashflow
- $85
Break-even live
Sensitivity live
| Price | -10% $187 | -5% $136 | +0% $85 | +5% $34 | +10% $-17 |
|---|---|---|---|---|---|
| Rent | -10% $-37 | -5% $24 | +0% $85 | +5% $146 | +10% $207 |
| Rate | -1.0pp $176 | -0.5pp $131 | base $85 | +0.5pp $38 | +1.0pp $-9 |
UW: 25.0% down · 7.5% · 30yr · 1.5% tax · 5.0% vac · 8.0% maint · 8.0% mgmt
Financing live
Cash to close
- Down payment
- $44,975
- Closing costs
- $5,397
- Reserves months
- —
- Total cash needed
- —
Loan-product check · same deal, 3 products live
Conventional
25% down · 7.5% · 30yr
- Down + closing
- —
- Monthly P&I
- —
- Monthly cashflow
- —
- DSCR
- —
- Eligible?
- —
Personal DTI + credit; lowest rate.
DSCR
20% down · 8.5% · 30yr
- Down + closing
- —
- Monthly P&I
- —
- Monthly cashflow
- —
- DSCR
- —
- Eligible?
- —
No personal income docs; deal must DSCR.
Hard money
10% down · 12.0% · 12mo
- Down + closing
- —
- Monthly P&I
- —
- Monthly cashflow
- —
- DSCR
- —
- Eligible?
- —
Short-term bridge; refi at stabilization.
Rent comps 1 comps
| Address | Beds | Baths | Sqft | Rent | $/sqft | DOM | Units | Dist |
|---|---|---|---|---|---|---|---|---|
| 260 Terrace Crest Ln Reeds Spring, MO | 3.0 | 2.0 | 1500 | $1,550 | $1.03 | 44d | 1 | 0.25mi |
HOA detail
- Monthly dues
- $40 · $480/yr
Listing history 28 events
-
2026-06-19days on market $179,900 Active 159 DOM
-
2026-06-18days on market $179,900 Active 158 DOM
-
2026-06-17days on market $179,900 Active 157 DOM
-
2026-06-16days on market $179,900 Active 156 DOM
-
2026-06-15days on market $179,900 Active 155 DOM
-
2026-06-14days on market $179,900 Active 153 DOM
-
2026-06-12days on market $179,900 Active 152 DOM
-
2026-06-09days on market $179,900 Active 149 DOM
-
2026-06-08days on market $179,900 Active 148 DOM
-
2026-06-07days on market $179,900 Active 147 DOM
-
2026-06-05days on market $179,900 Active 144 DOM
-
2026-06-03days on market $179,900 Active 143 DOM
-
2026-06-02days on market $179,900 Active 142 DOM
-
2026-06-01days on market $179,900 Active 141 DOM
-
2026-05-31days on market $179,900 Active 140 DOM
-
2026-05-30days on market $179,900 Active 139 DOM
-
2026-04-10price $184,900 436-char remark
Show marketing remark (436 chars)
This spacious three-bedroom, two-bath home welcomes you with charming wood steps leading to the front door. Inside, the layout offers comfortable living and functional spaces throughout, along with ample closet storage. The large garage provides extra room for storage or projects, and the expansive backyard offers endless possibilities for outdoor activities--bringing together space, versatility, and opportunity to make it your own.
-
2026-03-12price $189,900 436-char remark
Show marketing remark (436 chars)
This spacious three-bedroom, two-bath home welcomes you with charming wood steps leading to the front door. Inside, the layout offers comfortable living and functional spaces throughout, along with ample closet storage. The large garage provides extra room for storage or projects, and the expansive backyard offers endless possibilities for outdoor activities--bringing together space, versatility, and opportunity to make it your own.
-
2026-02-17price $197,500 436-char remark
Show marketing remark (436 chars)
This spacious three-bedroom, two-bath home welcomes you with charming wood steps leading to the front door. Inside, the layout offers comfortable living and functional spaces throughout, along with ample closet storage. The large garage provides extra room for storage or projects, and the expansive backyard offers endless possibilities for outdoor activities--bringing together space, versatility, and opportunity to make it your own.
-
2026-01-11$199,900 Active 436-char remark
Show marketing remark (436 chars)
This spacious three-bedroom, two-bath home welcomes you with charming wood steps leading to the front door. Inside, the layout offers comfortable living and functional spaces throughout, along with ample closet storage. The large garage provides extra room for storage or projects, and the expansive backyard offers endless possibilities for outdoor activities--bringing together space, versatility, and opportunity to make it your own.
-
2025-06-01status Active
-
2025-04-29status Active
-
2025-02-28status Active
-
2024-12-27price $255,150
-
2024-10-03$283,500 Active
-
2023-10-27$324,450 Active
-
2019-07-19$134,900
-
2008-05-15$115,000
ⓘ Source: listings_history table (triggers on properties + properties_extension) + one-shot
backfill from property_details.listing_events for pre-trigger history.
Tax reassessment forecast MO · Resets to sale price
- Current annual tax
- $973 · $81/mo
- Projected year-2 tax
- $1,745 · $145/mo
- Expected delta
- +$772/yr (+$64/mo · 79.3%)
ⓘ Screening estimate from a state-policy table — verify with the county assessor before closing.
Climate risk First Street
- Flood 1/10 Low FEMA zone X (unshaded) · 0% chance over 30 yrs
- Wildfire 3/10 Moderate
- Heat 5/10 Major 7 d/yr ≥104°F today · 21 d/yr by 30 yrs out
- Wind 2/10 Low 100% chance of damaging wind over 30 yrs
- Air quality 1/10 Low 0 unhealthy d/yr today · 0 by 30 yrs out
Nearby sold comps map
Loading sold comps map…
Walkable amenities ~0.75 mi
Loading nearby amenities…
Taxation est. · year 1
- Rental income
- $18,600
- − Mortgage interest
- −$10,077
- − Property taxes
- −$973
- − Insurance
- −$900
- − Repairs & maintenance
- −$1,488
- − Management
- −$1,488
- − HOA
- −$480
- − Depreciation
- −$5,233
- Taxable loss
- −$2,039
- Est. tax savings @ 24.0%
- +$489
- After-tax cash flow
- $1,510/yr
For passive investors: Depreciation is non-cash, so a rental often shows a tax loss while cash-flowing — sheltering income. Rental losses are passive: they offset passive income freely, and up to $25,000/yr can offset ordinary (W-2) income if you actively participate and your MAGI is under $100k (phasing out to $0 by $150k); unused losses carry forward. On sale, claimed depreciation is recaptured at up to 25%, and gains may owe capital-gains tax (a 1031 exchange can defer both). Figures are a year-1 estimate at your 24.0% rate — not tax advice; consult a CPA.
Schools (NCES district)
- District
- Reeds Spring R-IV
- NCES district ID
- 2926160
- Math proficiency
- 34% ▼ -3.00%
- Reading proficiency
- 42% ▼ -1.00%
- Median HH income
- $42,158
- Composite
- 32.06/100
- National rank
- #5819
- State rank
- #182 of 324 in MO
Livability — Kimberling City
- Score
- 69/100
- State rank
- #162
- US rank
- #8879
Category grades
Schools grade is shown separately in the Schools card above.
Census & demographics
- Population (ZIP)
- 8,279
Population outlook (Stone County) Hauer SSP2
- Today (2025)
- 28,147 people
- By 2030
- 26,405 · -6.2%
- By 2040
- 22,762 · -19.1%
- By 2050
- 19,706 · -30.0%
- By 2075
- 14,742 · -47.6%
- By 2100
- 10,832 · -61.5%
Race, ethnicity, and origin ACS 2023
- Neighborhood character
- Predominantly White (91%)
- Race & ethnicity
- White 91% Hispanic / Latino 6% Two or more races 5%
- Hispanic origin (detail)
- Mexican 3%
- Common ancestry
- Lithuanian 5% Slovak 4% Iranian 3%
- Foreign-born
- 2% · Canada, China
- Languages at home
- 97% English-only · Spanish 3%
Political lean MEDSL · Stone
- 2024 margin
- Solid R (+61.4) · D 18.9% · R 80.3%
- 2008→2024 swing
- -24.1pp toward R · 2008: -37.3pp · 2024: -61.4pp
- All cycles
- 2024: R+61.4 2020: R+61.1 2016: R+62.1 2012: R+49.2 2008: R+37.3
Not yet ingested
- Civics
- —
Market trends
- HPI YoY
- ▼ -2.17%
- Current HPI
- 239.032
- Rent YoY
- —
- Metro
- —
- State GDP YoY
- ▲ 1.84%
- F500 in state
- 20
Industry mix (Fortune 500 HQ in MO)
| Industry | F500 HQs | Revenue |
|---|---|---|
| Healthcare | 1 | $163B |
|
||
| Insurance | 1 | $21B |
|
||
| Industrial Technology | 1 | $17B |
|
||
| Retail | 1 | $16B |
|
||
| Industrial Distribution | 1 | $10B |
|
||
| Utilities | 1 | $9B |
|
||
Price history
+60.8% since first listed12 events — show timeline
- 2026-04-10 Price Changed $184,900 SOMO
- 2026-03-12 Price Changed $189,900 SOMO
- 2026-02-17 Price Changed $197,500 SOMO
- 2026-01-11 Listed $199,900 SOMO
- 2025-06-01 Relisted — SOMO
- 2025-04-29 Relisted — SOMO
- 2025-02-28 Relisted — SOMO
- 2024-12-27 Price Changed $255,150 SOMO
- 2024-10-03 Listed $283,500 SOMO
- 2023-10-27 Listed $324,450 SOMO
- 2019-07-19 Listed $134,900 SOMO
- 2008-05-15 Listed $115,000 SOMO
Property tax history
+1.4%/yrLatest (2025): $973 · -0.0% YoY. Source: county tax records.
Cash-flow waterfall
monthlySold comps — $/sqft
last 12 mo · ≤1 miLoading sold comps…