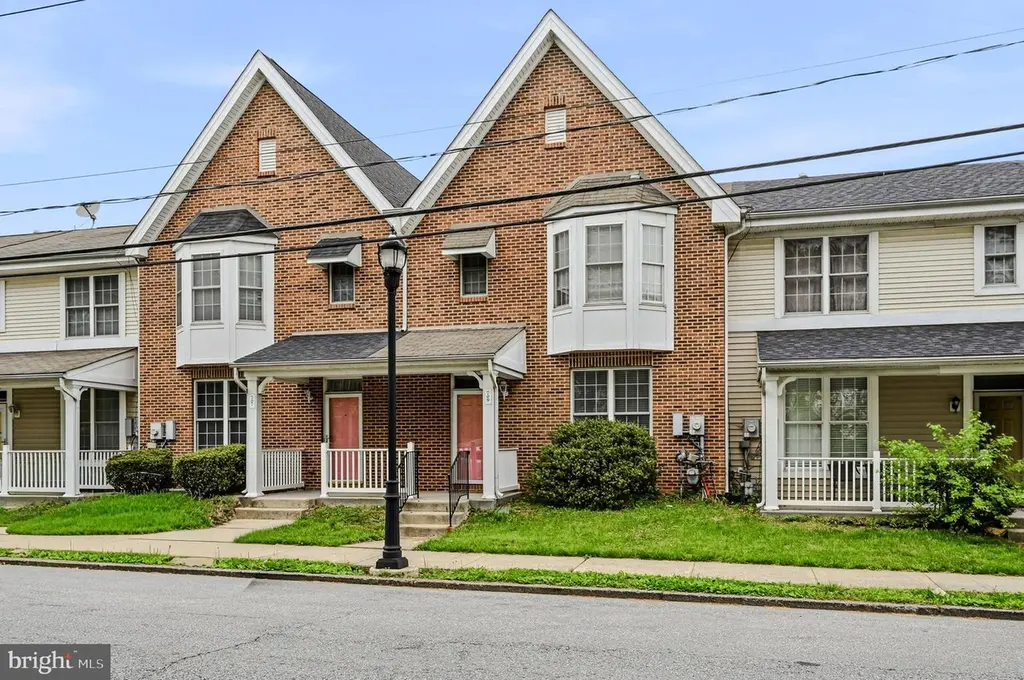
709 E 26th St · Wilmington, DE
Flood risk 6/10 · Moderate
- FEMA flood zone
- X (unshaded)
- Chance of flooding over 30 yrs
- 0.71%
- Est. flood insurance / yr
- $507 – $1,088
Fire risk 1/10 · Minimal
- Est. fire insurance / yr
- $476 – $884
Heat risk 8/10 · Major
- Hot days now (above 103°F)
- 7 days/yr
- Hot days in 30 yrs
- 16 days/yr
Wind risk 6/10 · Moderate
- Chance of severe wind over 30 yrs
- 27.0%
Air-quality risk 3/10 · Minor
- Unhealthy air days now
- 2 days/yr
- Unhealthy air days in 30 yrs
- 3 days/yr
Risk factors via First Street. Map © Google.
Why this score? — see what drove the D grade
The composite is a weighted blend of 9 inputs, each scored 0–100. Each bar is that input's sub-score; the figure is the points it added to the 100-point composite (weight × sub-score).
- Cash flow +14.4/30.0
- ARV discount +6.2/15.0
- DSCR +4.4/10.0
- Rent growth +3.9/5.0
- Livability +3.2/5.0
- Schools +3.1/10.0
- 1% rule +3.0/10.0
- Condition / age +2.5/5.0
- Appreciation +0.0/10.0
$230,000
🖨 Deal sheet (PDF) 📄 Offer letter ✓ Due diligence
Listing remarks MLS
Welcome to 709 E. 26th Street. This lovely brick home features an open floorplan, 3 nice-sized bedrooms, patio, and detached garage! A covered front porch welcomes you to this home. Step inside to the open living & dining room, with plenty of space to gather and enjoy your everyday routine. Flow into the bright kitchen with access outside to the patio; ideal for grilling, outdoor dining, and relaxing. Finishing out the first level is a powder room for guests and convenient first-floor laundry. Upstairs, you will find three bedrooms and two full baths, including the master suite with en-suite bath. This home is situated close to several parks and accessible to major routes. Be sure to schedule a showing today!
Key facts
- Brick townhome
- Wood flooring
- Main living area
Tags
Property features AI
Exterior
- Parking: Rear-entry detached garage; One garage space; Two off-street parking spaces; Total of three garage/parking spaces; Access via alley
- Utilities: Public water; Public sewer; Electric cooling fuel
- Home design: Interior townhouse/rowhouse; Fee simple ownership
- Construction: Mixed construction materials; Permanent foundation; Year built reported by assessor
- Exterior features: Tidal water not present; Other structures noted above and below grade
Interior
- Bedrooms: Three bedrooms on the upper level
- Bathrooms: Two full bathrooms on upper level; One half bathroom on main level
- Heating & cooling: Heat pump heating; Central air conditioning; Natural gas fuel for heating and hot water
- Interior features: No basement; Finished above-grade living area per assessor
Neighborhood map
What this means for you Summary
Snapshot
- This is a 3-bed/2.5-bath townhouse listed at $230k.
Deal economics
- At list price, monthly cash flow is $46 ($551/yr) — positive.
- The deal already cash-flows at list — no discount required.
- To meet the 1% rule (rent ≥ 1% of price), the offer needs to be $184k (20.1% below list).
- Recommended offer: $184k (20.1% below list) — sets the bar for 1% rule.
Location & tenants
- Location reads 64/100 on livability (#52 in DE) — a middle-class / working-renter tenant base. Strengths: cost of living A+, housing A; Watch: employment D+, commute D, crime F.
- Brandywine School District (suburban): math 28% / reading 40% proficiency, ranked #11 of 26 in DE (top 42%) — families likely to look elsewhere, expect single-tenant / working-renter base with shorter leases.
- Zoned schools: Carrcroft Elementary School (math 32% / reading 27%, grade F, #50 of 105 statewide, top 53%, 477 students, 0% FRL); Springer Middle School (math 24% / reading 40%, grade F, #15 of 36 statewide, top 40%, 797 students, 0% FRL); Brandywine High School (math 32% / reading 47%, grade F, #12 of 40 statewide, top 31%, 950 students, 0% FRL) — zoned schools average 0% FRL vs 38% district-wide (38 pts lower); this property's tenant base skews higher-income than the district average.
- Market conditions: Rents rising fast (+5.7%/yr); 132 active listings in the ZIP; 40 comparable units currently listed for rent nearby; rentals at typical pace (median 26d on market — plan ~3-4 weeks tenant-placement turnaround); 1,367 units permitted in New Castle County in 2024 (201 in 5+ unit buildings).
- This rent runs 41% of the median local income ($54k/yr) — at the standard rent-burdened threshold; future hikes will face affordability resistance.
Forward outlook
- Local home prices are declining (-3.0%/yr); year-one equity from $2k of loan paydown is wiped out by about $7k of value loss. Plan a longer hold.
- New Castle County population projected at +9% by 2050 — modest demand growth; plan on rents tracking national, not racing it.
Negotiation context
- Only 5 days on market — expect competitive offers; lowballing is unlikely to land.
- 3 sale attempts since 6y ago with the ask held roughly flat each time — persistent listings suggest the price (not the market) is what's stuck; bring a comps-based counter.
Risks & watch-outs
- Climate carrying-cost: major flood risk; major wind risk, 27% chance of damaging wind over 30y; extreme-heat days projected 7→16/yr by 2055 (HVAC capex compounding) — expect insurance premiums to compound above CPI over the hold.
Questions for the listing agent
- Is there a deadline driving the sale (1031 exchange, divorce, estate, relocation)? That informs how much negotiation room exists.
- Schools are D-rated, which usually means shorter tenancies and higher turnover. Who's the typical renter profile here, and what's been the actual vacancy rate?
- Crime grade is F in this area — have there been break-ins, vandalism, or insurance claims at this property in the last 3 years? What carrier currently insures it and at what premium?
- The area grade is low — what's the realistic commute time and amenity access for the typical tenant pool here? Any planned neighborhood developments (good or bad) we should know about?
- What's the average days-on-market for RENTAL listings here right now (not sales)? A rising rental-DOM trend means longer vacancies and softer asking-rent achievability than the comps imply.
- What's the recent tenant-quality profile in this submarket — average credit score on applications, eviction rate, late-payment / NSF rate, and stable-employment percentage? A property-management company in the area should have these aggregated.
- How much new for-sale + rental construction is in the pipeline within 1–3 miles? Heavy new supply typically softens prices + rents 12–24 months out; constrained supply supports both.
Investment metrics
- 1% rule
- 0.80% ✗
- Cap rate
- 6.53%
- Cash-on-cash
- 0.86%
- DSCR
- 1.04
- GRM
- 10.4
CMA / ARV
- ARV (median comp)
- $223,732
- List price
- $230,000
- Delta
- 2.80%
- Verdict
- FAIR
- Comps
- 20 within 1.0 mi
Show comp detail 12 sales within ~0.75 mi
| Address | Dist | Beds/Ba | Sqft | Sold | Price | $/sf | Match |
|---|---|---|---|---|---|---|---|
| 709 E 26th St | 0.00mi | 3/2.5 | 1,375 (0%) | 1mo | $230,000 | $167 | 99 |
| 2412 Lamotte St | 0.25mi | 3/1.0 | 1,275 (-7%) | 0mo | $125,000 | $98 | 70 |
| 24 W 30th St | 0.35mi | 3/2.0 | 1,478 (+8%) | 0mo | $280,000 | $189 | 69 |
| 2011 N West St | 0.61mi | 4/1.0 (+1) | 1,375 (0%) | 1mo | $135,000 | $98 | 60 |
| 2321 N Tatnall St | 0.42mi | 3/1.5 | 1,525 (+11%) | 1mo | $216,000 | $142 | 58 |
| 305 W 21st St | 0.66mi | 3/1.5 | 1,450 (+6%) | 1mo | $290,000 | $200 | 56 |
| 2009 N Tatnall St | 0.56mi | 3/1.0 | 1,475 (+7%) | 1mo | $170,000 | $115 | 55 |
| 222 W 22nd St | 0.59mi | 3/2.5 | 1,525 (+11%) | 1mo | $265,000 | $174 | 54 |
| 1313 N Walnut St | 0.70mi | 2/1.0 (-1) | 1,350 (-2%) | 1mo | $155,000 | $115 | 53 |
| 108 E 35th St | 0.48mi | 4/2.0 (+1) | 1,525 (+11%) | 1mo | $225,000 | $148 | 52 |
| 125 W 20th St | 0.61mi | 3/1.0 | 1,500 (+9%) | 1mo | $235,000 | $157 | 50 |
| 2708 Thompson Pl | 0.52mi | 3/1.0 | 1,175 (-14%) | 1mo | $215,000 | $183 | 45 |
Match score weights: distance 35% · size 25% · config 20% · recency 20%. Top-matched comps best support the ARV.
Projected returns pro-forma
-3.0% appreciation · 5.72% rent growth · sell at horizon
- IRR
- -12.3%
- Equity multiple
- 0.55×
- Total profit
- $-29,259
- Equity at exit
- $34,294
- IRR
- 0.1%
- Equity multiple
- 1.01×
- Total profit
- $375
- Equity at exit
- $19,886
Cash invested: $64,400 (down + closing). Projections, not guarantees.
Landlord ↔ Tenant lean methodology
- Overall (STATE)
- 70 Landlord-Friendly
- State Delaware
- 70 Landlord-Friendly · D+7
- County
- — inherits STATE
- City
- — inherits STATE
ZIP-level market 19802
- Rents YoY
- 5.7%
- Active inventory
- 132
- Price-to-rent
- 10.4×
Monthly cashflow live
- Estimated rent
- $1,839 high interval (Pro) →
- Mortgage (P&I)
- −$1,206
- Tax from tax record
- −$105 /mo · $1,257/yr
- Insurance
- −$96
- HOA
- −$0
- Vacancy / Maint / Mgmt
- −$386
- Net cashflow
- $46
Break-even live
Sensitivity live
| Price | -10% $176 | -5% $111 | +0% $46 | +5% $-19 | +10% $-84 |
|---|---|---|---|---|---|
| Rent | -10% $-99 | -5% $-27 | +0% $46 | +5% $119 | +10% $191 |
| Rate | -1.0pp $162 | -0.5pp $104 | base $46 | +0.5pp $-14 | +1.0pp $-74 |
UW: 25.0% down · 7.5% · 30yr · 1.5% tax · 5.0% vac · 8.0% maint · 8.0% mgmt
Financing live
Cash to close
- Down payment
- $57,500
- Closing costs
- $6,900
- Reserves months
- —
- Total cash needed
- —
Loan-product check · same deal, 3 products live
Conventional
25% down · 7.5% · 30yr
- Down + closing
- —
- Monthly P&I
- —
- Monthly cashflow
- —
- DSCR
- —
- Eligible?
- —
Personal DTI + credit; lowest rate.
DSCR
20% down · 8.5% · 30yr
- Down + closing
- —
- Monthly P&I
- —
- Monthly cashflow
- —
- DSCR
- —
- Eligible?
- —
No personal income docs; deal must DSCR.
Hard money
10% down · 12.0% · 12mo
- Down + closing
- —
- Monthly P&I
- —
- Monthly cashflow
- —
- DSCR
- —
- Eligible?
- —
Short-term bridge; refi at stabilization.
Rent comps 40 comps
| Address | Beds | Baths | Sqft | Rent | $/sqft | DOM | Units | Dist |
|---|---|---|---|---|---|---|---|---|
| 2705 Speakman Pl Wilmington, DE | 3.0 | 1.5 | 1100 | $1,975 | $1.80 | 14d | 1 | 0.08mi |
| 103 E 24th St Unit 1 Wilmington, DE | 3.0 | 1.0 | 1025 | $1,795 | $1.75 | 45d | 1 | 0.22mi |
| 2601 N Heald St Wilmington, DE | 3.0 | 1.0 | 1025 | $1,795 | $1.75 | 0d | 1 | 0.23mi |
| 5 E 24th St Unit 1 Wilmington, DE | 3.0 | 1.0 | 1150 | $1,795 | $1.56 | 45d | 1 | 0.29mi |
| 2518 N Tatnall St Wilmington, DE | 4.0 | 1.5 | 1575 | $1,995 | $1.27 | 45d | 1 | 0.33mi |
| 918 E 17th St Unit 1 Wilmington, DE | 3.0 | 1.0 | 1100 | $1,795 | $1.63 | 0d | 1 | 0.39mi |
| 3005 N West St Wilmington, DE | 3.0 | 1.0 | 1176 | $1,900 | $1.62 | 26d | 1 | 0.45mi |
| 2401 N West St Wilmington, DE | 4.0 | 1.0 | 1650 | $1,900 | $1.15 | 17d | 1 | 0.46mi |
| 125 W 23rd St Wilmington, DE | 4.0 | 2.0 | 1672 | $1,995 | $1.19 | 45d | 1 | 0.47mi |
| 547 Eastlawn Ave Wilmington, DE | 3.0 | 1.0 | 1400 | $1,995 | $1.43 | 45d | 1 | 0.49mi |
| 2923 N Washington St Wilmington, DE | 3.0 | 1.0 | 1225 | $1,600 | $1.31 | 0d | 1 | 0.51mi |
| 3003 N Washington St Wilmington, DE | 3.0 | 1.0 | 1250 | $1,950 | $1.56 | 45d | 1 | 0.51mi |
| 400 W 29th St Wilmington, DE | 3.0 | 1.5 | 1125 | $1,950 | $1.73 | 45d | 1 | 0.55mi |
| 302 W 23rd St Unit 1 Wilmington, DE | 2.0 | 1.0 | 1450 | $1,295 | $0.89 | 26d | 1 | 0.58mi |
| 306 W 23rd St Unit 1 Wilmington, DE | 2.0 | 1.0 | 1475 | $1,295 | $0.88 | 26d | 1 | 0.58mi |
| 306 W 23rd St Unit 2 Wilmington, DE | 2.0 | 1.0 | 1475 | $1,295 | $0.88 | 45d | 1 | 0.58mi |
| 306 Concord Ave Unit 2 Wilmington, DE | 3.0 | 1.0 | 1100 | $1,350 | $1.23 | 45d | 1 | 0.59mi |
| 314 Concord Ave Unit 2 Wilmington, DE | 2.0 | 1.0 | 1300 | $1,295 | $1.00 | 26d | 1 | 0.60mi |
| 517 W 26th St Unit NA Wilmington, DE | 3.0 | 1.5 | 1344 | $1,900 | $1.41 | 26d | 1 | 0.66mi |
| 518 E 12th St Wilmington, DE | 2.0 | 1.0 | 875 | $1,425 | $1.63 | 22d | 1 | 0.69mi |
| 1124 Clifford Brown Walk Wilmington, DE | 2.0 | 1.0 | 1240 | $1,625 | $1.31 | 45d | 1 | 0.74mi |
| 409 W 20th St Unit 2 Wilmington, DE | 2.0 | 1.0 | 1100 | $1,500 | $1.36 | 14d | 1 | 0.74mi |
| 409 W 20th St Unit 2 Wilmington, DE | 2.0 | 1.0 | 1100 | $1,700 | $1.55 | 12d | 1 | 0.74mi |
| 1026 Bennett St Wilmington, DE | 3.0 | 1.0 | 1125 | $1,685 | $1.50 | 0d | 1 | 0.75mi |
| 1004 N Spruce St Wilmington, DE | 3.0 | 1.5 | 1075 | $1,800 | $1.67 | 20d | 1 | 0.77mi |
| 1217 N King St Wilmington, DE | 3.0 | 1.5 | 1300 | $2,145 | $1.65 | 20d | 1 | 0.78mi |
| 605 E 10th St Wilmington, DE | 3.0 | 1.0 | 1200 | $1,850 | $1.54 | 26d | 1 | 0.79mi |
| 928 Kirkwood St Wilmington, DE | 3.0 | 1.5 | 1150 | $1,700 | $1.48 | 19d | 1 | 0.82mi |
| 507 Barrett St Wilmington, DE | 3.0 | 1.0 | 1275 | $1,700 | $1.33 | 45d | 1 | 0.83mi |
| 604 W 20th St Unit 2 Wilmington, DE | 2.0 | 1.0 | 900 | $1,195 | $1.33 | 26d | 1 | 0.84mi |
| 107 W 13th St Wilmington, DE | 3.0 | 1.5 | 1325 | $1,895 | $1.43 | 45d | 1 | 0.85mi |
| 2 Colony Blvd Wilmington, DE | 1.0–2.0 | 1.0–2.0 | 1112 | $2,500 | $2.25 | 0d | 6 | 0.91mi |
| 1001 N Orange St Wilmington, DE | 1.0–2.0 | 1.0–2.0 | 833 | $2,135 | $2.56 | 0d | 61 | 0.97mi |
| 913 N Market St Wilmington, DE | 1.0–2.0 | 1.0–2.0 | 974 | $1,985 | $2.04 | 45d | 5 | 0.99mi |
| 3408 Miller Rd Wilmington, DE | 1.0–2.0 | 1.0–2.0 | 889 | $1,775 | $2.00 | 0d | 8 | 1.02mi |
| 116 W 9th St Wilmington, DE | 1.0–2.0 | 1.0–2.0 | 813 | $2,270 | $2.79 | 0d | 17 | 1.07mi |
| 212 W 9th St Unit 204 Wilmington, DE | 2.0 | 2.0 | 1671 | $1,745 | $1.04 | 7d | 1 | 1.07mi |
| 212 W 9th St Unit 204 Wilmington, DE | 2.0 | 2.0 | 1671 | $1,795 | $1.07 | 45d | 1 | 1.07mi |
| 228 W 9th St Unit 201 Wilmington, DE | 2.0 | 2.0 | 1031 | $1,695 | $1.64 | 46d | 1 | 1.09mi |
| 801 N Market St Unit 207 Wilmington, DE | 2.0 | 2.0 | 1239 | $1,895 | $1.53 | 7d | 1 | 1.09mi |
Listing history 9 events
-
2026-05-05status Pending 1261-char remark
-
2026-04-30$230,000 Active 1261-char remark
-
2022-01-13soldstatus $140,000
-
2021-12-23soldstatus $175,000 Closed 725-char remark
Show marketing remark (725 chars)
Welcome to 709 E. 26th Street. This lovely brick home features an open floorplan, 3 nice-sized bedrooms, patio, and detached garage! A covered front porch welcomes you to this home. Step inside to the open living & dining room, with plenty of space to gather and enjoy your everyday routine. Flow into the bright kitchen with access outside to the patio; ideal for grilling, outdoor dining, and relaxing. Finishing out the first level is a powder room for guests and convenient first-floor laundry. Upstairs, you will find three bedrooms and two full baths, including the master suite with en-suite bath. This home is situated close to several parks and accessible to major routes. Be sure to schedule a showing today!
-
2021-11-17status Pending 725-char remark
Show marketing remark (725 chars)
Welcome to 709 E. 26th Street. This lovely brick home features an open floorplan, 3 nice-sized bedrooms, patio, and detached garage! A covered front porch welcomes you to this home. Step inside to the open living & dining room, with plenty of space to gather and enjoy your everyday routine. Flow into the bright kitchen with access outside to the patio; ideal for grilling, outdoor dining, and relaxing. Finishing out the first level is a powder room for guests and convenient first-floor laundry. Upstairs, you will find three bedrooms and two full baths, including the master suite with en-suite bath. This home is situated close to several parks and accessible to major routes. Be sure to schedule a showing today!
-
2021-11-12$160,000 Active 725-char remark
Show marketing remark (725 chars)
Welcome to 709 E. 26th Street. This lovely brick home features an open floorplan, 3 nice-sized bedrooms, patio, and detached garage! A covered front porch welcomes you to this home. Step inside to the open living & dining room, with plenty of space to gather and enjoy your everyday routine. Flow into the bright kitchen with access outside to the patio; ideal for grilling, outdoor dining, and relaxing. Finishing out the first level is a powder room for guests and convenient first-floor laundry. Upstairs, you will find three bedrooms and two full baths, including the master suite with en-suite bath. This home is situated close to several parks and accessible to major routes. Be sure to schedule a showing today!
-
2020-01-27historical
-
2020-01-07$145,000 Active
-
2006-11-29soldstatus $129,050
ⓘ Source: listings_history table (triggers on properties + properties_extension) + one-shot
backfill from property_details.listing_events for pre-trigger history.
Tax reassessment forecast DE · Partial reset (capped growth)
- Current annual tax
- $1,257 · $105/mo
- Projected year-2 tax
- $1,295 · $108/mo
- Expected delta
- +$39/yr (+$3/mo · 3.1%)
ⓘ Screening estimate from a state-policy table — verify with the county assessor before closing.
Climate risk First Street
- Flood 6/10 Major FEMA zone X (unshaded) · 71% chance over 30 yrs
- Wildfire 1/10 Low
- Heat 8/10 Severe 7 d/yr ≥103°F today · 16 d/yr by 30 yrs out
- Wind 6/10 Major 27% chance of damaging wind over 30 yrs
- Air quality 3/10 Moderate 2 unhealthy d/yr today · 3 by 30 yrs out
Nearby sold comps map
Loading sold comps map…
Walkable amenities ~0.75 mi
Loading nearby amenities…
Taxation est. · year 1
- Rental income
- $22,066
- − Mortgage interest
- −$12,884
- − Property taxes
- −$1,257
- − Insurance
- −$1,150
- − Repairs & maintenance
- −$1,765
- − Management
- −$1,765
- − Depreciation
- −$6,691
- Taxable loss
- −$3,446
- Est. tax savings @ 24.0%
- +$827
- After-tax cash flow
- $1,378/yr
For passive investors: Depreciation is non-cash, so a rental often shows a tax loss while cash-flowing — sheltering income. Rental losses are passive: they offset passive income freely, and up to $25,000/yr can offset ordinary (W-2) income if you actively participate and your MAGI is under $100k (phasing out to $0 by $150k); unused losses carry forward. On sale, claimed depreciation is recaptured at up to 25%, and gains may owe capital-gains tax (a 1031 exchange can defer both). Figures are a year-1 estimate at your 24.0% rate — not tax advice; consult a CPA.
Schools (NCES district)
- District
- Brandywine School District
- NCES district ID
- 1001240
- Math proficiency
- 28% ▼ -13.00%
- Reading proficiency
- 40% ▼ -13.00%
- Median HH income
- $68,743
- Composite
- 31.27/100
- National rank
- #6019
- State rank
- #11 of 26 in DE
Livability — Wilmington
- Score
- 64/100
- State rank
- #52
- US rank
- #14251
Category grades
Schools grade is shown separately in the Schools card above.
Census & demographics
- Census place
- Wilmington, DE
- County
- New Castle County · 483,412 people
- City population
- 173,480
- Metro
- Philadelphia-Camden-Wilmington, PA-NJ-DE-MD
- Population (ZIP)
- 26,051
- Household income
- $53,812
- Rent vs Own
- Severe rent burden
- 1816.0
Population outlook (New Castle County) Hauer SSP2
- Today (2025)
- 594,686 people
- By 2030
- 609,164 · +2.4%
- By 2040
- 632,154 · +6.3%
- By 2050
- 649,068 · +9.1%
- By 2075
- 687,771 · +15.7%
- By 2100
- 694,961 · +16.9%
Race, ethnicity, and origin ACS 2023
- Neighborhood character
- Predominantly Black (68%)
- Race & ethnicity
- Black 68% White 20% Hispanic / Latino 7% Two or more races 5%
- Hispanic origin (detail)
- Puerto Rican 4%
- Common ancestry
- Slovak 1% Romanian 1% Italian 1%
- Foreign-born
- 11% · Canada, Jamaica, China
- Languages at home
- 92% English-only · Spanish 4% Arabic 0%
Political lean MEDSL · New Castle
- 2024 margin
- Solid D (+32.6) · D 65.5% · R 32.9% · Other 1.6%
- 2008→2024 swing
- -8.1pp toward R · 2008: 40.6pp · 2024: 32.6pp
- All cycles
- 2024: D+32.6 2020: D+37.1 2016: D+29.6 2012: D+34.1 2008: D+40.6
Not yet ingested
- Civics
- —
Market trends
- HPI YoY
- ▼ -296.47%
- Current HPI
- 225.6613
- Rent YoY
- ▲ 5.72%
- Metro
- Philadelphia-Camden-Wilmington, PA-NJ-DE-MD
- State GDP YoY
- —
- F500 in state
- 0
Price history
+78.2% since first listed10 events — show timeline
- 2026-06-05 Sold (MLS) $230,000 BRIGHT MLS
- 2026-05-05 Pending — BRIGHT MLS
- 2026-04-30 Listed $230,000 BRIGHT MLS
- 2022-01-13 Sold (Public Records) $140,000 Public Records
- 2021-12-23 Sold (MLS) $175,000 BRIGHT MLS
- 2021-11-17 Pending — BRIGHT MLS
- 2021-11-12 Listed $160,000 BRIGHT MLS
- 2020-01-27 Listing Removed — BRIGHT MLS
- 2020-01-07 Listed $145,000 BRIGHT MLS
- 2006-11-29 Sold (Public Records) $129,050 Public Records
Property tax history
+2.2%/yrLatest (2024): $1,257 · +10.2% YoY. Source: county tax records.
Cash-flow waterfall
monthlySold comps — $/sqft
last 12 mo · ≤1 miLoading sold comps…