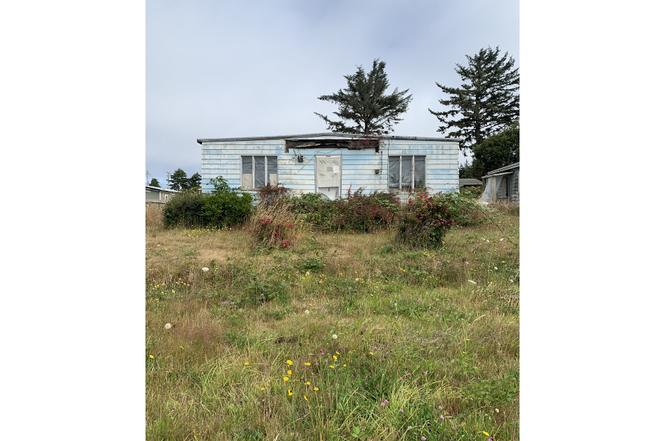
369 S Marple St · Coos Bay, OR
Flood risk 1/10 · Minimal
- FEMA flood zone
- X (unshaded)
- Chance of flooding over 30 yrs
- 0.0%
- Est. flood insurance / yr
- $507 – $1,088
Fire risk 1/10 · Minimal
- Est. fire insurance / yr
- $498 – $926
Heat risk 1/10 · Minimal
- Hot days now (above 74°F)
- 8 days/yr
- Hot days in 30 yrs
- 22 days/yr
Wind risk 1/10 · Minimal
- Chance of severe wind over 30 yrs
- —
Air-quality risk 6/10 · Moderate
- Unhealthy air days now
- 9 days/yr
- Unhealthy air days in 30 yrs
- 9 days/yr
Risk factors via First Street. Map © Google.
Why this score? — see what drove the B grade
The composite is a weighted blend of 9 inputs, each scored 0–100. Each bar is that input's sub-score; the figure is the points it added to the 100-point composite (weight × sub-score).
- Cash flow +30.0/30.0
- 1% rule +10.0/10.0
- DSCR +10.0/10.0
- ARV discount +7.5/15.0
- Rent growth +4.7/5.0
- Livability +3.1/5.0
- Schools +2.5/10.0
- Condition / age +2.5/5.0
- Appreciation +0.0/10.0
$85,000
🖨 Deal sheet 📄 Offer letter ✓ Due diligence
Listing remarks
PLEASE SCHEDULE SHOWINGS. Currently no access. Value is in the lot. Building is a fixer/teardown. Asbestos in the structure. Lead Based Paint. A great lot for the price.
Key facts
- 8,000 sq ft lot
- 2 parking spots
- Built 1930
Neighborhood map
What this means for you Summary
Snapshot
- This is a 2-bed/2.0-bath single-family listed at $85k.
Deal economics
- At list price, monthly cash flow is $910 ($11k/yr) — positive.
- The deal already cash-flows at list — no discount required.
- Meets the 1% rule at list price ($2k rent vs $85k).
- Recommended offer: $84k (1.5% below list) — sets the bar for market timing.
- Cap rate 19.1% vs local median 4.2% in Coos Bay — top-decile yield for the area; either an underpriced asset or a hidden risk that comps aren't pricing in. Stress-test before assuming the spread holds.
Location & tenants
- Location reads 61/100 on livability (#257 in OR) — a middle-class / working-renter tenant base. Strengths: housing A+, health & safety A+, cost of living A; Watch: crime F, amenities F, commute F.
- Coos Bay SD 9 (town): math 22% / reading 39% proficiency, ranked #45 of 58 in OR (top 78%) — families likely to look elsewhere, expect single-tenant / working-renter base with shorter leases.
- Zoned schools: Madison Elementary School (295 students, 69% FRL); Marshfield Senior High School (math 17% / reading 54%, grade F, #89 of 143 statewide, top 62%, 835 students, 31% FRL) — zoned schools at 50% FRL track the district average.
- Market conditions: Rents rising fast (+8.7%/yr); 342 active listings in the ZIP; 6 comparable units currently listed for rent nearby; rentals lingering (median 44d on market — plan ~5-8 weeks vacancy on turnover, expect pricing pressure); 100% of comp listings sitting > 30 days — soft ceiling on asking rent; 122 units permitted in Coos County in 2024 (16 in 5+ unit buildings).
- This rent runs 37% of the median local income ($62k/yr) — at the standard rent-burdened threshold; future hikes will face affordability resistance.
Forward outlook
- Local home prices are declining (-3.0%/yr); year-one equity from $588 of loan paydown is wiped out by about $3k of value loss. Plan a longer hold.
- Coos County population projected to shrink 9% by 2050 — rents likely to lag national; underwrite the cash flow, not the appreciation.
- At projected returns (-3.0% appreciation + 8.0% rent growth), your $24k cash investment doubles in ~3 years — after that, you're playing with house money.
Negotiation context
- It's been on market 24 days — a 2% lower offer ($84k) is reasonable based on typical stale-listing flexibility.
Risks & watch-outs
- Watch-outs: built in 1930 — expect roof / HVAC / electrical / plumbing capex.
Questions for the listing agent
- Built in 1930 — when were the roof, HVAC, electrical panel, plumbing, and water heater last replaced?
- Is there a deadline driving the sale (1031 exchange, divorce, estate, relocation)? That informs how much negotiation room exists.
- Schools are D-rated, which usually means shorter tenancies and higher turnover. Who's the typical renter profile here, and what's been the actual vacancy rate?
- Crime grade is F in this area — have there been break-ins, vandalism, or insurance claims at this property in the last 3 years? What carrier currently insures it and at what premium?
- What's the average days-on-market for RENTAL listings here right now (not sales)? A rising rental-DOM trend means longer vacancies and softer asking-rent achievability than the comps imply.
- What's the recent tenant-quality profile in this submarket — average credit score on applications, eviction rate, late-payment / NSF rate, and stable-employment percentage? A property-management company in the area should have these aggregated.
- How much new for-sale + rental construction is in the pipeline within 1–3 miles? Heavy new supply typically softens prices + rents 12–24 months out; constrained supply supports both.
Investment metrics
- 1% rule
- 2.24% ✓
- Cap rate
- 19.14%
- Cash-on-cash
- 45.89%
- DSCR
- 3.04
- GRM
- 3.7
CMA / ARV
- ARV (on-the-fly)
- $318,240
- Comps found
- 12
Show comp detail 12 sales within ~0.75 mi
| Address | Dist | Beds/Ba | Sqft | Sold | Price | $/sf | Match |
|---|---|---|---|---|---|---|---|
| 610 Pacific Ave | 0.16mi | 3/2.0 (+1) | 1,436 (+6%) | 7mo | $300,000 | $209 | 72 |
| 246 Cammann | 0.18mi | 3/2.0 (+1) | 1,296 (-5%) | 12mo | $300,000 | $231 | 69 |
| 205 N Schoneman Ave | 0.58mi | 3/2.0 (+1) | 1,350 (-1%) | 2mo | $389,000 | $288 | 65 |
| 660 S Wall St | 0.29mi | 3/1.0 (+1) | 1,280 (-6%) | 4mo | $112,000 | $88 | 64 |
| 1109 Salmon Ave | 0.50mi | 3/2.0 (+1) | 1,386 (+2%) | 11mo | $325,000 | $234 | 60 |
| 474 N Wasson St | 0.64mi | 3/2.0 (+1) | 1,260 (-7%) | 2mo | $165,000 | $131 | 52 |
| 1042 Maryland Ave | 0.43mi | 3/1.0 (+1) | 1,292 (-5%) | 14mo | $298,000 | $231 | 50 |
| 965 Noble Ave | 0.36mi | 3/2.0 (+1) | 1,232 (-9%) | 15mo | $315,000 | $256 | 50 |
| 773 Kentucky Ave | 0.57mi | 3/3.0 (+1) | 1,403 (+3%) | 12mo | $380,000 | $271 | 49 |
| 757 Kentucky Ave | 0.56mi | 3/3.0 (+1) | 1,403 (+3%) | 16mo | $355,000 | $253 | 46 |
| 845 Webster Ave | 0.43mi | 2/2.0 | 1,170 (-14%) | 14mo | $310,000 | $265 | 45 |
| 537 N Wall St | 0.69mi | 3/2.0 (+1) | 1,544 (+14%) | 10mo | $275,000 | $178 | 31 |
Match score weights: distance 35% · size 25% · config 20% · recency 20%. Top-matched comps best support the ARV.
Projected returns pro-forma
-3.0% appreciation · 8.0% rent growth · sell at horizon
- IRR
- 48.7%
- Equity multiple
- 3.28×
- Total profit
- $54,272
- Equity at exit
- $12,674
- IRR
- 56.4%
- Equity multiple
- 8.05×
- Total profit
- $167,757
- Equity at exit
- $7,349
Cash invested: $23,800 (down + closing). Projections, not guarantees.
Landlord ↔ Tenant lean methodology
- Overall (STATE)
- 28 Tenant-Leaning
- State Oregon
- 28 Tenant-Leaning · D+6
- County
- — inherits STATE
- City
- — inherits STATE
ZIP-level market 97420
- Rents YoY
- 8.7%
- Active inventory
- 342
- Price-to-rent
- 3.7×
Monthly cashflow live
- Estimated rent
- $1,901 high interval (Pro) →
- Mortgage (P&I)
- −$446
- Tax from tax record
- −$111 /mo · $1,328/yr
- Insurance
- −$35
- HOA
- −$0
- Vacancy / Maint / Mgmt
- −$399
- Net cashflow
- $910
Break-even live
UW: 25.0% down · 7.5% · 30yr · 1.5% tax · 5.0% vac · 8.0% maint · 8.0% mgmt
Financing live
Cash to close
- Down payment
- $21,250
- Closing costs
- $2,550
- Reserves months
- —
- Total cash needed
- —
Loan-product check · same deal, 3 products live
Conventional
25% down · 7.5% · 30yr
- Down + closing
- —
- Monthly P&I
- —
- Monthly cashflow
- —
- DSCR
- —
- Eligible?
- —
Personal DTI + credit; lowest rate.
DSCR
20% down · 8.5% · 30yr
- Down + closing
- —
- Monthly P&I
- —
- Monthly cashflow
- —
- DSCR
- —
- Eligible?
- —
No personal income docs; deal must DSCR.
Hard money
10% down · 12.0% · 12mo
- Down + closing
- —
- Monthly P&I
- —
- Monthly cashflow
- —
- DSCR
- —
- Eligible?
- —
Short-term bridge; refi at stabilization.
Rent comps 6 comps
| Address | Beds | Baths | Sqft | Rent | $/sqft | DOM | Units | Dist |
|---|---|---|---|---|---|---|---|---|
| 239 N Wasson St Unit 7 Coos Bay, OR | 2.0 | 1.0 | 900 | $1,400 | $1.56 | 43d | 1 | 0.43mi |
| 949 Blanco Ave Coos Bay, OR | 3.0 | 2.0 | 1100 | $2,500 | $2.27 | 43d | 1 | 0.52mi |
| 455 N Cammann St Coos Bay, OR | 3.0 | 1.0 | 1060 | $2,000 | $1.89 | 43d | 1 | 0.64mi |
| 267 Ackerman Ave Unit 277 Coos Bay, OR | 2.0 | 1.0 | 904 | $1,550 | $1.71 | 43d | 1 | 0.74mi |
| 151 Norman Ave Unit 02 Coos Bay, OR | 2.0 | 1.0 | 1000 | $1,300 | $1.30 | 43d | 1 | 0.90mi |
| 971 Inlet Loop Coos Bay, OR | 3.0 | 3.0 | 1792 | $3,150 | $1.76 | 43d | 1 | 0.90mi |
Listing history 3 events
-
2025-10-06soldstatus $80,000
-
2025-08-25status Pending
-
2025-07-31$85,000 Active
ⓘ Source: listings_history table (triggers on properties + properties_extension) + one-shot
backfill from property_details.listing_events for pre-trigger history.
Tax reassessment forecast OR · Resets to sale price
- Current annual tax
- $1,328 · $111/mo
- Projected year-2 tax
- $1,328 · $111/mo
- Expected delta
- $0/yr ($0/mo · 0.0%)
ⓘ Screening estimate from a state-policy table — verify with the county assessor before closing.
Climate risk First Street
- Flood 1/10 Low FEMA zone X (unshaded) · 0% chance over 30 yrs
- Wildfire 1/10 Low
- Heat 1/10 Low 8 d/yr ≥74°F today · 22 d/yr by 30 yrs out
- Wind 1/10 Low
- Air quality 6/10 Major 9 unhealthy d/yr today · 9 by 30 yrs out
Nearby sold comps map
Loading sold comps map…
Walkable amenities ~0.75 mi
Loading nearby amenities…
Taxation est. · year 1
- Rental income
- $22,814
- − Mortgage interest
- −$4,761
- − Property taxes
- −$1,328
- − Insurance
- −$425
- − Repairs & maintenance
- −$1,825
- − Management
- −$1,825
- − Depreciation
- −$2,473
- Taxable income
- $10,177
- Est. tax owed @ 24.0%
- −$2,443
- After-tax cash flow
- $8,479/yr
For passive investors: Depreciation is non-cash, so a rental often shows a tax loss while cash-flowing — sheltering income. Rental losses are passive: they offset passive income freely, and up to $25,000/yr can offset ordinary (W-2) income if you actively participate and your MAGI is under $100k (phasing out to $0 by $150k); unused losses carry forward. On sale, claimed depreciation is recaptured at up to 25%, and gains may owe capital-gains tax (a 1031 exchange can defer both). Figures are a year-1 estimate at your 24.0% rate — not tax advice; consult a CPA.
Schools (NCES district)
- District
- Coos Bay SD 9
- NCES district ID
- 4103660
- Math proficiency
- 22% ▼ -6.00%
- Reading proficiency
- 39% ▼ -4.00%
- Median HH income
- $38,630
- Composite
- 25.46/100
- National rank
- #7450
- State rank
- #45 of 58 in OR
Livability — Coos Bay
- Score
- 61/100
- State rank
- #257
- US rank
- #17474
Category grades
Schools grade is shown separately in the Schools card above.
Census & demographics
- Census place
- Coos Bay, OR
- County
- Coos County · 27,621 people
- City population
- 27,621
- Metro
- Coos Bay, OR
- Population (ZIP)
- 27,621
- Household income
- $61,574
- Rent vs Own
- Severe rent burden
- 799.0
Population outlook (Coos County) Hauer SSP2
- Today (2025)
- 62,222 people
- By 2030
- 61,120 · -1.8%
- By 2040
- 58,478 · -6.0%
- By 2050
- 56,819 · -8.7%
- By 2075
- 54,915 · -11.7%
- By 2100
- 51,403 · -17.4%
Race, ethnicity, and origin ACS 2023
- Neighborhood character
- Predominantly White (81%)
- Race & ethnicity
- White 81% Hispanic / Latino 10% Two or more races 8% Native American 2% Asian 1%
- Hispanic origin (detail)
- Mexican 7%
- Common ancestry
- Italian 5% Slovak 3% Lithuanian 3%
- Foreign-born
- 5% · Canada, Vietnam
- Languages at home
- 92% English-only · Spanish 6%
Political lean MEDSL · Coos
- 2024 margin
- R (+19.9) · D 38.7% · R 58.5% · Other 2.8%
- 2008→2024 swing
- -16.8pp toward R · 2008: -3.1pp · 2024: -19.9pp
- All cycles
- 2024: R+19.9 2020: R+20.5 2016: R+24.3 2012: R+6.3 2008: R+3.1
Not yet ingested
- Civics
- —
Market trends
- HPI YoY
- ▼ -315.58%
- Current HPI
- 198.3249
- Rent YoY
- ▲ 8.65%
- Metro
- Coos Bay, OR
- State GDP YoY
- ▲ 2.05%
- F500 in state
- 2
Industry mix (Fortune 500 HQ in OR)
| Industry | F500 HQs | Revenue |
|---|---|---|
| Consumer Goods | 1 | $51B |
|
||
Price history
-5.9% since first listed3 events — show timeline
- 2025-10-06 Sold (Public Records) $80,000 Public Records
- 2025-08-25 Pending — RMLS
- 2025-07-31 Listed $85,000 RMLS
Property tax history
+3.7%/yrLatest (2025): $1,328 · +1.5% YoY. Source: county tax records.
Cash-flow waterfall
monthlySold comps — $/sqft
last 12 mo · ≤1 miLoading sold comps…