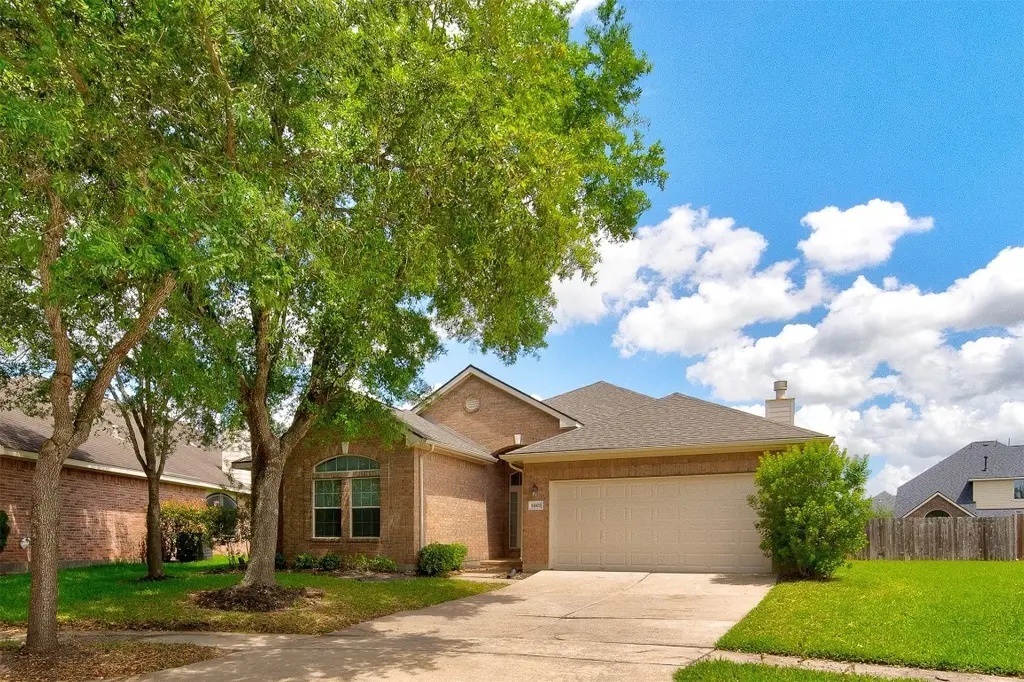
14103 Spring Knoll Ln · Pearland, TX
Flood risk No data
- FEMA flood zone
- —
- Chance of flooding over 30 yrs
- —
- Est. flood insurance / yr
- —
Fire risk No data
- Est. fire insurance / yr
- —
Heat risk No data
- Hot days now (above threshold)
- —
- Hot days in 30 yrs
- —
Wind risk No data
- Chance of severe wind over 30 yrs
- —
Air-quality risk No data
- Unhealthy air days now
- —
- Unhealthy air days in 30 yrs
- —
Risk factors via First Street. Map © Google.
Why this score? — see what drove the D grade
The composite is a weighted blend of 9 inputs, each scored 0–100. Each bar is that input's sub-score; the figure is the points it added to the 100-point composite (weight × sub-score).
- Cash flow +11.0/30.0
- ARV discount +10.7/15.0
- 1% rule +4.7/10.0
- Livability +4.0/5.0
- Schools +3.9/10.0
- DSCR +3.2/10.0
- Rent growth +2.6/5.0
- Condition / age +2.5/5.0
- Appreciation +0.0/10.0
$289,000
🖨 Deal sheet 📄 Offer letter ✓ Due diligence
Listing remarks
Great home on an oversized lot in a desirable neighborhood. Features a spacious open layout with a move-in ready feel, offering plenty of room for everyday living and entertaining. Property is in great condition and includes all appliances. Recent major upgrade includes a brand new roof installed just weeks ago, adding long-term value and peace of mind for the next owner. A solid opportunity for buyers looking for comfort, space, and value in a well-established neighborhood.
Key facts
- 0.25 acre lot
- 2 garage spots
- Built 2004
Property features AI
Finance
- HOA & community: Association: Goodwin & Company; Annual association fee of $700
Exterior
- Parking: Attached garage with 2 spaces
- Utilities: Public water; Public sewer
- Home design: Residential property; Built in 2004; Slab foundation
- Construction: Brick and wood siding exterior; Composition roof
- Exterior features: Subdivision lot
Interior
- Kitchen: Dishwasher; Electric cooktop; Microwave
- Bedrooms: Primary bedroom on first floor (16x12); Bedroom on first floor (15x13); Bedroom on first floor (14x10); Bedroom on first floor (12x10)
- Bathrooms: Three full bathrooms
- Heating & cooling: Central heating (gas); Central electric air conditioning
- Interior features: One fireplace; Seller provided disclosure available
- Laundry & utility: Lease considered
Neighborhood map
What this means for you Summary
Snapshot
- This is a 4-bed/3.0-bath single-family listed at $289k.
Deal economics
- At list price, monthly cash flow is $-120 ($-1k/yr) — negative.
- To cash-flow at today's rent, offer at most $268k (7.3% below list).
- To meet the 1% rule (rent ≥ 1% of price), the offer needs to be $281k (2.6% below list).
- Recommended offer: $268k (7.3% below list) — sets the bar for cash-flow.
- Cap rate 5.8% vs local median 3.0% in Pearland — top-decile yield for the area; either an underpriced asset or a hidden risk that comps aren't pricing in. Stress-test before assuming the spread holds.
Location & tenants
- Location reads 81/100 on livability (#32 in TX, #1,539 nationally) — a professional / high-income tenant draw. Strengths: employment A+, housing A+, crime A; Watch: amenities D-, commute F.
- Alvin ISD (suburban): math 39% / reading 48% proficiency, ranked #255 of 826 in TX (top 31%) — families likely to look elsewhere, expect single-tenant / working-renter base with shorter leases.
- Zoned schools: Savannah Lakes El (math 32% / reading 43%, grade F, #1,744 of 4,322 statewide, top 41%, 809 students, 54% FRL); Manvel H S (math 48% / reading 48%, grade D, #571 of 1,632 statewide, top 36%, 2,607 students, 57% FRL).
- Market conditions: Rents flat; 1139 active listings in the ZIP; 3 comparable units currently listed for rent nearby; rentals lingering (median 44d on market — plan ~5-8 weeks vacancy on turnover, expect pricing pressure); 100% of comp listings sitting > 30 days — soft ceiling on asking rent; high-income renter base; 3,960 units permitted in Brazoria County in 2024 (593 in 5+ unit buildings).
Forward outlook
- Local home prices are declining (-3.0%/yr); year-one equity from $2k of loan paydown is wiped out by about $9k of value loss. Plan a longer hold.
- Brazoria County population projected at +44% by 2050 — long-run rental-demand tailwind backs the buy-and-hold thesis.
Negotiation context
- Only 14 days on market — expect competitive offers; lowballing is unlikely to land.
- 3 sale attempts since 19y ago with the ask held roughly flat each time — persistent listings suggest the price (not the market) is what's stuck; bring a comps-based counter.
Risks & watch-outs
- Watch-outs: property tax is 2.7% of price.
Questions for the listing agent
- What do current leases actually rent for vs. the listed asking? Can we see a recent rent roll and the last 12 months of T-12 income?
- Property tax is high relative to price — has the assessment been appealed recently, and will the sale trigger a re-assessment?
- What does the HOA fee cover, when was the last increase, and are there any pending special assessments or reserve-fund shortfalls?
- Is there a deadline driving the sale (1031 exchange, divorce, estate, relocation)? That informs how much negotiation room exists.
- Schools are A-rated — typically a magnet for longer-tenancy family renters. What's the average tenant stay here, and is there a school-zone premium baked into asking?
- The area grade is low — what's the realistic commute time and amenity access for the typical tenant pool here? Any planned neighborhood developments (good or bad) we should know about?
- What's the average days-on-market for RENTAL listings here right now (not sales)? A rising rental-DOM trend means longer vacancies and softer asking-rent achievability than the comps imply.
- What's the recent tenant-quality profile in this submarket — average credit score on applications, eviction rate, late-payment / NSF rate, and stable-employment percentage? A property-management company in the area should have these aggregated.
- How much new for-sale + rental construction is in the pipeline within 1–3 miles? Heavy new supply typically softens prices + rents 12–24 months out; constrained supply supports both.
Investment metrics
- 1% rule
- 0.97% ✗
- Cap rate
- 5.80%
- Cash-on-cash
- -1.78%
- DSCR
- 0.92
- GRM
- 8.6
CMA / ARV
- ARV (on-the-fly)
- $311,264
- Comps found
- 12
Show comp detail 12 sales within ~0.75 mi
| Address | Dist | Beds/Ba | Sqft | Sold | Price | $/sf | Match |
|---|---|---|---|---|---|---|---|
| 14116 Spring Knoll Ln | 0.07mi | 3/2.5 (-1) | 2,306 (+2%) | 2mo | $278,000 | $121 | 86 |
| 14206 Windy Ridge Ln | 0.12mi | 4/2.5 | 2,465 (+8%) | 2mo | $298,000 | $121 | 77 |
| 5732 Montclair Hill Ln | 0.27mi | 3/2.5 (-1) | 2,335 (+3%) | 2mo | $264,900 | $113 | 74 |
| 14217 Stone Bluff Ln | 0.19mi | 3/2.0 (-1) | 2,128 (-6%) | 1mo | $265,000 | $125 | 71 |
| 5707 Meadow Breeze Ln | 0.42mi | 4/3.5 | 2,119 (-7%) | 2mo | $235,000 | $111 | 65 |
| 5142 Dunstable Manor Ln | 0.70mi | 4/2.5 | 2,273 (0%) | 1mo | $350,000 | $154 | 64 |
| 13805 Bright Canyon Ln | 0.62mi | 4/2.0 | 2,312 (+2%) | 1mo | $334,900 | $145 | 63 |
| 5607 Lilywood Ct | 0.41mi | 3/2.5 (-1) | 2,082 (-8%) | 5mo | $299,000 | $144 | 56 |
| 5716 Meadow Breeze Ln | 0.38mi | 3/2.0 (-1) | 2,068 (-9%) | 4mo | $269,900 | $131 | 55 |
| 1619 Dolores St | 0.56mi | 3/2.0 (-1) | 2,048 (-10%) | 0mo | $295,000 | $144 | 48 |
| 13838 Madera Bend Ln | 0.71mi | 4/2.5 | 2,480 (+9%) | 2mo | $374,990 | $151 | 48 |
| 13408 Baron Hill Ln | 0.63mi | 3/2.0 (-1) | 2,010 (-12%) | 1mo | $275,000 | $137 | 41 |
Match score weights: distance 35% · size 25% · config 20% · recency 20%. Top-matched comps best support the ARV.
Projected returns pro-forma
-3.0% appreciation · 0.44% rent growth · sell at horizon
- IRR
- -22.6%
- Equity multiple
- 0.24×
- Total profit
- $-61,273
- Equity at exit
- $43,091
- IRR
- -27.0%
- Equity multiple
- -0.11×
- Total profit
- $-89,694
- Equity at exit
- $24,987
Cash invested: $80,920 (down + closing). Projections, not guarantees.
Landlord ↔ Tenant lean methodology
- Overall (STATE)
- 87 Strongly Landlord-Friendly
- State Texas
- 87 Strongly Landlord-Friendly · R+5
- County
- — inherits STATE
- City
- — inherits STATE
ZIP-level market 77583
- Rents YoY
- 0.4%
- Active inventory
- 1139
- Price-to-rent
- 8.6×
Monthly cashflow live
- Estimated rent
- $2,813 medium interval (Pro) →
- Mortgage (P&I)
- −$1,516
- Tax from tax record
- −$648 /mo · $7,782/yr
- Insurance
- −$120
- HOA
- −$58
- Vacancy / Maint / Mgmt
- −$591
- Net cashflow
- $-120
Break-even live
UW: 25.0% down · 7.5% · 30yr · 1.5% tax · 5.0% vac · 8.0% maint · 8.0% mgmt
Financing live
Cash to close
- Down payment
- $72,250
- Closing costs
- $8,670
- Reserves months
- —
- Total cash needed
- —
Loan-product check · same deal, 3 products live
Conventional
25% down · 7.5% · 30yr
- Down + closing
- —
- Monthly P&I
- —
- Monthly cashflow
- —
- DSCR
- —
- Eligible?
- —
Personal DTI + credit; lowest rate.
DSCR
20% down · 8.5% · 30yr
- Down + closing
- —
- Monthly P&I
- —
- Monthly cashflow
- —
- DSCR
- —
- Eligible?
- —
No personal income docs; deal must DSCR.
Hard money
10% down · 12.0% · 12mo
- Down + closing
- —
- Monthly P&I
- —
- Monthly cashflow
- —
- DSCR
- —
- Eligible?
- —
Short-term bridge; refi at stabilization.
Rent comps 3 comps
| Address | Beds | Baths | Sqft | Rent | $/sqft | DOM | Units | Dist |
|---|---|---|---|---|---|---|---|---|
| 318 Manor Ave Rosharon, TX | 3.0 | 3.0 | 1924 | $2,400 | $1.25 | 43d | 1 | 0.98mi |
| 13104 Spear Trail Ct Rosharon, TX | 4.0 | 2.5 | 3050 | $2,900 | $0.95 | 43d | 1 | 0.98mi |
| 5507 Rio Ramos St Rosharon, TX | 4.0 | 2.5 | 1968 | $2,150 | $1.09 | 43d | 1 | 1.18mi |
HOA detail
- Monthly dues
- $58 · $696/yr
Listing history 10 events
-
2026-04-25status Pending
-
2026-04-25historical
-
2026-04-23status Pending
-
2026-04-16status Pending
-
2026-04-09$289,000 Active
-
2026-04-06soldstatus
-
2008-01-31historical
-
2007-06-09$178,990
-
2007-05-31historical
-
2007-01-13$179,900
ⓘ Source: listings_history table (triggers on properties + properties_extension) + one-shot
backfill from property_details.listing_events for pre-trigger history.
Tax reassessment forecast TX · Resets to sale price
- Current annual tax
- $7,782 · $648/mo
- Projected year-2 tax
- $7,782 · $648/mo
- Expected delta
- $0/yr ($0/mo · 0.0%)
ⓘ Screening estimate from a state-policy table — verify with the county assessor before closing.
Nearby sold comps map
Loading sold comps map…
Walkable amenities ~0.75 mi
Loading nearby amenities…
Taxation est. · year 1
- Rental income
- $33,762
- − Mortgage interest
- −$16,188
- − Property taxes
- −$7,782
- − Insurance
- −$1,445
- − Repairs & maintenance
- −$2,701
- − Management
- −$2,701
- − HOA
- −$696
- − Depreciation
- −$8,407
- Taxable loss
- −$6,159
- Est. tax savings @ 24.0%
- +$1,478
- After-tax cash flow
- $40/yr
For passive investors: Depreciation is non-cash, so a rental often shows a tax loss while cash-flowing — sheltering income. Rental losses are passive: they offset passive income freely, and up to $25,000/yr can offset ordinary (W-2) income if you actively participate and your MAGI is under $100k (phasing out to $0 by $150k); unused losses carry forward. On sale, claimed depreciation is recaptured at up to 25%, and gains may owe capital-gains tax (a 1031 exchange can defer both). Figures are a year-1 estimate at your 24.0% rate — not tax advice; consult a CPA.
Schools (NCES district)
- District
- Alvin ISD
- NCES district ID
- 4808090
- Math proficiency
- 39% ▼ -11.00%
- Reading proficiency
- 48% ▬ 0.00%
- Median HH income
- $66,740
- Composite
- 38.96/100
- National rank
- #4080
- State rank
- #255 of 826 in TX
Livability — Pearland
- Score
- 81/100
- State rank
- #32
- US rank
- #1539
Category grades
Schools grade is shown separately in the Schools card above.
Census & demographics
- County
- Brazoria County · 374,982 people
- City population
- 142,397
- Metro
- Houston-The Woodlands-Sugar Land, TX
- Population (ZIP)
- 52,747
- Household income
- $119,287
- Rent vs Own
- Severe rent burden
- 251.0
Population outlook (Brazoria County) Hauer SSP2
- Today (2025)
- 420,414 people
- By 2030
- 457,585 · +8.8%
- By 2040
- 532,232 · +26.6%
- By 2050
- 605,399 · +44.0%
- By 2075
- 779,358 · +85.4%
- By 2100
- 883,759 · +110.2%
Race, ethnicity, and origin ACS 2023
- Neighborhood character
- Highly diverse neighborhood (Simpson 0.70)
- Race & ethnicity
- Hispanic / Latino 38% Black 34% White 20% Two or more races 18% Asian 5%
- Hispanic origin (detail)
- Mexican 31% Puerto Rican 2%
- Common ancestry
- Lithuanian 1% Slovak 1% Romanian 1%
- Foreign-born
- 16% · Canada, Vietnam, China
- Languages at home
- 64% English-only · Spanish 28% Other Asian/Pacific 2% Vietnamese 1%
Political lean MEDSL · Brazoria
- 2024 margin
- R (+19.7) · D 39.5% · R 59.2% · Other 1.3%
- 2008→2024 swing
- +9.9pp toward D · 2008: -29.6pp · 2024: -19.7pp
- All cycles
- 2024: R+19.7 2020: R+18.2 2016: R+24.6 2012: R+34.2 2008: R+29.6
Not yet ingested
- Civics
- —
Market trends
- HPI YoY
- ▼ -120.19%
- Current HPI
- 198.6559
- Rent YoY
- ▲ 0.44%
- Metro
- Houston-The Woodlands-Sugar Land, TX
- State GDP YoY
- ▲ 3.95%
- F500 in state
- 110
Industry mix (Fortune 500 HQ in TX)
| Industry | F500 HQs | Revenue |
|---|---|---|
| Energy | 16 | $1,198B |
|
||
| Technology | 5 | $198B |
|
||
| Engineering / Construction | 4 | $72B |
|
||
| Energy Services | 3 | $60B |
|
||
| Utilities | 3 | $41B |
|
||
| Healthcare | 2 | $330B |
|
||
Price history
+60.6% since first listed10 events — show timeline
- 2026-04-25 Pending — HARMLS
- 2026-04-25 Listing Removed — HARMLS
- 2026-04-23 Pending — HARMLS
- 2026-04-16 Pending — HARMLS
- 2026-04-09 Listed $289,000 HARMLS
- 2026-04-06 Sold (Public Records) — Public Records
- 2008-01-31 Listing Removed — HARMLS
- 2007-06-09 Listed $178,990 HARMLS
- 2007-05-31 Listing Removed — HARMLS
- 2007-01-13 Listed $179,900 HARMLS
Property tax history
+2.2%/yrLatest (2025): $7,782 · -8.5% YoY. Source: county tax records.
Cash-flow waterfall
monthlySold comps — $/sqft
last 12 mo · ≤1 miLoading sold comps…