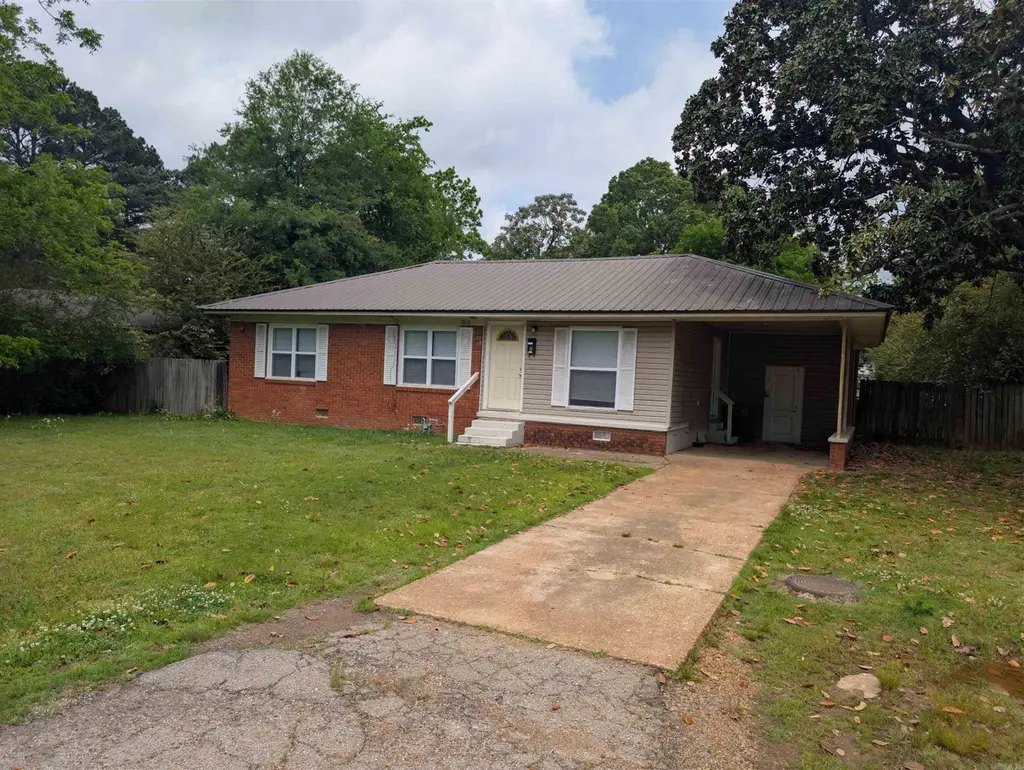
1808 W Ctr · Searcy, AR
Flood risk 1/10 · Minimal
- FEMA flood zone
- X (unshaded)
- Chance of flooding over 30 yrs
- 0.0%
- Est. flood insurance / yr
- $507 – $1,088
Fire risk 4/10 · Minor
- Est. fire insurance / yr
- $1,499 – $2,785
Heat risk 6/10 · Moderate
- Hot days now (above 111°F)
- 7 days/yr
- Hot days in 30 yrs
- 19 days/yr
Wind risk 3/10 · Minor
- Chance of severe wind over 30 yrs
- 6.0%
Air-quality risk 1/10 · Minimal
- Unhealthy air days now
- 0 days/yr
- Unhealthy air days in 30 yrs
- 0 days/yr
Risk factors via First Street. Map © Google.
Why this score? — see what drove the C- grade
The composite is a weighted blend of 9 inputs, each scored 0–100. Each bar is that input's sub-score; the figure is the points it added to the 100-point composite (weight × sub-score).
- Cash flow +17.9/30.0
- ARV discount +12.2/15.0
- DSCR +5.6/10.0
- Schools +3.8/10.0
- 1% rule +3.7/10.0
- Livability +3.5/5.0
- Rent growth +2.5/5.0
- Condition / age +2.5/5.0
- Appreciation +0.0/10.0
$159,000
🖨 Deal sheet (PDF) 📄 Offer letter ✓ Due diligence
Listing remarks
This single-family home offers comfortable living in a desirable, established neighborhood. The single-story residence features approximately 1,770 square feet of living space on a spacious lot with a big lawn and fully fenced backyard—perfect for kids, pets, and outdoor enjoyment. Close to Searcy High School and Southwest Middle School. Easy access to everyday amenities, parks, and downtown Searcy. Quiet, tree-lined street in a mature neighborhood with a strong community feel. This property is a fantastic opportunity for first-time buyers, growing families, or investors seeking a solid home in a convenient location in Searcy. With its big fenced yard and proximity to top-rated school
Key facts
- Mature neighborhood
- 1,306 sq ft lot
- Built 1960
Tags
Property features AI
Finance
- HOA & community: Annual HOA frequency
Exterior
- Parking: Carport
- Utilities: Public sewer; Public water; Municipal electric (Entergy); Natural gas
- Home design: Brick and frame combination exterior
- Construction: Metal roof; Slab/crawl combination foundation
- Exterior features: Level lot; Paved road frontage; Inside city limits
Interior
- Flooring: Wood flooring
- Bathrooms: 2 full bathrooms
- Heating & cooling: Central cooling (electric); Central heat (gas)
- Interior features: Wood floors; Kitchen equipment: Other (see remarks)
Neighborhood map
What this means for you Summary
Snapshot
- This is a 3-bed/2.0-bath single-family listed at $159k.
Deal economics
- At list price, monthly cash flow is $134 ($2k/yr) — positive.
- The deal already cash-flows at list — no discount required.
- To meet the 1% rule (rent ≥ 1% of price), the offer needs to be $138k (13.2% below list).
- Recommended offer: $138k (13.2% below list) — sets the bar for 1% rule.
- Cap rate 7.3% vs local median 3.3% in Searcy — top-decile yield for the area; either an underpriced asset or a hidden risk that comps aren't pricing in. Stress-test before assuming the spread holds.
Location & tenants
- Location reads 70/100 on livability (#51 in AR) — a middle-class / working-renter tenant base. Strengths: cost of living A+, health & safety A+, housing A-; Watch: crime D, commute F, employment F.
- Searcy School District (town): math 47% / reading 43% proficiency, ranked #37 of 238 in AR (top 16%) — families likely to look elsewhere, expect single-tenant / working-renter base with shorter leases.
- Market conditions: 173 active listings in the ZIP; 3 comparable units currently listed for rent nearby; rentals lingering (median 44d on market — plan ~5-8 weeks vacancy on turnover, expect pricing pressure); 100% of comp listings sitting > 30 days — soft ceiling on asking rent; 219 units permitted in White County in 2024 (36 in 5+ unit buildings).
Forward outlook
- Local home prices are declining (-3.0%/yr); year-one equity from $1k of loan paydown is wiped out by about $5k of value loss. Plan a longer hold.
- White County population projected at +7% by 2050 — modest demand growth; plan on rents tracking national, not racing it.
Negotiation context
- Only 4 days on market — expect competitive offers; lowballing is unlikely to land.
Risks & watch-outs
- Climate carrying-cost: extreme-heat days projected 7→19/yr by 2055 (HVAC capex compounding) — expect insurance premiums to compound above CPI over the hold.
Questions for the listing agent
- Built in 1960 — when were the roof, HVAC, electrical panel, plumbing, and water heater last replaced?
- Is there a deadline driving the sale (1031 exchange, divorce, estate, relocation)? That informs how much negotiation room exists.
- Crime grade is D in this area — have there been break-ins, vandalism, or insurance claims at this property in the last 3 years? What carrier currently insures it and at what premium?
- What's the average days-on-market for RENTAL listings here right now (not sales)? A rising rental-DOM trend means longer vacancies and softer asking-rent achievability than the comps imply.
- What's the recent tenant-quality profile in this submarket — average credit score on applications, eviction rate, late-payment / NSF rate, and stable-employment percentage? A property-management company in the area should have these aggregated.
- How much new for-sale + rental construction is in the pipeline within 1–3 miles? Heavy new supply typically softens prices + rents 12–24 months out; constrained supply supports both.
Investment metrics
- 1% rule
- 0.87% ✗
- Cap rate
- 7.31%
- Cash-on-cash
- 3.62%
- DSCR
- 1.16
- GRM
- 9.6
CMA / ARV
- ARV (median comp)
- $177,652
- List price
- $159,000
- Delta
- -10.50%
- Verdict
- UNDERPRICED
- Comps
- 20 within 1.0 mi
Show comp detail 12 sales within ~0.75 mi
| Address | Dist | Beds/Ba | Sqft | Sold | Price | $/sf | Match |
|---|---|---|---|---|---|---|---|
| 1808 W Ctr | 0.00mi | 3/2.0 | 1,770 (0%) | 1mo | $145,000 | $82 | 99 |
| 1806 W Arch Ave | 0.13mi | 3/2.0 | 1,676 (-5%) | 1mo | $135,000 | $81 | 85 |
| 1 Foxboro Dr | 0.38mi | 4/2.0 (+1) | 1,774 (+0%) | 0mo | $212,900 | $120 | 77 |
| 9 Brookwood | 0.53mi | 3/2.0 | 1,796 (+2%) | 2mo | $218,500 | $122 | 71 |
| 1903 W Arch Ave | 0.19mi | 3/2.5 | 1,972 (+11%) | 1mo | $146,500 | $74 | 69 |
| 1612 W Vine St | 0.22mi | 3/2.0 | 1,526 (-14%) | 2mo | $224,400 | $147 | 65 |
| 130 Western Hills Dr | 0.40mi | 3/2.0 | 1,598 (-10%) | 2mo | $210,000 | $131 | 63 |
| 318 N Sawmill Rd | 0.55mi | 3/2.0 | 1,633 (-8%) | 1mo | $240,000 | $147 | 61 |
| 404 S Sawmill Rd | 0.57mi | 3/2.0 | 1,602 (-10%) | 1mo | $189,000 | $118 | 57 |
| 61 Rebecca Ln | 0.59mi | 3/2.0 | 1,528 (-14%) | 2mo | $215,000 | $141 | 48 |
| 311 N Sawmill Rd | 0.60mi | 3/2.0 | 1,511 (-15%) | 1mo | $213,000 | $141 | 47 |
| 2222 Caleb Dr | 0.74mi | 3/2.0 | 1,561 (-12%) | 2mo | $210,000 | $135 | 45 |
Match score weights: distance 35% · size 25% · config 20% · recency 20%. Top-matched comps best support the ARV.
Projected returns pro-forma
-3.0% appreciation · 3.0% rent growth · sell at horizon
- IRR
- -10.7%
- Equity multiple
- 0.61×
- Total profit
- $-17,289
- Equity at exit
- $23,707
- IRR
- -1.4%
- Equity multiple
- 0.90×
- Total profit
- $-4,327
- Equity at exit
- $13,747
Cash invested: $44,520 (down + closing). Projections, not guarantees.
Landlord ↔ Tenant lean methodology
- Overall (STATE)
- 92 Strongly Landlord-Friendly
- State Arkansas
- 92 Strongly Landlord-Friendly · R+14
- County
- — inherits STATE
- City
- — inherits STATE
ZIP-level market 72143
- Home prices YoY
- -28.4%
- Active inventory
- 173
- Price-to-rent
- 9.6×
Monthly cashflow live
- Estimated rent
- $1,380 medium interval (Pro) →
- Mortgage (P&I)
- −$834
- Tax from tax record
- −$56 /mo · $670/yr
- Insurance
- −$66
- HOA
- −$0
- Vacancy / Maint / Mgmt
- −$290
- Net cashflow
- $134
Break-even live
Sensitivity live
| Price | -10% $224 | -5% $179 | +0% $134 | +5% $89 | +10% $44 |
|---|---|---|---|---|---|
| Rent | -10% $25 | -5% $80 | +0% $134 | +5% $189 | +10% $243 |
| Rate | -1.0pp $214 | -0.5pp $175 | base $134 | +0.5pp $93 | +1.0pp $51 |
UW: 25.0% down · 7.5% · 30yr · 1.5% tax · 5.0% vac · 8.0% maint · 8.0% mgmt
Financing live
Cash to close
- Down payment
- $39,750
- Closing costs
- $4,770
- Reserves months
- —
- Total cash needed
- —
Loan-product check · same deal, 3 products live
Conventional
25% down · 7.5% · 30yr
- Down + closing
- —
- Monthly P&I
- —
- Monthly cashflow
- —
- DSCR
- —
- Eligible?
- —
Personal DTI + credit; lowest rate.
DSCR
20% down · 8.5% · 30yr
- Down + closing
- —
- Monthly P&I
- —
- Monthly cashflow
- —
- DSCR
- —
- Eligible?
- —
No personal income docs; deal must DSCR.
Hard money
10% down · 12.0% · 12mo
- Down + closing
- —
- Monthly P&I
- —
- Monthly cashflow
- —
- DSCR
- —
- Eligible?
- —
Short-term bridge; refi at stabilization.
Rent comps 3 comps
| Address | Beds | Baths | Sqft | Rent | $/sqft | DOM | Units | Dist |
|---|---|---|---|---|---|---|---|---|
| 32 Robbye Ln Searcy, AR | 3.0 | 2.0 | 1331 | $1,400 | $1.05 | 44d | 1 | 0.32mi |
| 27 Jenny Lynne Dr Searcy, AR | 3.0 | 2.0 | 1645 | $1,450 | $0.88 | 44d | 1 | 1.06mi |
| 1905 Rehoboth Cir Searcy, AR | 3.0 | 2.0 | 1304 | $1,450 | $1.11 | 44d | 1 | 1.35mi |
Listing history 3 events
-
2026-05-04status Under Contract 745-char remark
-
2026-04-30$159,000 New Listing 745-char remark
-
1997-04-04soldstatus $72,000
ⓘ Source: listings_history table (triggers on properties + properties_extension) + one-shot
backfill from property_details.listing_events for pre-trigger history.
Tax reassessment forecast AR · Resets to sale price
- Current annual tax
- $670 · $56/mo
- Projected year-2 tax
- $1,018 · $85/mo
- Expected delta
- +$348/yr (+$29/mo · 51.9%)
ⓘ Screening estimate from a state-policy table — verify with the county assessor before closing.
Climate risk First Street
- Flood 1/10 Low FEMA zone X (unshaded) · 0% chance over 30 yrs
- Wildfire 4/10 Moderate
- Heat 6/10 Major 7 d/yr ≥111°F today · 19 d/yr by 30 yrs out
- Wind 3/10 Moderate 6% chance of damaging wind over 30 yrs
- Air quality 1/10 Low 0 unhealthy d/yr today · 0 by 30 yrs out
Nearby sold comps map
Loading sold comps map…
Walkable amenities ~0.75 mi
Loading nearby amenities…
Taxation est. · year 1
- Rental income
- $16,557
- − Mortgage interest
- −$8,906
- − Property taxes
- −$670
- − Insurance
- −$795
- − Repairs & maintenance
- −$1,325
- − Management
- −$1,325
- − Depreciation
- −$4,625
- Taxable loss
- −$1,089
- Est. tax savings @ 24.0%
- +$261
- After-tax cash flow
- $1,871/yr
For passive investors: Depreciation is non-cash, so a rental often shows a tax loss while cash-flowing — sheltering income. Rental losses are passive: they offset passive income freely, and up to $25,000/yr can offset ordinary (W-2) income if you actively participate and your MAGI is under $100k (phasing out to $0 by $150k); unused losses carry forward. On sale, claimed depreciation is recaptured at up to 25%, and gains may owe capital-gains tax (a 1031 exchange can defer both). Figures are a year-1 estimate at your 24.0% rate — not tax advice; consult a CPA.
Schools (NCES district)
- District
- Searcy School District
- NCES district ID
- 0512210
- Math proficiency
- 47% ▼ -11.00%
- Reading proficiency
- 43% ▼ -10.00%
- Median HH income
- $44,318
- Composite
- 38.12/100
- National rank
- #4272
- State rank
- #37 of 238 in AR
Livability — Searcy
- Score
- 70/100
- State rank
- #51
- US rank
- #7408
Category grades
Schools grade is shown separately in the Schools card above.
Census & demographics
- Census place
- Searcy, AR
- County
- White County · 35,000 people
- City population
- 35,000
- Metro
- Searcy, AR
- Population (ZIP)
- 35,000
- Household income
- $58,344
- Rent vs Own
- Severe rent burden
- 804.0
Population outlook (White County) Hauer SSP2
- Today (2025)
- 82,310 people
- By 2030
- 83,861 · +1.9%
- By 2040
- 86,492 · +5.1%
- By 2050
- 88,246 · +7.2%
- By 2075
- 91,307 · +10.9%
- By 2100
- 91,548 · +11.2%
Race, ethnicity, and origin ACS 2023
- Neighborhood character
- Predominantly White (82%)
- Race & ethnicity
- White 82% Black 7% Hispanic / Latino 6% Two or more races 5%
- Hispanic origin (detail)
- Mexican 4%
- Common ancestry
- Italian 2% Slovak 1% Serbian 1%
- Foreign-born
- 2% · Canada
- Languages at home
- 95% English-only · Spanish 4%
Political lean MEDSL · White
- 2024 margin
- Solid R (+61.2) · D 18.3% · R 79.5% · Other 2.2%
- 2008→2024 swing
- -14.0pp toward R · 2008: -47.2pp · 2024: -61.2pp
- All cycles
- 2024: R+61.2 2020: R+58.9 2016: R+57.9 2012: R+53.7 2008: R+47.2
Not yet ingested
- Civics
- —
Market trends
- HPI YoY
- ▼ -81.60%
- Current HPI
- 206.0334
- Rent YoY
- —
- Metro
- Searcy, AR
- State GDP YoY
- ▲ 3.80%
- F500 in state
- 10
Industry mix (Fortune 500 HQ in AR)
| Industry | F500 HQs | Revenue |
|---|---|---|
| Retail | 1 | $681B |
|
||
| Food / Agriculture | 1 | $53B |
|
||
| Retail / Energy | 1 | $22B |
|
||
| Transportation / Logistics | 1 | $12B |
|
||
| Energy | 1 | $4B |
|
||
Price history
+101.4% since first listed5 events — show timeline
- 2026-06-02 Sold (Public Records) $145,000 Public Records
- 2026-06-01 Sold (MLS) $145,000 CARMLS
- 2026-05-04 Pending — CARMLS
- 2026-04-30 Listed $159,000 CARMLS
- 1997-04-04 Sold (Public Records) $72,000 Public Records
Property tax history
-1.1%/yrLatest (2025): $670 · +0.0% YoY. Source: county tax records.
Cash-flow waterfall
monthlySold comps — $/sqft
last 12 mo · ≤1 miLoading sold comps…