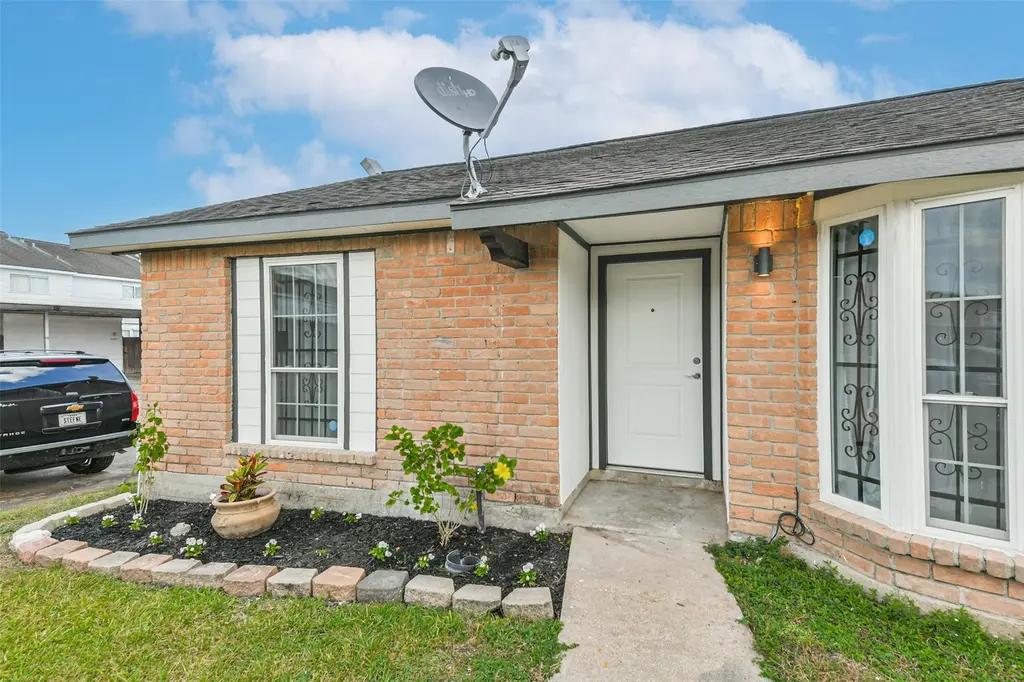
6853 Chasewood Dr · Houston, TX
Flood risk 1/10 · Minimal
- FEMA flood zone
- X (unshaded)
- Chance of flooding over 30 yrs
- 0.0%
- Est. flood insurance / yr
- $507 – $1,088
Fire risk 3/10 · Minor
- Est. fire insurance / yr
- $1,222 – $2,270
Heat risk 9/10 · Severe
- Hot days now (above 110°F)
- 7 days/yr
- Hot days in 30 yrs
- 23 days/yr
Wind risk 9/10 · Severe
- Chance of severe wind over 30 yrs
- 99.0%
Air-quality risk 3/10 · Minor
- Unhealthy air days now
- 2 days/yr
- Unhealthy air days in 30 yrs
- 3 days/yr
Risk factors via First Street. Map © Google.
Why this score? — see what drove the C+ grade
The composite is a weighted blend of 9 inputs, each scored 0–100. Each bar is that input's sub-score; the figure is the points it added to the 100-point composite (weight × sub-score).
- Cash flow +23.2/30.0
- 1% rule +9.0/10.0
- DSCR +7.5/10.0
- ARV discount +5.5/15.0
- Appreciation +4.7/10.0
- Schools +4.5/10.0
- Livability +3.7/5.0
- Rent growth +2.6/5.0
- Condition / age +2.5/5.0
$102,000
🖨 Deal sheet (PDF) 📄 Offer letter ✓ Due diligence
Listing remarks MLS
This charming 2 bedroom, 1 bath townhouse offers a bright, open layout with a comfortable living area and kitchen that is perfect. The home features a living/kitchen combo with a granite breakfast bar, new cabinets, beautiful tile floors, recessed lighting and a private covered carport. It also features fresh paint throughout, new doors, new shower tile and a new tub. Enjoy the ease of single-story living where the grounds are covered by the HOA and a location close to major commuter routes, shopping, and dining. The home has quick access to Beltway 8, Fort Bend Toll Road Hwy 90 & 59. Please call if you have any questions!
Key facts
- Fresh paint
- New cabinets
- Recessed lighting
Tags
Neighborhood map
What this means for you Summary
Snapshot
- This is a 2-bed/1.0-bath townhouse listed at $102k.
Deal economics
- At list price, monthly cash flow is $185 ($2k/yr) — positive.
- The deal already cash-flows at list — no discount required.
- Meets the 1% rule at list price ($1k rent vs $102k).
- Recommended offer: $96k (6.0% below list) — sets the bar for market timing.
- Cap rate 8.5% vs local median 3.2% in Houston — top-decile yield for the area; either an underpriced asset or a hidden risk that comps aren't pricing in. Stress-test before assuming the spread holds.
Location & tenants
- Location reads 74/100 on livability (#184 in TX, #4,771 nationally) — a middle-class / working-renter tenant base. Strengths: amenities A+, cost of living A+, housing A+; Watch: schools D, crime F.
- Fort Bend ISD (suburban): math 44% / reading 53% proficiency, ranked #140 of 826 in TX (top 17%) — families likely to look elsewhere, expect single-tenant / working-renter base with shorter leases.
- Market conditions: Rents flat; 188 active listings in the ZIP; 19 comparable units currently listed for rent nearby; rentals at typical pace (median 14d on market — plan ~3-4 weeks tenant-placement turnaround); 12,093 units permitted in Fort Bend County in 2024 (815 in 5+ unit buildings).
Forward outlook
- In year one you build about $143 of equity ($705 loan paydown + $-562 appreciation (-0.6% local appreciation)).
- Fort Bend County population projected at +75% by 2050 — long-run rental-demand tailwind backs the buy-and-hold thesis.
Negotiation context
- It's been on market 83 days — a 6% lower offer ($96k) is reasonable based on typical stale-listing flexibility.
- 5 sale attempts with the ask held roughly flat each time — persistent listings suggest the price (not the market) is what's stuck; bring a comps-based counter.
Risks & watch-outs
- Climate carrying-cost: severe wind risk, 99% chance of damaging wind over 30y; extreme-heat days projected 7→23/yr by 2055 (HVAC capex compounding) — expect insurance premiums to compound above CPI over the hold.
Questions for the listing agent
- It's been on market 83 days. Have you received any prior offers? Is the seller open to a 6% concession, seller financing, or rate buy-down credit?
- Built in 1974 — when were the roof, HVAC, electrical panel, plumbing, and water heater last replaced?
- What does the HOA fee cover, when was the last increase, and are there any pending special assessments or reserve-fund shortfalls?
- Why hasn't it sold? Are there any deal-killer items the seller is aware of (foundation, flood, title, zoning, code violations)?
- Is there a deadline driving the sale (1031 exchange, divorce, estate, relocation)? That informs how much negotiation room exists.
- Schools are D-rated, which usually means shorter tenancies and higher turnover. Who's the typical renter profile here, and what's been the actual vacancy rate?
- Crime grade is F in this area — have there been break-ins, vandalism, or insurance claims at this property in the last 3 years? What carrier currently insures it and at what premium?
- What's the average days-on-market for RENTAL listings here right now (not sales)? A rising rental-DOM trend means longer vacancies and softer asking-rent achievability than the comps imply.
- What's the recent tenant-quality profile in this submarket — average credit score on applications, eviction rate, late-payment / NSF rate, and stable-employment percentage? A property-management company in the area should have these aggregated.
- How much new for-sale + rental construction is in the pipeline within 1–3 miles? Heavy new supply typically softens prices + rents 12–24 months out; constrained supply supports both.
Investment metrics
- 1% rule
- 1.40% ✓
- Cap rate
- 8.47%
- Cash-on-cash
- 7.76%
- DSCR
- 1.35
- GRM
- 5.9
CMA / ARV
- ARV (median comp)
- $97,707
- List price
- $102,000
- Delta
- 4.39%
- Verdict
- FAIR
- Comps
- 18 within 1.0 mi
Show comp detail 3 sales within ~0.75 mi
| Address | Dist | Beds/Ba | Sqft | Sold | Price | $/sf | Match |
|---|---|---|---|---|---|---|---|
| 6851 Chasewood Dr | 0.02mi | 2/1.0 | 952 (0%) | 2mo | $79,900 | $84 | 97 |
| 7231 Chasewood Dr | 0.08mi | 2/1.0 | 944 (-1%) | 18mo | $85,000 | $90 | 80 |
| 6917 Chasewood Dr | 0.07mi | 2/1.0 | 944 (-1%) | 21mo | $85,000 | $90 | 78 |
Match score weights: distance 35% · size 25% · config 20% · recency 20%. Top-matched comps best support the ARV.
Projected returns pro-forma
-0.55% appreciation · 0.34% rent growth · sell at horizon
- IRR
- 2.1%
- Equity multiple
- 1.09×
- Total profit
- $2,610
- Equity at exit
- $26,838
- IRR
- 5.4%
- Equity multiple
- 1.49×
- Total profit
- $14,107
- Equity at exit
- $30,118
Cash invested: $28,560 (down + closing). Projections, not guarantees.
Landlord ↔ Tenant lean methodology
- Overall (STATE)
- 87 Strongly Landlord-Friendly
- State Texas
- 87 Strongly Landlord-Friendly · R+5
- County
- — inherits STATE
- City
- — inherits STATE
ZIP-level market 77489
- Home prices YoY
- -0.2%
- Rents YoY
- 0.3%
- Active inventory
- 188
- Price-to-rent
- 5.9×
Monthly cashflow live
- Estimated rent
- $1,430 high interval (Pro) →
- Mortgage (P&I)
- −$535
- Tax from tax record
- −$139 /mo · $1,664/yr
- Insurance
- −$42
- HOA
- −$229
- Vacancy / Maint / Mgmt
- −$300
- Net cashflow
- $185
Break-even live
Sensitivity live
| Price | -10% $242 | -5% $214 | +0% $185 | +5% $156 | +10% $127 |
|---|---|---|---|---|---|
| Rent | -10% $72 | -5% $128 | +0% $185 | +5% $241 | +10% $298 |
| Rate | -1.0pp $236 | -0.5pp $211 | base $185 | +0.5pp $158 | +1.0pp $131 |
UW: 25.0% down · 7.5% · 30yr · 1.5% tax · 5.0% vac · 8.0% maint · 8.0% mgmt
Financing live
Cash to close
- Down payment
- $25,500
- Closing costs
- $3,060
- Reserves months
- —
- Total cash needed
- —
Loan-product check · same deal, 3 products live
Conventional
25% down · 7.5% · 30yr
- Down + closing
- —
- Monthly P&I
- —
- Monthly cashflow
- —
- DSCR
- —
- Eligible?
- —
Personal DTI + credit; lowest rate.
DSCR
20% down · 8.5% · 30yr
- Down + closing
- —
- Monthly P&I
- —
- Monthly cashflow
- —
- DSCR
- —
- Eligible?
- —
No personal income docs; deal must DSCR.
Hard money
10% down · 12.0% · 12mo
- Down + closing
- —
- Monthly P&I
- —
- Monthly cashflow
- —
- DSCR
- —
- Eligible?
- —
Short-term bridge; refi at stabilization.
Rent comps 19 comps
| Address | Beds | Baths | Sqft | Rent | $/sqft | DOM | Units | Dist |
|---|---|---|---|---|---|---|---|---|
| 13960 Hillcroft St Unit 13981 Houston, TX | 1.0 | 1.0 | 1017 | $1,340 | $1.32 | 45d | 1 | 1.03mi |
| 13960 Hillcroft St Unit 13975 Houston, TX | 1.0 | 1.0 | 1017 | $1,299 | $1.28 | 0d | 1 | 1.03mi |
| 13960 Hillcroft St Unit 321 Houston, TX | 1.0 | 1.0 | 1017 | $1,310 | $1.29 | 9d | 1 | 1.03mi |
| 13960 Hillcroft St Unit 13975 Houston, TX | 1.0 | 1.0 | 1017 | $1,345 | $1.32 | 15d | 1 | 1.03mi |
| 13960 Hillcroft St Unit 1174 Houston, TX | 1.0 | 1.0 | 1017 | $1,350 | $1.33 | 12d | 1 | 1.03mi |
| 13939 Hillcroft Ave Unit 13976 Houston, TX | 2.0 | 2.0 | 1089 | $1,703 | $1.56 | 22d | 1 | 1.22mi |
| 13939 Hillcroft Ave Houston, TX | 1.0 | 1.0 | 567 | $1,303 | $2.30 | 45d | 1 | 1.22mi |
| 13939 Hillcroft Ave Houston, TX | 1.0–3.0 | 1.0–2.0 | 985 | $1,778 | $1.80 | 4d | 22 | 1.22mi |
| 13939 Hillcroft Ave Unit 13990 Houston, TX | 1.0 | 1.0 | 567 | $1,184 | $2.09 | 45d | 1 | 1.22mi |
| 13939 Hillcroft Ave Unit 13954 Houston, TX | 1.0 | 1.0 | 587 | $1,223 | $2.08 | 22d | 1 | 1.22mi |
| 16432 Chimney Rock Rd Unit 16489 Houston, TX | 2.0 | 2.0 | 1026 | $1,317 | $1.28 | 45d | 1 | 1.38mi |
| 16432 Chimney Rock Rd Unit 2112 Houston, TX | 2.0 | 2.0 | 1026 | $1,276 | $1.24 | 0d | 1 | 1.38mi |
| 16432 Chimney Rock Rd Unit 16483 Houston, TX | 1.0 | 1.0 | 683 | $916 | $1.34 | 45d | 1 | 1.38mi |
| 16432 Chimney Rock Rd Unit 16453 Houston, TX | 1.0 | 1.0 | 683 | $1,114 | $1.63 | 11d | 1 | 1.38mi |
| 16432 Chimney Rock Rd Apt 424 Houston, TX | 2.0 | 2.0 | 1026 | $1,292 | $1.26 | 6d | 1 | 1.38mi |
| 16432 Chimney Rock Rd Unit 16453 Houston, TX | 1.0 | 1.0 | 670 | $1,110 | $1.66 | 14d | 1 | 1.38mi |
| 16432 Chimney Rock Rd Unit 325 Houston, TX | 1.0 | 1.0 | 683 | $1,064 | $1.56 | 0d | 1 | 1.38mi |
| 16432 Chimney Rock Rd Unit 2174 Houston, TX | 2.0 | 2.0 | 1026 | $1,327 | $1.29 | 11d | 1 | 1.38mi |
| 16432 Chimney Rock Rd Houston, TX | 1.0 | 1.0 | 683 | $1,064 | $1.56 | 14d | 1 | 1.38mi |
HOA detail
- Monthly dues
- $229 · $2,748/yr
- Likely covers
- landscaping
Listing history 31 events
-
2026-06-21days on market $102,000 Active 83 DOM
-
2026-06-18days on market $102,000 Active 80 DOM
-
2026-06-17days on market $102,000 Active 79 DOM
-
2026-06-16days on market $102,000 Active 78 DOM
-
2026-06-15days on market $102,000 Active 77 DOM
-
2026-06-13days on market $102,000 Active 75 DOM
-
2026-06-09days on market $102,000 Active 71 DOM
-
2026-06-07days on market $102,000 Active 69 DOM
-
2026-06-04days on market $102,000 Active 66 DOM
-
2026-06-03days on market $102,000 Active 65 DOM
-
2026-06-02days on market $102,000 Active 64 DOM
-
2026-06-01days on market $102,000 Active 63 DOM
-
2026-05-31days on market $102,000 Active 62 DOM
-
2026-04-27status Active 634-char remark
Show marketing remark (634 chars)
This charming 2 bedroom, 1 bath townhouse offers a bright, open layout with a comfortable living area and kitchen that is perfect. The home features a living/kitchen combo with a granite breakfast bar, new cabinets, beautiful tile floors, recessed lighting and a private covered carport. It also features fresh paint throughout, new doors, new shower tile and a new tub. Enjoy the ease of single-story living where the grounds are covered by the HOA and a location close to major commuter routes, shopping, and dining. The home has quick access to Beltway 8, Fort Bend Toll Road Hwy 90 & 59. Please call if you have any questions!
-
2026-04-22status Pending 634-char remark
Show marketing remark (634 chars)
This charming 2 bedroom, 1 bath townhouse offers a bright, open layout with a comfortable living area and kitchen that is perfect. The home features a living/kitchen combo with a granite breakfast bar, new cabinets, beautiful tile floors, recessed lighting and a private covered carport. It also features fresh paint throughout, new doors, new shower tile and a new tub. Enjoy the ease of single-story living where the grounds are covered by the HOA and a location close to major commuter routes, shopping, and dining. The home has quick access to Beltway 8, Fort Bend Toll Road Hwy 90 & 59. Please call if you have any questions!
-
2026-03-30historical $1,400
Show marketing remark (634 chars)
This charming 2 bedroom, 1 bath townhouse offers a bright, open layout with a comfortable living area and kitchen that is perfect. The home features a living/kitchen combo with a granite breakfast bar, new cabinets, beautiful tile floors, recessed lighting and a private covered carport. It also features fresh paint throughout, new doors, new shower tile and a new tub. Enjoy the ease of single-story living where the grounds are covered by the HOA and a location close to major commuter routes, shopping, and dining. The home has quick access to Beltway 8, Fort Bend Toll Road Hwy 90 & 59. Please call if you have any questions!
-
2026-03-30$102,500 Active 634-char remark
Show marketing remark (634 chars)
This charming 2 bedroom, 1 bath townhouse offers a bright, open layout with a comfortable living area and kitchen that is perfect. The home features a living/kitchen combo with a granite breakfast bar, new cabinets, beautiful tile floors, recessed lighting and a private covered carport. It also features fresh paint throughout, new doors, new shower tile and a new tub. Enjoy the ease of single-story living where the grounds are covered by the HOA and a location close to major commuter routes, shopping, and dining. The home has quick access to Beltway 8, Fort Bend Toll Road Hwy 90 & 59. Please call if you have any questions!
-
2026-02-21status Pending
-
2026-02-20historical
-
2026-02-11price $107,500
-
2026-01-04$1,400
-
2025-12-30historical $1,625
-
2025-12-13price $110,000
-
2025-12-04$1,625
-
2025-11-15price $113,500
-
2025-10-27$115,000 Active
-
2025-07-21soldstatus
-
2015-05-15soldstatus
-
2014-01-09soldstatus
-
2013-11-22soldstatus
-
2012-09-19soldstatus
ⓘ Source: listings_history table (triggers on properties + properties_extension) + one-shot
backfill from property_details.listing_events for pre-trigger history.
Tax reassessment forecast TX · Resets to sale price
- Current annual tax
- $1,664 · $139/mo
- Projected year-2 tax
- $1,867 · $156/mo
- Expected delta
- +$203/yr (+$17/mo · 12.2%)
ⓘ Screening estimate from a state-policy table — verify with the county assessor before closing.
Climate risk First Street
- Flood 1/10 Low FEMA zone X (unshaded) · 0% chance over 30 yrs
- Wildfire 3/10 Moderate
- Heat 9/10 Extreme 7 d/yr ≥110°F today · 23 d/yr by 30 yrs out
- Wind 9/10 Extreme 99% chance of damaging wind over 30 yrs
- Air quality 3/10 Moderate 2 unhealthy d/yr today · 3 by 30 yrs out
Nearby sold comps map
Loading sold comps map…
Walkable amenities ~0.75 mi
Loading nearby amenities…
Taxation est. · year 1
- Rental income
- $17,161
- − Mortgage interest
- −$5,714
- − Property taxes
- −$1,664
- − Insurance
- −$510
- − Repairs & maintenance
- −$1,373
- − Management
- −$1,373
- − HOA
- −$2,748
- − Depreciation
- −$2,967
- Taxable income
- $813
- Est. tax owed @ 24.0%
- −$195
- After-tax cash flow
- $2,022/yr
For passive investors: Depreciation is non-cash, so a rental often shows a tax loss while cash-flowing — sheltering income. Rental losses are passive: they offset passive income freely, and up to $25,000/yr can offset ordinary (W-2) income if you actively participate and your MAGI is under $100k (phasing out to $0 by $150k); unused losses carry forward. On sale, claimed depreciation is recaptured at up to 25%, and gains may owe capital-gains tax (a 1031 exchange can defer both). Figures are a year-1 estimate at your 24.0% rate — not tax advice; consult a CPA.
Schools (NCES district)
- District
- Fort Bend ISD
- NCES district ID
- 4819650
- Math proficiency
- 44% ▼ -15.00%
- Reading proficiency
- 53% ▼ -4.00%
- Median HH income
- $82,360
- Composite
- 44.61/100
- National rank
- #2779
- State rank
- #140 of 826 in TX
Livability — Houston
- Score
- 74/100
- State rank
- #184
- US rank
- #4771
Category grades
Schools grade is shown separately in the Schools card above.
Census & demographics
- Census place
- Houston, TX
- County
- Fort Bend County · 836,777 people
- City population
- 3,226,434
- Metro
- Houston-The Woodlands-Sugar Land, TX
- Population (ZIP)
- 39,292
- Household income
- $74,689
- Rent vs Own
- Severe rent burden
- 1121.0
Population outlook (Fort Bend County) Hauer SSP2
- Today (2025)
- 1,004,526 people
- By 2030
- 1,153,104 · +14.8%
- By 2040
- 1,453,718 · +44.7%
- By 2050
- 1,753,781 · +74.6%
- By 2075
- 2,455,772 · +144.5%
- By 2100
- 2,930,528 · +191.7%
Race, ethnicity, and origin ACS 2023
- Neighborhood character
- Majority Black (60%)
- Race & ethnicity
- Black 60% Hispanic / Latino 29% Two or more races 13% White 4% Asian 3%
- Hispanic origin (detail)
- Mexican 17%
- Foreign-born
- 16% · Canada, Vietnam
- Languages at home
- 73% English-only · Spanish 22% Vietnamese 1% Other Asian/Pacific 1%
Political lean MEDSL · Fort Bend
- 2024 margin
- Toss-up / Even · D 49.5% · R 47.9% · Other 2.6%
- 2008→2024 swing
- +4.0pp toward D · 2008: -2.4pp · 2024: 1.6pp
- All cycles
- 2024: D+1.6 2020: D+10.6 2016: D+6.6 2012: R+6.8 2008: R+2.4
Not yet ingested
- Civics
- —
Market trends
- HPI YoY
- ▼ -0.55%
- Current HPI
- 288.1306
- Rent YoY
- ▲ 0.34%
- Metro
- Houston-The Woodlands-Sugar Land, TX
- State GDP YoY
- ▲ 3.95%
- F500 in state
- 110
Industry mix (Fortune 500 HQ in TX)
| Industry | F500 HQs | Revenue |
|---|---|---|
| Energy | 16 | $1,198B |
|
||
| Technology | 5 | $198B |
|
||
| Engineering / Construction | 4 | $72B |
|
||
| Energy Services | 3 | $60B |
|
||
| Utilities | 3 | $41B |
|
||
| Healthcare | 2 | $330B |
|
||
Price history
-98.8% since first listed18 events — show timeline
- 2026-04-27 Relisted — HARMLS
- 2026-04-22 Pending — HARMLS
- 2026-03-30 Rental Removed $1,400 HARMLS
- 2026-03-30 Listed $102,500 HARMLS
- 2026-02-21 Pending — HARMLS
- 2026-02-20 Listing Removed — HARMLS
- 2026-02-11 Price Changed $107,500 HARMLS
- 2026-01-04 Listed for Rent $1,400 HARMLS
- 2025-12-30 Rental Removed $1,625 HARMLS
- 2025-12-13 Price Changed $110,000 HARMLS
- 2025-12-04 Listed for Rent $1,625 HARMLS
- 2025-11-15 Price Changed $113,500 HARMLS
- 2025-10-27 Listed $115,000 HARMLS
- 2025-07-21 Sold (Public Records) — Public Records
- 2015-05-15 Sold (Public Records) — Public Records
- 2014-01-09 Sold (Public Records) — Public Records
- 2013-11-22 Sold (Public Records) — Public Records
- 2012-09-19 Sold (Public Records) — Public Records
Property tax history
+6.4%/yrLatest (2025): $1,664 · +1.5% YoY. Source: county tax records.
Cash-flow waterfall
monthlySold comps — $/sqft
last 12 mo · ≤1 miLoading sold comps…