1821 Gale Dr · Pelican Bay, TX
Flood risk 1/10 · Minimal
- FEMA flood zone
- X (unshaded)
- Chance of flooding over 30 yrs
- 0.0%
- Est. flood insurance / yr
- $507 – $1,088
Fire risk 5/10 · Moderate
- Est. fire insurance / yr
- $1,222 – $2,270
Heat risk 7/10 · Major
- Hot days now (above 110°F)
- 7 days/yr
- Hot days in 30 yrs
- 22 days/yr
Wind risk 6/10 · Moderate
- Chance of severe wind over 30 yrs
- 27.0%
Air-quality risk 2/10 · Minimal
- Unhealthy air days now
- 2 days/yr
- Unhealthy air days in 30 yrs
- 2 days/yr
Risk factors via First Street. Map © Google.
Why this score? — see what drove the D grade
The composite is a weighted blend of 9 inputs, each scored 0–100. Each bar is that input's sub-score; the figure is the points it added to the 100-point composite (weight × sub-score).
- Cash flow +19.5/30.0
- DSCR +6.2/10.0
- 1% rule +4.1/10.0
- Schools +3.6/10.0
- Rent growth +3.1/5.0
- Livability +3.1/5.0
- Condition / age +2.5/5.0
- ARV discount +1.2/15.0
- Appreciation +0.0/10.0
$183,000
🖨 Deal sheet 📄 Offer letter ✓ Due diligence
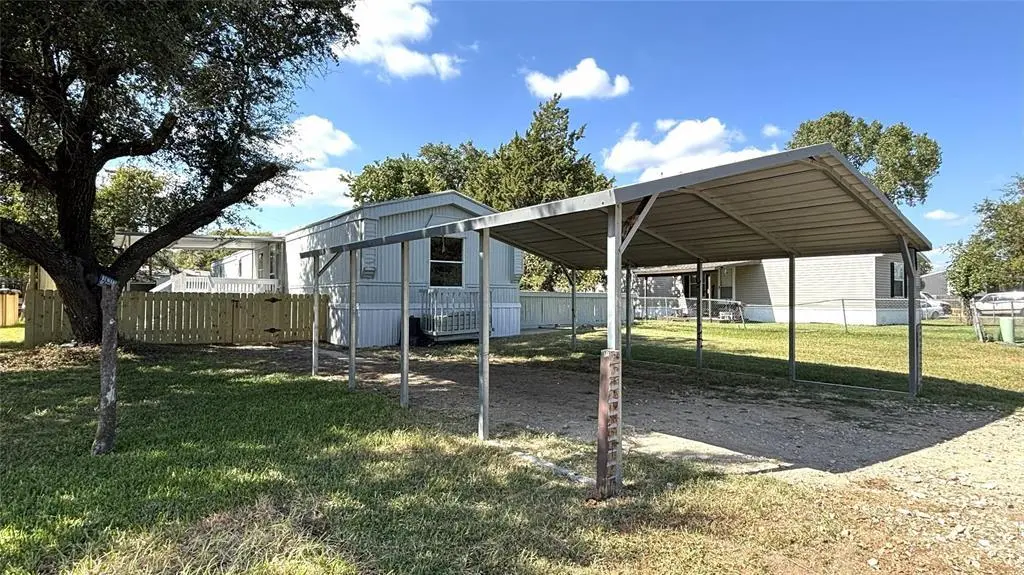
Listing remarks
NEW LOWER PRICE! COME SEE THIS RENOVATED MOBIL HOME. The mobile home has new subfloors, sheetrock and everything is new. Fully renovated 3-bedroom 2-bath single-wide home, perfectly nestled on a flat lot close to Eagle Mountain Lake. The interior boasts luxurious vinyl plank flooring throughout the home. The open concept layout seamlessly connects, living room and dining room with the kitchen. The kitchen cabinets are new, with beautiful black granite countertops. The cooktop blends into the countertop effortlessly. The bedrooms are split from each other. The main bedroom is at one end of the home & the other two bedrooms are on the other. Both bathrooms have new shower surrounds and
Key facts
- 6,839 sq ft lot
- 2 parking spots
- Built 2002
Neighborhood map
What this means for you Summary
Snapshot
- This is a 3-bed/2.0-bath manufactured listed at $183k.
Deal economics
- At list price, monthly cash flow is $207 ($2k/yr) — positive.
- The deal already cash-flows at list — no discount required.
- To meet the 1% rule (rent ≥ 1% of price), the offer needs to be $167k (8.8% below list).
- Recommended offer: $167k (8.8% below list) — sets the bar for 1% rule.
- Cap rate 7.7% vs local median 6.3% in Pelican Bay — meaningfully above typical; check what's discounted (condition, days-on-market, listing class) to confirm the premium yield is real.
Location & tenants
- Location reads 62/100 on livability (#917 in TX) — a middle-class / working-renter tenant base. Strengths: cost of living A+, housing A+, crime A; Watch: health & safety D+, amenities F, commute F.
- Azle ISD (suburban): math 37% / reading 43% proficiency, ranked #351 of 826 in TX (top 42%) — families likely to look elsewhere, expect single-tenant / working-renter base with shorter leases.
- Zoned schools: Liberty El (math 32% / reading 42%, grade F, #1,769 of 4,322 statewide, top 44%, 466 students, 64% FRL) — zoned schools average 64% FRL vs 45% district-wide (19 pts higher); higher-poverty schools than district average — tighter screening recommended.
- Market conditions: Rents rising (+2.3%/yr); 591 active listings in the ZIP; 10 comparable units currently listed for rent nearby; rentals at typical pace (median 22d on market — plan ~3-4 weeks tenant-placement turnaround); solid renter incomes; 18,938 units permitted in Tarrant County in 2024 (8,336 in 5+ unit buildings).
Forward outlook
- Local home prices are declining (-3.0%/yr); year-one equity from $1k of loan paydown is wiped out by about $5k of value loss. Plan a longer hold.
- Tarrant County population projected at +41% by 2050 — long-run rental-demand tailwind backs the buy-and-hold thesis.
Negotiation context
- Only 1 days on market — expect competitive offers; lowballing is unlikely to land.
- 4 sale attempts since 18y ago with the ask held roughly flat each time — persistent listings suggest the price (not the market) is what's stuck; bring a comps-based counter.
Risks & watch-outs
- Climate carrying-cost: major wind risk, 27% chance of damaging wind over 30y; moderate wildfire risk; extreme-heat days projected 7→22/yr by 2055 (HVAC capex compounding) — expect insurance premiums to compound above CPI over the hold.
Questions for the listing agent
- Is there a deadline driving the sale (1031 exchange, divorce, estate, relocation)? That informs how much negotiation room exists.
- Schools are F-rated, which usually means shorter tenancies and higher turnover. Who's the typical renter profile here, and what's been the actual vacancy rate?
- The area grade is low — what's the realistic commute time and amenity access for the typical tenant pool here? Any planned neighborhood developments (good or bad) we should know about?
- What's the average days-on-market for RENTAL listings here right now (not sales)? A rising rental-DOM trend means longer vacancies and softer asking-rent achievability than the comps imply.
- What's the recent tenant-quality profile in this submarket — average credit score on applications, eviction rate, late-payment / NSF rate, and stable-employment percentage? A property-management company in the area should have these aggregated.
- How much new for-sale + rental construction is in the pipeline within 1–3 miles? Heavy new supply typically softens prices + rents 12–24 months out; constrained supply supports both.
Investment metrics
- 1% rule
- 0.91% ✗
- Cap rate
- 7.65%
- Cash-on-cash
- 4.85%
- DSCR
- 1.22
- GRM
- 9.1
CMA / ARV
- ARV (on-the-fly)
- $160,512
- Comps found
- 12
Show comp detail 12 sales within ~0.75 mi
| Address | Dist | Beds/Ba | Sqft | Sold | Price | $/sf | Match |
|---|---|---|---|---|---|---|---|
| 1821 Gale Dr | 0.00mi | 3/2.0 | 1,216 (0%) | 1mo | $183,000 | $150 | 99 |
| 1405 Cardinal Ter | 0.48mi | 3/2.0 | 1,216 (0%) | 5mo | $125,000 | $103 | 73 |
| 1704 Coral Rd | 0.24mi | 3/2.0 | 1,178 (-3%) | 15mo | $180,950 | $154 | 71 |
| 1413 Dawn Dr N | 0.59mi | 3/2.0 | 1,216 (0%) | 3mo | $150,000 | $123 | 70 |
| 1521 Lark Ct | 0.65mi | 3/2.0 | 1,216 (0%) | 2mo | $185,000 | $152 | 68 |
| 1901 Gale Dr | 0.09mi | 3/2.0 | 1,344 (+10%) | 16mo | $105,000 | $78 | 65 |
| 1605 Sheri Ct | 0.67mi | 3/2.0 | 1,216 (0%) | 5mo | $185,000 | $152 | 64 |
| 1820 Coral Rd | 0.18mi | 3/2.0 | 1,368 (+12%) | 12mo | $179,900 | $132 | 61 |
| 1609 Mockingbird Ln | 0.61mi | 3/2.0 | 1,216 (0%) | 16mo | $150,000 | $123 | 58 |
| 1505 Mockingbird Ln | 0.64mi | 3/2.0 | 1,232 (+1%) | 14mo | $159,500 | $129 | 57 |
| 1609 Quail Run | 0.56mi | 3/2.0 | 1,152 (-5%) | 14mo | $174,900 | $152 | 53 |
| 1413 Whippoorwill Way | 0.67mi | 2/2.0 (-1) | 1,144 (-6%) | 7mo | $115,000 | $101 | 48 |
Match score weights: distance 35% · size 25% · config 20% · recency 20%. Top-matched comps best support the ARV.
Projected returns pro-forma
-3.0% appreciation · 2.31% rent growth · sell at horizon
- IRR
- -9.5%
- Equity multiple
- 0.66×
- Total profit
- $-17,670
- Equity at exit
- $27,286
- IRR
- -1.0%
- Equity multiple
- 0.94×
- Total profit
- $-3,323
- Equity at exit
- $15,822
Cash invested: $51,240 (down + closing). Projections, not guarantees.
Landlord ↔ Tenant lean methodology
- Overall (STATE)
- 87 Strongly Landlord-Friendly
- State Texas
- 87 Strongly Landlord-Friendly · R+5
- County
- — inherits STATE
- City
- — inherits STATE
ZIP-level market 76020
- Home prices YoY
- -20.6%
- Rents YoY
- 2.3%
- Active inventory
- 591
- Price-to-rent
- 9.1×
Monthly cashflow live
- Estimated rent
- $1,669 high interval (Pro) →
- Mortgage (P&I)
- −$960
- Tax from tax record
- −$75 /mo · $901/yr
- Insurance
- −$76
- HOA
- −$0
- Vacancy / Maint / Mgmt
- −$350
- Net cashflow
- $207
Break-even live
UW: 25.0% down · 7.5% · 30yr · 1.5% tax · 5.0% vac · 8.0% maint · 8.0% mgmt
Financing live
Cash to close
- Down payment
- $45,750
- Closing costs
- $5,490
- Reserves months
- —
- Total cash needed
- —
Loan-product check · same deal, 3 products live
Conventional
25% down · 7.5% · 30yr
- Down + closing
- —
- Monthly P&I
- —
- Monthly cashflow
- —
- DSCR
- —
- Eligible?
- —
Personal DTI + credit; lowest rate.
DSCR
20% down · 8.5% · 30yr
- Down + closing
- —
- Monthly P&I
- —
- Monthly cashflow
- —
- DSCR
- —
- Eligible?
- —
No personal income docs; deal must DSCR.
Hard money
10% down · 12.0% · 12mo
- Down + closing
- —
- Monthly P&I
- —
- Monthly cashflow
- —
- DSCR
- —
- Eligible?
- —
Short-term bridge; refi at stabilization.
Rent comps 10 comps
| Address | Beds | Baths | Sqft | Rent | $/sqft | DOM | Units | Dist |
|---|---|---|---|---|---|---|---|---|
| 1920 Reef Ct Azle, TX | 3.0 | 2.0 | 1090 | $1,449 | $1.33 | 43d | 1 | 0.19mi |
| 1844 Sheila Dr Azle, TX | 3.0 | 2.0 | 1319 | $1,675 | $1.27 | 6d | 1 | 0.26mi |
| 1408 Yachtclub Dr Azle, TX | 3.0 | 2.0 | 1302 | $2,000 | $1.54 | 12d | 1 | 0.55mi |
| 1324 White Sand Dr Azle, TX | 3.0 | 2.0 | 1149 | $1,650 | $1.44 | 5d | 1 | 0.59mi |
| 11124 Liberty School Rd Unit 24B Azle, TX | 2.0 | 2.0 | 700 | $999 | $1.43 | 22d | 1 | 0.60mi |
| 11128 Liberty School Rd Unit 28A Azle, TX | 2.0 | 2.0 | 700 | $1,050 | $1.50 | 24d | 1 | 0.61mi |
| 1300 White Sand Dr Unit 1304 Azle, TX | 3.0 | 2.0 | 1149 | $1,695 | $1.48 | 43d | 1 | 0.63mi |
| 1304 White Sand Dr Azle, TX | 3.0 | 2.0 | 1149 | $1,695 | $1.48 | 43d | 1 | 0.64mi |
| 1620 Mockingbird Ln Azle, TX | 3.0 | 2.0 | 1090 | $1,499 | $1.38 | 20d | 1 | 0.66mi |
| 1329 Fox Hollow Ct Azle, TX | 2.0 | 1.0 | 924 | $900 | $0.97 | 6d | 1 | 0.77mi |
Listing history 17 events
-
2026-04-24status Pending
-
2026-04-23$183,000 Active
-
2026-04-23historical
-
2026-03-26price $183,000
-
2026-03-08$195,500 Active
-
2026-02-28historical
-
2026-02-09price $197,500
-
2025-11-12price $209,900
-
2025-10-22$215,000 Active
-
2024-10-24soldstatus
-
2024-10-23soldstatus
-
2008-04-23soldstatus
-
2008-04-18soldstatus
-
2008-04-01historical
-
2008-03-30$29,900
-
2002-07-09soldstatus
-
1992-07-07soldstatus
ⓘ Source: listings_history table (triggers on properties + properties_extension) + one-shot
backfill from property_details.listing_events for pre-trigger history.
Tax reassessment forecast TX · Resets to sale price
- Current annual tax
- $901 · $75/mo
- Projected year-2 tax
- $3,349 · $279/mo
- Expected delta
- +$2,448/yr (+$204/mo · 271.5%)
ⓘ Screening estimate from a state-policy table — verify with the county assessor before closing.
Climate risk First Street
- Flood 1/10 Low FEMA zone X (unshaded) · 0% chance over 30 yrs
- Wildfire 5/10 Major
- Heat 7/10 Severe 7 d/yr ≥110°F today · 22 d/yr by 30 yrs out
- Wind 6/10 Major 27% chance of damaging wind over 30 yrs
- Air quality 2/10 Low 2 unhealthy d/yr today · 2 by 30 yrs out
Nearby sold comps map
Loading sold comps map…
Walkable amenities ~0.75 mi
Loading nearby amenities…
Taxation est. · year 1
- Rental income
- $20,025
- − Mortgage interest
- −$10,251
- − Property taxes
- −$901
- − Insurance
- −$915
- − Repairs & maintenance
- −$1,602
- − Management
- −$1,602
- − Depreciation
- −$5,324
- Taxable loss
- −$569
- Est. tax savings @ 24.0%
- +$137
- After-tax cash flow
- $2,624/yr
For passive investors: Depreciation is non-cash, so a rental often shows a tax loss while cash-flowing — sheltering income. Rental losses are passive: they offset passive income freely, and up to $25,000/yr can offset ordinary (W-2) income if you actively participate and your MAGI is under $100k (phasing out to $0 by $150k); unused losses carry forward. On sale, claimed depreciation is recaptured at up to 25%, and gains may owe capital-gains tax (a 1031 exchange can defer both). Figures are a year-1 estimate at your 24.0% rate — not tax advice; consult a CPA.
Schools (NCES district)
- District
- Azle ISD
- NCES district ID
- 4809200
- Math proficiency
- 37% ▼ -11.00%
- Reading proficiency
- 43% ▼ -5.00%
- Median HH income
- $61,473
- Composite
- 35.57/100
- National rank
- #4900
- State rank
- #351 of 826 in TX
Livability — Pelican Bay
- Score
- 62/100
- State rank
- #917
- US rank
- #16376
Category grades
Schools grade is shown separately in the Schools card above.
Census & demographics
- Census place
- Pelican Bay, TX
- County
- Parker County · 144,797 people
- Metro
- Dallas-Fort Worth-Arlington, TX
- Population (ZIP)
- 34,602
- Household income
- $87,298
- Rent vs Own
- Severe rent burden
- 433.0
Population outlook (Tarrant County) Hauer SSP2
- Today (2025)
- 2,380,417 people
- By 2030
- 2,578,900 · +8.3%
- By 2040
- 2,974,995 · +25.0%
- By 2050
- 3,350,489 · +40.8%
- By 2075
- 4,216,909 · +77.2%
- By 2100
- 4,741,527 · +99.2%
Race, ethnicity, and origin ACS 2023
- Neighborhood character
- Predominantly White (78%)
- Race & ethnicity
- White 78% Hispanic / Latino 18% Two or more races 9% Black 1%
- Hispanic origin (detail)
- Mexican 15%
- Common ancestry
- Slovak 2% Italian 1% Portuguese 1%
- Foreign-born
- 5% · Canada
- Languages at home
- 89% English-only · Spanish 11%
Political lean MEDSL · Tarrant
- 2024 margin
- Lean R (+5.1) · D 46.7% · R 51.9% · Other 1.4%
- 2008→2024 swing
- +6.6pp toward D · 2008: -11.7pp · 2024: -5.1pp
- All cycles
- 2024: R+5.1 2020: D+0.2 2016: R+8.7 2012: R+15.7 2008: R+11.7
Not yet ingested
- Civics
- —
Market trends
- HPI YoY
- ▼ -74.72%
- Current HPI
- 287.155
- Rent YoY
- ▲ 2.31%
- Metro
- Dallas-Fort Worth-Arlington, TX
- State GDP YoY
- ▲ 3.95%
- F500 in state
- 110
Industry mix (Fortune 500 HQ in TX)
| Industry | F500 HQs | Revenue |
|---|---|---|
| Energy | 16 | $1,198B |
|
||
| Technology | 5 | $198B |
|
||
| Engineering / Construction | 4 | $72B |
|
||
| Energy Services | 3 | $60B |
|
||
| Utilities | 3 | $41B |
|
||
| Healthcare | 2 | $330B |
|
||
Price history
+512.0% since first listed17 events — show timeline
- 2026-04-24 Pending — NTREIS
- 2026-04-23 Listing Removed — NTREIS
- 2026-04-23 Listed $183,000 NTREIS
- 2026-03-26 Price Changed $183,000 NTREIS
- 2026-03-08 Listed $195,500 NTREIS
- 2026-02-28 Listing Removed — NTREIS
- 2026-02-09 Price Changed $197,500 NTREIS
- 2025-11-12 Price Changed $209,900 NTREIS
- 2025-10-22 Listed $215,000 NTREIS
- 2024-10-24 Sold (Public Records) — Public Records
- 2024-10-23 Sold (Public Records) — Public Records
- 2008-04-23 Sold (Public Records) — Public Records
- 2008-04-18 Sold (MLS) — NTREIS
- 2008-04-01 Listing Removed — NTREIS
- 2008-03-30 Listed $29,900 NTREIS
- 2002-07-09 Sold (Public Records) — Public Records
- 1992-07-07 Sold (Public Records) — Public Records
Property tax history
+1.3%/yrLatest (2025): $901 · +1.3% YoY. Source: county tax records.
Cash-flow waterfall
monthlySold comps — $/sqft
last 12 mo · ≤1 miLoading sold comps…