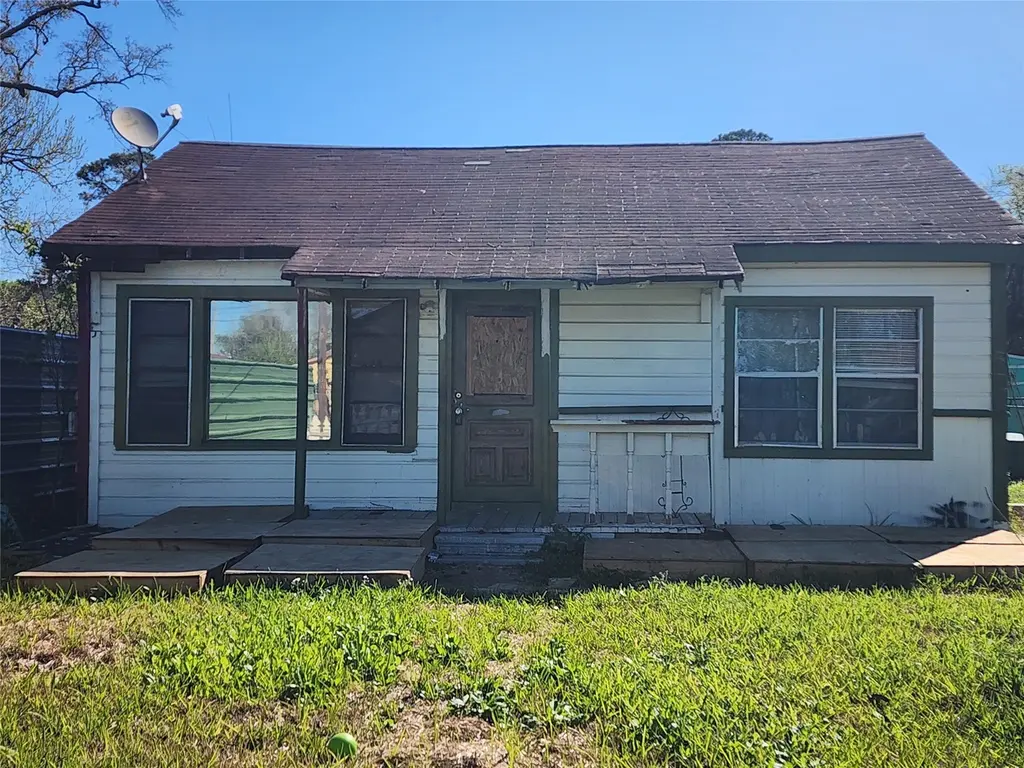
19530 Dunbar Ave · Houston, TX
Flood risk 4/10 · Minor
- FEMA flood zone
- X (unshaded)
- Chance of flooding over 30 yrs
- 0.22%
- Est. flood insurance / yr
- $507 – $1,088
Fire risk 2/10 · Minimal
- Est. fire insurance / yr
- $1,222 – $2,270
Heat risk 9/10 · Severe
- Hot days now (above 110°F)
- 7 days/yr
- Hot days in 30 yrs
- 24 days/yr
Wind risk 9/10 · Severe
- Chance of severe wind over 30 yrs
- 99.0%
Air-quality risk 3/10 · Minor
- Unhealthy air days now
- 3 days/yr
- Unhealthy air days in 30 yrs
- 3 days/yr
Risk factors via First Street. Map © Google.
Why this score? — see what drove the C grade
The composite is a weighted blend of 9 inputs, each scored 0–100. Each bar is that input's sub-score; the figure is the points it added to the 100-point composite (weight × sub-score).
- Cash flow +23.2/30.0
- ARV discount +7.5/15.0
- DSCR +7.4/10.0
- 1% rule +5.7/10.0
- Appreciation +4.6/10.0
- Livability +3.7/5.0
- Rent growth +3.0/5.0
- Condition / age +2.5/5.0
- Schools +1.5/10.0
$115,900
🖨 Deal sheet (PDF) 📄 Offer letter ✓ Due diligence
Listing remarks MLS
This property needs a lot of work and could be a tear down. Located between Business 1960 and Fm 1960 in Bordersville just outside of the city limits of Humble. Near IAH. There is still a lot of personal items inside this home. Great area to rebuild.
Key facts
- 8,498 sq ft lot
- Built 1940
- Listed 341 days
Neighborhood map
What this means for you Summary
Snapshot
- This is a 2-bed/1.0-bath single-family listed at $116k.
Deal economics
- At list price, monthly cash flow is $209 ($3k/yr) — positive.
- The deal already cash-flows at list — no discount required.
- Meets the 1% rule at list price ($1k rent vs $116k).
- Recommended offer: $102k (12.0% below list) — sets the bar for market timing.
- Cap rate 8.5% vs local median 3.2% in Houston — top-decile yield for the area; either an underpriced asset or a hidden risk that comps aren't pricing in. Stress-test before assuming the spread holds.
Location & tenants
- Location reads 74/100 on livability (#184 in TX, #4,771 nationally) — a middle-class / working-renter tenant base. Strengths: amenities A+, cost of living A+, housing A+; Watch: schools D, crime F.
- Aldine ISD (suburban): math 16% / reading 21% proficiency, ranked #790 of 826 in TX (top 96%) — low school quality limits family demand, transient renter base, plan for 1-2y turnover; 79% free/reduced lunch — lower-income household profile, screen leases tightly.
- Market conditions: Rents rising (+2.2%/yr); 311 active listings in the ZIP; 29 comparable units currently listed for rent nearby; rentals leasing fast (median 12d on market — plan ~1-2 weeks tenant-placement turnaround); 29,883 units permitted in Harris County in 2024 (8,621 in 5+ unit buildings).
Forward outlook
- Local home prices are declining (-0.8%/yr); year-one equity from $801 of loan paydown is wiped out by about $898 of value loss. Plan a longer hold.
- Harris County population projected at +47% by 2050 — long-run rental-demand tailwind backs the buy-and-hold thesis.
- At projected returns (-0.8% appreciation + 2.2% rent growth), your $32k cash investment doubles in ~9 years — after that, you're playing with house money.
Negotiation context
- It's been on market 342 days — a 12% lower offer ($102k) is reasonable based on typical stale-listing flexibility.
Risks & watch-outs
- Watch-outs: built in 1940 — expect roof / HVAC / electrical / plumbing capex.
- Climate carrying-cost: severe wind risk, 99% chance of damaging wind over 30y; extreme-heat days projected 7→24/yr by 2055 (HVAC capex compounding) — expect insurance premiums to compound above CPI over the hold.
Questions for the listing agent
- It's been on market 342 days. Have you received any prior offers? Is the seller open to a 12% concession, seller financing, or rate buy-down credit?
- Built in 1940 — when were the roof, HVAC, electrical panel, plumbing, and water heater last replaced?
- Why hasn't it sold? Are there any deal-killer items the seller is aware of (foundation, flood, title, zoning, code violations)?
- Is there a deadline driving the sale (1031 exchange, divorce, estate, relocation)? That informs how much negotiation room exists.
- Schools are D-rated, which usually means shorter tenancies and higher turnover. Who's the typical renter profile here, and what's been the actual vacancy rate?
- Crime grade is F in this area — have there been break-ins, vandalism, or insurance claims at this property in the last 3 years? What carrier currently insures it and at what premium?
- What's the average days-on-market for RENTAL listings here right now (not sales)? A rising rental-DOM trend means longer vacancies and softer asking-rent achievability than the comps imply.
- What's the recent tenant-quality profile in this submarket — average credit score on applications, eviction rate, late-payment / NSF rate, and stable-employment percentage? A property-management company in the area should have these aggregated.
- How much new for-sale + rental construction is in the pipeline within 1–3 miles? Heavy new supply typically softens prices + rents 12–24 months out; constrained supply supports both.
Investment metrics
- 1% rule
- 1.07% ✓
- Cap rate
- 8.46%
- Cash-on-cash
- 7.74%
- DSCR
- 1.34
- GRM
- 7.8
CMA / ARV
No comps found within radius.
Projected returns pro-forma
-0.77% appreciation · 2.17% rent growth · sell at horizon
- IRR
- 3.3%
- Equity multiple
- 1.15×
- Total profit
- $4,757
- Equity at exit
- $29,235
- IRR
- 8.8%
- Equity multiple
- 1.86×
- Total profit
- $27,828
- Equity at exit
- $31,783
Cash invested: $32,452 (down + closing). Projections, not guarantees.
Landlord ↔ Tenant lean methodology
- Overall (STATE)
- 87 Strongly Landlord-Friendly
- State Texas
- 87 Strongly Landlord-Friendly · R+5
- County
- — inherits STATE
- City
- — inherits STATE
ZIP-level market 77338
- Home prices YoY
- -0.3%
- Rents YoY
- 2.2%
- Active inventory
- 311
- Price-to-rent
- 7.8×
Monthly cashflow live
- Estimated rent
- $1,245 high interval (Pro) →
- Mortgage (P&I)
- −$608
- Tax from tax record
- −$118 /mo · $1,422/yr
- Insurance
- −$48
- HOA
- −$0
- Vacancy / Maint / Mgmt
- −$262
- Net cashflow
- $209
Break-even live
Sensitivity live
| Price | -10% $275 | -5% $242 | +0% $209 | +5% $176 | +10% $144 |
|---|---|---|---|---|---|
| Rent | -10% $111 | -5% $160 | +0% $209 | +5% $258 | +10% $308 |
| Rate | -1.0pp $268 | -0.5pp $239 | base $209 | +0.5pp $179 | +1.0pp $149 |
UW: 25.0% down · 7.5% · 30yr · 1.5% tax · 5.0% vac · 8.0% maint · 8.0% mgmt
Financing live
Cash to close
- Down payment
- $28,975
- Closing costs
- $3,477
- Reserves months
- —
- Total cash needed
- —
Loan-product check · same deal, 3 products live
Conventional
25% down · 7.5% · 30yr
- Down + closing
- —
- Monthly P&I
- —
- Monthly cashflow
- —
- DSCR
- —
- Eligible?
- —
Personal DTI + credit; lowest rate.
DSCR
20% down · 8.5% · 30yr
- Down + closing
- —
- Monthly P&I
- —
- Monthly cashflow
- —
- DSCR
- —
- Eligible?
- —
No personal income docs; deal must DSCR.
Hard money
10% down · 12.0% · 12mo
- Down + closing
- —
- Monthly P&I
- —
- Monthly cashflow
- —
- DSCR
- —
- Eligible?
- —
Short-term bridge; refi at stabilization.
Rent comps 29 comps
| Address | Beds | Baths | Sqft | Rent | $/sqft | DOM | Units | Dist |
|---|---|---|---|---|---|---|---|---|
| 19800 Kenswick Dr Unit 325 Humble, TX | 1.0 | 1.0 | 625 | $1,210 | $1.94 | 0d | 1 | 0.29mi |
| 19800 Kenswick Dr Unit 19842 Humble, TX | 1.0 | 1.0 | 525 | $955 | $1.82 | 11d | 1 | 0.29mi |
| 19800 Kenswick Dr Unit 19821 Humble, TX | 1.0 | 1.0 | 625 | $1,090 | $1.74 | 45d | 1 | 0.29mi |
| 19800 Kenswick Dr Unit 19851 Humble, TX | 1.0 | 1.0 | 625 | $1,095 | $1.75 | 14d | 1 | 0.29mi |
| 19800 Kenswick Dr Apt 321 Humble, TX | 1.0 | 1.0 | 625 | $1,221 | $1.95 | 8d | 1 | 0.29mi |
| 19800 Kenswick Dr Unit 112 Humble, TX | 1.0 | 1.0 | 525 | $925 | $1.76 | 0d | 1 | 0.29mi |
| 19800 Kenswick Dr Unit 1162 Humble, TX | 1.0 | 1.0 | 625 | $1,221 | $1.95 | 6d | 1 | 0.29mi |
| 19800 Kenswick Dr Unit 19874 Humble, TX | 1.0 | 1.0 | 625 | $1,100 | $1.76 | 14d | 1 | 0.29mi |
| 19800 Kenswick Dr Humble, TX | 1.0 | 1.0 | 625 | $1,065 | $1.70 | 16d | 1 | 0.30mi |
| 19800 Kenswick Dr Unit 147 Humble, TX | 1.0 | 1.0 | 525 | $956 | $1.82 | 0d | 1 | 0.33mi |
| 19815 Kenswick Dr Humble, TX | 1.0–2.0 | 1.0–2.0 | 935 | $1,756 | $1.88 | 0d | 62 | 0.35mi |
| 19815 Kenswick Dr Unit 19815 Humble, TX | 1.0 | 1.0 | 625 | $1,260 | $2.02 | 11d | 1 | 0.35mi |
| 9393 Farm to Market 1960 Bypass Rd W Humble, TX | 1.0–3.0 | 1.0–2.0 | 1033 | $1,530 | $1.48 | 0d | 28 | 0.52mi |
| 19700 Whitaker Dr Humble, TX | 1.0–2.0 | 1.0 | 751 | $1,629 | $2.17 | 6d | 1 | 1.13mi |
| 9814 Farm to Market 1960 Bypass Rd W Humble, TX | 1.0 | 1.0 | 607 | $960 | $1.58 | 14d | 1 | 1.22mi |
| 9814 Farm to Market 1960 Bypass Rd W Humble, TX | 1.0 | 1.0 | 550 | $899 | $1.63 | 0d | 1 | 1.22mi |
| 9814 Farm to Market 1960 Bypass Rd W Humble, TX | 1.0 | 1.0 | 607 | $955 | $1.57 | 45d | 1 | 1.22mi |
| 9814 Farm to Market 1960 Bypass Rd W Humble, TX | 1.0 | 1.0 | 607 | $922 | $1.52 | 18d | 1 | 1.22mi |
| 7160 Foxbrick Ln Humble, TX | 1.0–2.0 | 1.0–2.0 | 872 | $1,575 | $1.81 | 0d | 2 | 1.26mi |
| 7160 Foxbrick Ln Unit LANE14302 Humble, TX | 1.0 | 1.0 | 733 | $1,000 | $1.36 | 45d | 1 | 1.31mi |
| 7160 Foxbrick Ln Unit LANE18305 Humble, TX | 1.0 | 1.0 | 733 | $1,050 | $1.43 | 45d | 1 | 1.31mi |
| 7150 Foxbrick Ln Humble, TX | 1.0–2.0 | 1.0–2.0 | 872 | $1,625 | $1.86 | 45d | 4 | 1.33mi |
| 19920 Foxwood Forest Blvd Unit 1162 Humble, TX | 1.0 | 1.0 | 545 | $875 | $1.61 | 6d | 1 | 1.35mi |
| 19920 Foxwood Forest Blvd Unit 19971 Humble, TX | 1.0 | 1.0 | 545 | $934 | $1.71 | 45d | 1 | 1.35mi |
| 19920 Foxwood Forest Blvd Unit 19941 Humble, TX | 1.0 | 1.0 | 545 | $939 | $1.72 | 14d | 1 | 1.35mi |
| 19920 Foxwood Forest Blvd Unit 324 Humble, TX | 1.0 | 1.0 | 545 | $875 | $1.61 | 8d | 1 | 1.35mi |
| 19920 Foxwood Forest Blvd Unit 19941 Humble, TX | 1.0 | 1.0 | 545 | $864 | $1.59 | 0d | 1 | 1.35mi |
| 19920 Foxwood Forest Blvd Humble, TX | 1.0 | 1.0 | 545 | $864 | $1.59 | 14d | 1 | 1.40mi |
| 19926 Foxwood Forest Blvd Humble, TX | 1.0 | 1.0 | 545 | $955 | $1.75 | 45d | 1 | 1.41mi |
Listing history 19 events
-
2026-06-21days on market $115,900 Active 342 DOM
-
2026-06-18days on market $115,900 Active 339 DOM
-
2026-06-17days on market $115,900 Active 338 DOM
-
2026-06-16days on market $115,900 Active 337 DOM
-
2026-06-15days on market $115,900 Active 336 DOM
-
2026-06-13days on market $115,900 Active 334 DOM
-
2026-06-13days on market $115,900 Active 333 DOM
-
2026-06-09days on market $115,900 Active 330 DOM
-
2026-06-08days on market $115,900 Active 329 DOM
-
2026-06-07days on market $115,900 Active 328 DOM
-
2026-06-04days on market $115,900 Active 325 DOM
-
2026-06-03days on market $115,900 Active 324 DOM
-
2026-06-02days on market $115,900 Active 323 DOM
-
2026-06-01days on market $115,900 Active 322 DOM
-
2026-05-31days on market $115,900 Active 321 DOM
-
2026-05-04price $115,900 254-char remark
Show marketing remark (254 chars)
This property needs a lot of work and could be a tear down. Located between Business 1960 and Fm 1960 in Bordersville just outside of the city limits of Humble. Near IAH. There is still a lot of personal items inside this home. Great area to rebuild.
-
2026-04-15price $124,900 254-char remark
Show marketing remark (254 chars)
This property needs a lot of work and could be a tear down. Located between Business 1960 and Fm 1960 in Bordersville just outside of the city limits of Humble. Near IAH. There is still a lot of personal items inside this home. Great area to rebuild.
-
2025-07-11$125,000 Active 254-char remark
Show marketing remark (254 chars)
This property needs a lot of work and could be a tear down. Located between Business 1960 and Fm 1960 in Bordersville just outside of the city limits of Humble. Near IAH. There is still a lot of personal items inside this home. Great area to rebuild.
-
1988-01-02soldstatus
ⓘ Source: listings_history table (triggers on properties + properties_extension) + one-shot
backfill from property_details.listing_events for pre-trigger history.
Tax reassessment forecast TX · Resets to sale price
- Current annual tax
- $1,422 · $118/mo
- Projected year-2 tax
- $2,121 · $177/mo
- Expected delta
- +$699/yr (+$58/mo · 49.2%)
ⓘ Screening estimate from a state-policy table — verify with the county assessor before closing.
Climate risk First Street
- Flood 4/10 Moderate FEMA zone X (unshaded) · 22% chance over 30 yrs
- Wildfire 2/10 Low
- Heat 9/10 Extreme 7 d/yr ≥110°F today · 24 d/yr by 30 yrs out
- Wind 9/10 Extreme 99% chance of damaging wind over 30 yrs
- Air quality 3/10 Moderate 3 unhealthy d/yr today · 3 by 30 yrs out
Nearby sold comps map
Loading sold comps map…
Walkable amenities ~0.75 mi
Loading nearby amenities…
Taxation est. · year 1
- Rental income
- $14,945
- − Mortgage interest
- −$6,492
- − Property taxes
- −$1,422
- − Insurance
- −$580
- − Repairs & maintenance
- −$1,196
- − Management
- −$1,196
- − Depreciation
- −$3,372
- Taxable income
- $689
- Est. tax owed @ 24.0%
- −$165
- After-tax cash flow
- $2,346/yr
For passive investors: Depreciation is non-cash, so a rental often shows a tax loss while cash-flowing — sheltering income. Rental losses are passive: they offset passive income freely, and up to $25,000/yr can offset ordinary (W-2) income if you actively participate and your MAGI is under $100k (phasing out to $0 by $150k); unused losses carry forward. On sale, claimed depreciation is recaptured at up to 25%, and gains may owe capital-gains tax (a 1031 exchange can defer both). Figures are a year-1 estimate at your 24.0% rate — not tax advice; consult a CPA.
Schools (NCES district)
- District
- Aldine ISD
- NCES district ID
- 4807710
- Math proficiency
- 16% ▼ -23.00%
- Reading proficiency
- 21% ▼ -11.00%
- Median HH income
- $37,081
- Composite
- 15.42/100
- National rank
- #9317
- State rank
- #790 of 826 in TX
Livability — Houston
- Score
- 74/100
- State rank
- #184
- US rank
- #4771
Category grades
Schools grade is shown separately in the Schools card above.
Census & demographics
- Census place
- Houston, TX
- County
- Harris County · 4,702,590 people
- City population
- 3,226,434
- Metro
- Houston-The Woodlands-Sugar Land, TX
- Population (ZIP)
- 48,031
- Household income
- $64,755
- Rent vs Own
- Severe rent burden
- 2620.0
Population outlook (Harris County) Hauer SSP2
- Today (2025)
- 5,571,493 people
- By 2030
- 6,089,821 · +9.3%
- By 2040
- 7,142,806 · +28.2%
- By 2050
- 8,185,864 · +46.9%
- By 2075
- 10,574,329 · +89.8%
- By 2100
- 12,109,958 · +117.4%
Race, ethnicity, and origin ACS 2023
- Neighborhood character
- Diverse neighborhood (Simpson 0.69)
- Race & ethnicity
- Hispanic / Latino 41% Black 34% Two or more races 18% White 16% Asian 3%
- Hispanic origin (detail)
- Mexican 29% Puerto Rican 1%
- Common ancestry
- Lithuanian 4% Armenian 1% Serbian 1%
- Foreign-born
- 17% · Canada, Jamaica
- Languages at home
- 60% English-only · Spanish 35% Arabic 1% Other Indo-European 1%
Political lean MEDSL · Harris
- 2024 margin
- Lean D (+5.5) · D 52.0% · R 46.4% · Other 1.6%
- 2008→2024 swing
- +3.9pp toward D · 2008: 1.6pp · 2024: 5.5pp
- All cycles
- 2024: D+5.5 2020: D+13.3 2016: D+12.4 2012: D+0.1 2008: D+1.6
Not yet ingested
- Civics
- —
Market trends
- HPI YoY
- ▼ -0.77%
- Current HPI
- 245.7087
- Rent YoY
- ▲ 2.17%
- Metro
- Houston-The Woodlands-Sugar Land, TX
- State GDP YoY
- ▲ 3.95%
- F500 in state
- 110
Industry mix (Fortune 500 HQ in TX)
| Industry | F500 HQs | Revenue |
|---|---|---|
| Energy | 16 | $1,198B |
|
||
| Technology | 5 | $198B |
|
||
| Engineering / Construction | 4 | $72B |
|
||
| Energy Services | 3 | $60B |
|
||
| Utilities | 3 | $41B |
|
||
| Healthcare | 2 | $330B |
|
||
Price history
-7.3% since first listed4 events — show timeline
- 2026-05-04 Price Changed $115,900 HARMLS
- 2026-04-15 Price Changed $124,900 HARMLS
- 2025-07-11 Listed $125,000 HARMLS
- 1988-01-02 Sold (Public Records) — Public Records
Property tax history
+7.0%/yrLatest (2025): $1,422 · +21.0% YoY. Source: county tax records.
Cash-flow waterfall
monthlySold comps — $/sqft
last 12 mo · ≤1 miLoading sold comps…