 Duplex
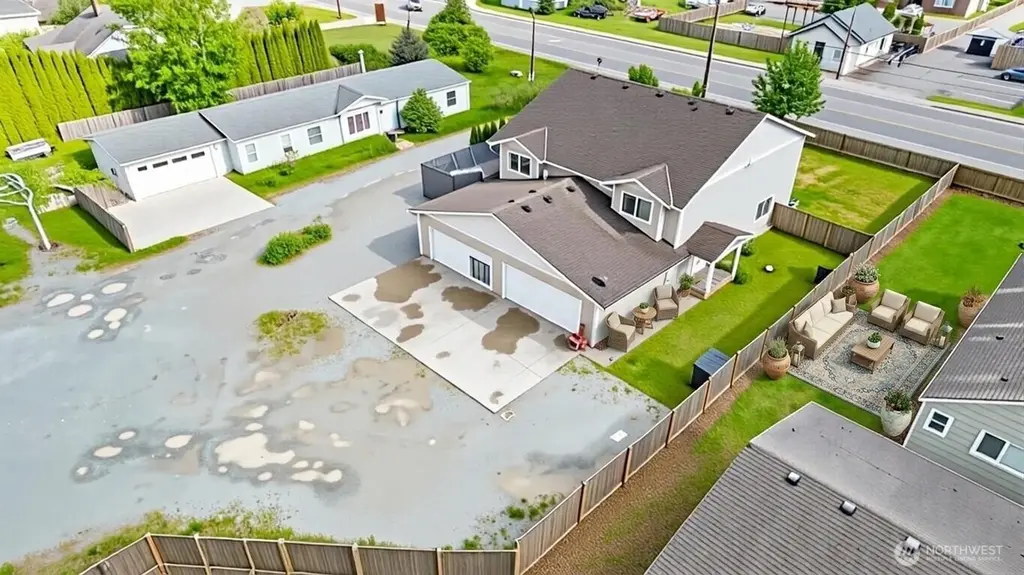
838 Cook Rd · Sedro-Woolley, WA
Flood risk No data
- FEMA flood zone
- —
- Chance of flooding over 30 yrs
- —
- Est. flood insurance / yr
- —
Fire risk No data
- Est. fire insurance / yr
- —
Heat risk No data
- Hot days now (above threshold)
- —
- Hot days in 30 yrs
- —
Wind risk No data
- Chance of severe wind over 30 yrs
- —
Air-quality risk No data
- Unhealthy air days now
- —
- Unhealthy air days in 30 yrs
- —
Risk factors via First Street. Map © Google.
Why this score? — see what drove the D grade
The composite is a weighted blend of 9 inputs, each scored 0–100. Each bar is that input's sub-score; the figure is the points it added to the 100-point composite (weight × sub-score).
- Appreciation +10.0/10.0
- Cash flow +7.8/30.0
- ARV discount +7.5/15.0
- Schools +4.7/10.0
- Rent growth +2.5/5.0
- Livability +2.5/5.0
- Condition / age +2.5/5.0
- DSCR +1.9/10.0
- 1% rule +1.7/10.0
$689,900
🖨 Deal sheet (PDF) 📄 Offer letter ✓ Due diligence
Multi-family units
County records classify this as Multi-Family (2-4 Unit). Listing-text estimate: 2 units. confirmed
Listing remarks
This spacious duplex at 838 Cook Rd in Sedro-Woolley is a great investment opportunity, with each unit offering 3 bedrooms, 2.5 baths, and a 2-car garage. Each side features a functional layout with comfortable living space, a spacious primary suite, and a design that works well for both tenants and owner-occupants. The property also includes private outdoor space and a desirable residential setting close to downtown Sedro-Woolley, schools, shopping, and commuter routes. With strong rental appeal and versatile living options, this duplex is ideal for those looking to expand their portfolio or live in one unit while generating income from the other
Key facts
- Close to downtown
- Strong rental appeal
- 0.34 acre lot
Tags
Property features AI
Finance
- Other: Two units in the building; No units below grade; Calculated building area 3,400 square feet; Lot approximately 0.34 acres (dimensions 96x134x36x69x160)
- Financial info: Gross scheduled income $45,600 annually; Gross adjusted income $45,600; Total monthly income $3,800; Net operating income $31,416; Total expenses $14,184; Insurance expense $1,152; Gross rent multiplier 15; Acceptable financing: Cash, Conventional, FHA, VA
Exterior
- Parking: Four uncovered parking spaces; Four covered parking spaces; Four garage spaces
- Security: Fully fenced property
- Utilities: Public water (PUD); Sewer connected (City of Sedro-Woolley); Power by PSE; Cable and internet by Comcast
- Home design: Duplex (residential income, multi-family); Average condition; Two stories; Has a view
- Construction: Wood construction; Composition roof; Poured concrete foundation; Built as a duplex structure
- Exterior features: Wood exterior; Paved lot with sidewalk; High-speed internet available; Fenced fully
Interior
- Kitchen: Each unit includes range/oven, refrigerator and dishwasher
- Bedrooms: Two 3-bedroom units (one in each unit)
- Flooring: Laminate; Carpet
- Bathrooms: Two 3-bathroom units (one in each unit)
- Heating & cooling: Forced air heating; No central cooling
- Interior features: Laminate and carpet flooring; Fireplaces in each unit; Fully fenced
- Laundry & utility: Electric and natural gas available
Neighborhood map
What this means for you Summary
Snapshot
- This is a 2 × 3.0-bed/2.5-bath units multifamily listed at $690k.
Deal economics
- At list price, monthly cash flow is $-778 ($-9k/yr) — negative. Per door: $-389/mo.
- To cash-flow at today's rent, offer at most $553k (19.9% below list).
- To meet the 1% rule (rent ≥ 1% of price), the offer needs to be $464k (32.7% below list).
- Recommended offer: $464k (32.7% below list) — sets the bar for 1% rule.
- Cap rate 4.9% vs local median 2.4% in Sedro-Woolley — top-decile yield for the area; either an underpriced asset or a hidden risk that comps aren't pricing in. Stress-test before assuming the spread holds.
Location & tenants
- Location reads: area grade D — affects rentability + tenant quality, not the cash-flow math above.
- Sedro-Woolley School District (suburban): math 47% / reading 58% proficiency, ranked #117 of 291 in WA (top 40%) — acceptable for families but not a draw, mixed tenant base, ~2y average lease.
- Zoned schools: Central Elementary School (464 students, 61% FRL); Cascade Middle School (697 students, 58% FRL); Sedro Woolley Senior High School (1,276 students, 49% FRL).
- Market conditions: 232 active listings in the ZIP; solid renter incomes; 561 units permitted in Skagit County in 2024 (270 in 5+ unit buildings).
- At $4,644/mo this rent would consume 60% of the median local household income ($93k/yr) (locally 502% of renters already pay >50% of income on rent) — very limited rent-growth headroom before tenants either downsize or default.
Forward outlook
- In year one you build about $74k of equity ($5k loan paydown + $69k appreciation (10.0% local appreciation)).
- Skagit County population projected at +11% by 2050 — modest demand growth; plan on rents tracking national, not racing it.
- By year 2, paydown + projected appreciation supports a ~$119k cash-out refi (75% LTV) — recoverable capital for the next deal without selling this one.
Negotiation context
- Only 9 days on market — expect competitive offers; lowballing is unlikely to land.
- 2 sale attempts since 9y ago with the ask held roughly flat each time — persistent listings suggest the price (not the market) is what's stuck; bring a comps-based counter.
- Current owner paid $379k; list at $690k implies a 82% gain — meaningful room to come down on a strong offer.
Questions for the listing agent
- What do current leases actually rent for vs. the listed asking? Can we see a recent rent roll and the last 12 months of T-12 income?
- Can we see the unit-by-unit rent roll, current vacancy, and any below-market leases? What's the average tenancy length?
- What capital expenditures (roof, boiler, parking lot, exteriors) have been made in the last 5 years, and what's planned in the next 2?
- Is there a deadline driving the sale (1031 exchange, divorce, estate, relocation)? That informs how much negotiation room exists.
- The area grade is low — what's the realistic commute time and amenity access for the typical tenant pool here? Any planned neighborhood developments (good or bad) we should know about?
- What's the average days-on-market for RENTAL listings here right now (not sales)? A rising rental-DOM trend means longer vacancies and softer asking-rent achievability than the comps imply.
- What's the recent tenant-quality profile in this submarket — average credit score on applications, eviction rate, late-payment / NSF rate, and stable-employment percentage? A property-management company in the area should have these aggregated.
- How much new apartment / multifamily construction is in the pipeline within 1–3 miles? Heavy new supply (>2% of stock underway) typically softens rents 12–24 months out; light construction supports rent growth.
Investment metrics
- 1% rule
- 0.67% ✗
- Cap rate
- 4.94%
- Cash-on-cash
- -4.83%
- DSCR
- 0.79
- GRM
- 12.4
CMA / ARV
No comps found within radius.
Projected returns pro-forma
10.0% appreciation · 3.0% rent growth · sell at horizon
- IRR
- 20.8%
- Equity multiple
- 2.69×
- Total profit
- $326,086
- Equity at exit
- $621,517
- IRR
- 18.9%
- Equity multiple
- 6.17×
- Total profit
- $998,961
- Equity at exit
- $1,340,324
Cash invested: $193,172 (down + closing). Projections, not guarantees.
Landlord ↔ Tenant lean methodology
- Overall (STATE)
- 28 Tenant-Leaning
- State Washington
- 28 Tenant-Leaning · D+8
- County
- — inherits STATE
- City
- — inherits STATE
ZIP-level market 98284
- Home prices YoY
- 3.5%
- Active inventory
- 232
- Price-to-rent
- 24.8×
Monthly cashflow live
- Estimated rent
- $4,644 medium interval (Pro) →
- Mortgage (P&I)
- −$3,618
- Tax from tax record
- −$541 /mo · $6,492/yr
- Insurance
- −$287
- HOA
- −$0
- Vacancy / Maint / Mgmt
- −$975
- Net cashflow
- $-778
Break-even live
Sensitivity live
| Price | -10% $-387 | -5% $-582 | +0% $-778 | +5% $-973 | +10% $-1,168 |
|---|---|---|---|---|---|
| Rent | -10% $-1,144 | -5% $-961 | +0% $-778 | +5% $-594 | +10% $-411 |
| Rate | -1.0pp $-430 | -0.5pp $-602 | base $-778 | +0.5pp $-956 | +1.0pp $-1,138 |
2-unit breakdown (identical units grouped — click to expand)
| Units | Beds | Baths | Est. rent |
|---|---|---|---|
| 2× units | 3.0 | 2.5 | $4,644 |
| #1 | 3.0 | 2.5 | $2,322 |
| #2 | 3.0 | 2.5 | $2,322 |
| Total (2 units) | $4,644 | ||
UW: 25.0% down · 7.5% · 30yr · 1.5% tax · 5.0% vac · 8.0% maint · 8.0% mgmt
Financing live
Cash to close
- Down payment
- $172,475
- Closing costs
- $20,697
- Reserves months
- —
- Total cash needed
- —
Loan-product check · same deal, 3 products live
Conventional
25% down · 7.5% · 30yr
- Down + closing
- —
- Monthly P&I
- —
- Monthly cashflow
- —
- DSCR
- —
- Eligible?
- —
Personal DTI + credit; lowest rate.
DSCR
20% down · 8.5% · 30yr
- Down + closing
- —
- Monthly P&I
- —
- Monthly cashflow
- —
- DSCR
- —
- Eligible?
- —
No personal income docs; deal must DSCR.
Hard money
10% down · 12.0% · 12mo
- Down + closing
- —
- Monthly P&I
- —
- Monthly cashflow
- —
- DSCR
- —
- Eligible?
- —
Short-term bridge; refi at stabilization.
Listing history 7 events
-
2026-05-19$689,900 Active
-
2017-06-28soldstatus $379,000 Sold
-
2017-06-28soldstatus $375,500
-
2017-05-26status Pending
-
2017-05-21status Pending Inspection
-
2017-05-19$375,000 Active
-
2005-08-26soldstatus $327,000
ⓘ Source: listings_history table (triggers on properties + properties_extension) + one-shot
backfill from property_details.listing_events for pre-trigger history.
Tax reassessment forecast WA · Resets to sale price
- Current annual tax
- $6,492 · $541/mo
- Projected year-2 tax
- $6,761 · $563/mo
- Expected delta
- +$269/yr (+$22/mo · 4.1%)
ⓘ Screening estimate from a state-policy table — verify with the county assessor before closing.
Nearby sold comps map
Loading sold comps map…
Walkable amenities ~0.75 mi
Loading nearby amenities…
Taxation est. · year 1
- Rental income
- $55,728
- − Mortgage interest
- −$38,645
- − Property taxes
- −$6,492
- − Insurance
- −$3,450
- − Repairs & maintenance
- −$4,458
- − Management
- −$4,458
- − Depreciation
- −$20,070
- Taxable loss
- −$21,845
- Est. tax savings @ 24.0%
- +$5,243
- After-tax cash flow
- $-4,088/yr
For passive investors: Depreciation is non-cash, so a rental often shows a tax loss while cash-flowing — sheltering income. Rental losses are passive: they offset passive income freely, and up to $25,000/yr can offset ordinary (W-2) income if you actively participate and your MAGI is under $100k (phasing out to $0 by $150k); unused losses carry forward. On sale, claimed depreciation is recaptured at up to 25%, and gains may owe capital-gains tax (a 1031 exchange can defer both). Figures are a year-1 estimate at your 24.0% rate — not tax advice; consult a CPA.
Schools (NCES district)
- District
- Sedro-Woolley School District
- NCES district ID
- 5307740
- Math proficiency
- 47% ▼ -2.00%
- Reading proficiency
- 58% ▬ 0.00%
- Median HH income
- $57,385
- Composite
- 47.45/100
- National rank
- #5005
- State rank
- #117 of 291 in WA
Livability — Sedro-Woolley
No livability data for this city. (Only ~50 U.S. cities are tracked.)
Census & demographics
- Census place
- Sedro-Woolley, WA
- County
- Skagit County · 118,108 people
- Metro
- Mount Vernon-Anacortes, WA
- Population (ZIP)
- 27,835
- Household income
- $93,006
- Rent vs Own
- Severe rent burden
- 502.0
Population outlook (Skagit County) Hauer SSP2
- Today (2025)
- 131,498 people
- By 2030
- 135,556 · +3.1%
- By 2040
- 141,717 · +7.8%
- By 2050
- 145,714 · +10.8%
- By 2075
- 152,201 · +15.7%
- By 2100
- 147,980 · +12.5%
Race, ethnicity, and origin ACS 2023
- Neighborhood character
- Predominantly White (76%)
- Race & ethnicity
- White 76% Hispanic / Latino 14% Two or more races 8% Asian 2% Native American 1%
- Hispanic origin (detail)
- Mexican 12% Puerto Rican 1%
- Common ancestry
- Portuguese 6% Slovak 4% Italian 3%
- Foreign-born
- 5% · Canada, China
- Languages at home
- 88% English-only · Spanish 10% German/W. Germanic 1%
Political lean MEDSL · Skagit
- 2024 margin
- Lean D (+8.9) · D 52.9% · R 44.0% · Other 3.0%
- 2008→2024 swing
- -0.7pp no change · 2008: 9.6pp · 2024: 8.9pp
- All cycles
- 2024: D+8.9 2020: D+7.5 2016: D+3.2 2012: D+5.8 2008: D+9.6
Not yet ingested
- Civics
- —
Market trends
- HPI YoY
- ▲ 43.42%
- Current HPI
- 1280.83
- Rent YoY
- —
- Metro
- Mount Vernon-Anacortes, WA
- State GDP YoY
- ▲ 4.65%
- F500 in state
- 22
Industry mix (Fortune 500 HQ in WA)
| Industry | F500 HQs | Revenue |
|---|---|---|
| Retail | 2 | $269B |
|
||
| Technology / Retail | 1 | $638B |
|
||
| Technology | 1 | $245B |
|
||
| Telecommunications | 1 | $38B |
|
||
| Food / Beverage | 1 | $36B |
|
||
| Automotive / Trucks | 1 | $34B |
|
||
Price history
+111.0% since first listed7 events — show timeline
- 2026-05-19 Listed $689,900 NWMLS as Distributed by MLS Grid
- 2017-06-28 Sold (Public Records) $375,500 Public Records
- 2017-06-28 Sold (MLS) $379,000 NWMLS as Distributed by MLS Grid
- 2017-05-26 Pending — NWMLS as Distributed by MLS Grid
- 2017-05-21 Pending — NWMLS as Distributed by MLS Grid
- 2017-05-19 Listed $375,000 NWMLS as Distributed by MLS Grid
- 2005-08-26 Sold (Public Records) $327,000 Public Records
Property tax history
+3.7%/yrLatest (2026): $6,492 · +7.5% YoY. Source: county tax records.
Cash-flow waterfall
monthlySold comps — $/sqft
last 12 mo · ≤1 miLoading sold comps…