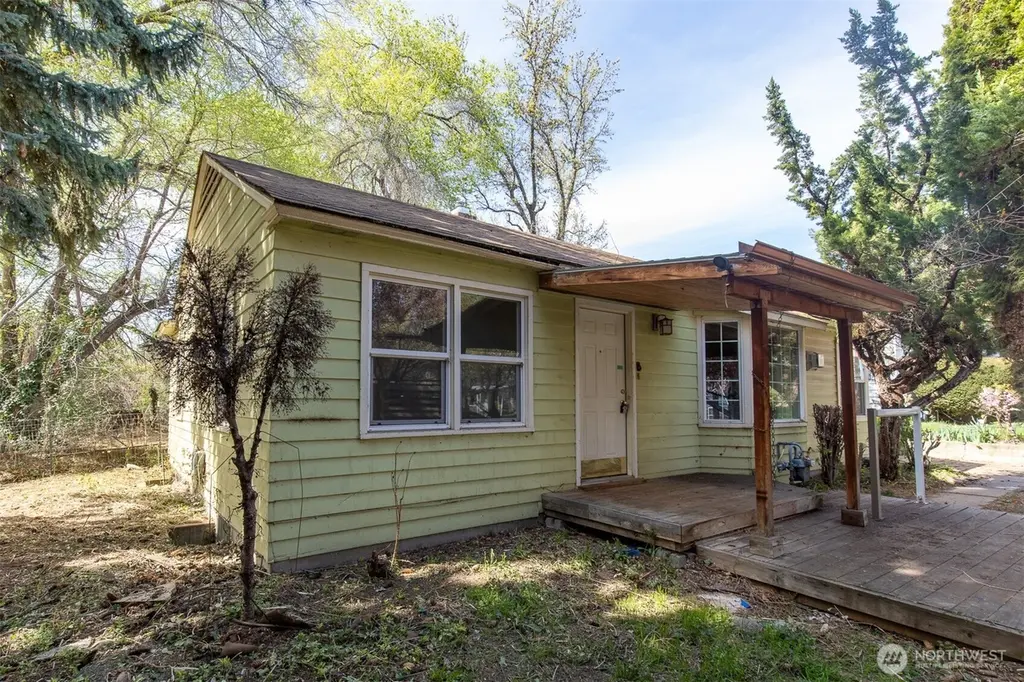
910 S 25th Ave · Yakima, WA
Flood risk 1/10 · Minimal
- FEMA flood zone
- X (unshaded)
- Chance of flooding over 30 yrs
- 0.0%
- Est. flood insurance / yr
- $473 – $860
Fire risk 7/10 · Major
- Est. fire insurance / yr
- $604 – $1,122
Heat risk 4/10 · Minor
- Hot days now (above 97°F)
- 7 days/yr
- Hot days in 30 yrs
- 13 days/yr
Wind risk 1/10 · Minimal
- Chance of severe wind over 30 yrs
- —
Air-quality risk 9/10 · Severe
- Unhealthy air days now
- 16 days/yr
- Unhealthy air days in 30 yrs
- 19 days/yr
Risk factors via First Street. Map © Google.
Why this score? — see what drove the C- grade
The composite is a weighted blend of 9 inputs, each scored 0–100. Each bar is that input's sub-score; the figure is the points it added to the 100-point composite (weight × sub-score).
- ARV discount +15.0/15.0
- Cash flow +14.6/30.0
- DSCR +4.5/10.0
- 1% rule +4.0/10.0
- Livability +4.0/5.0
- Rent growth +3.8/5.0
- Schools +3.4/10.0
- Condition / age +2.5/5.0
- Appreciation +0.0/10.0
$202,500
🖨 Deal sheet (PDF) 📄 Offer letter ✓ Due diligence
Listing remarks
Great location and huge potential. The quarter acre lot has plenty of room for gardens or fun. Nice hardwood floors throughout the main floor. Gridded picture window in the living and dining rooms. Bedrooms are usable, with hardwood floors, good light and nice closets. Kitchen needs work but is located off the dining room and the sink looks over the backyard. Door out kitchen leads to carport and backyard. The basement if partially finished with a rec room, a bedroom wihtout legal egress, a 3/4 bathroom and utility/work area. Some wires have been removed as well as piping. This home is a great opportunity. If property was built prior to 1978, Lead Based Paint Potentially Exists.
Key facts
- Quarter acre lot
- Rec room
- Utility work area
Tags
Property features AI
Finance
- Financial info: Listing terms: Cash or rehab loan
Exterior
- Parking: Attached carport with one covered space and one additional uncovered space
- Utilities: Public water; Sewer connected; Natural gas energy source; Electric water heater; Power provided by Pacific Power
- Home design: Single-family residence, one story with basement; Built on lot; Faces east
- Construction: Wood construction; Composition roof; Poured concrete foundation; Property listed as fixer condition
- Exterior features: Wood exterior products
Interior
- Kitchen: Stove/range included
- Bedrooms: Four bedrooms total — three on the main level, one on the lower level
- Flooring: Ceramic tile; Hardwood
- Bathrooms: One full bathroom; One three-quarter bathroom; One bathtub; Two showers
- Heating & cooling: Forced air heating; Forced air cooling with heat pump
- Interior features: Fireplace (wood-burning); Water heater
- Laundry & utility: Water heater located in the basement
Neighborhood map
What this means for you Summary
Snapshot
- This is a 3-bed/2.0-bath single-family listed at $202k.
Deal economics
- At list price, monthly cash flow is $49 ($586/yr) — positive.
- The deal already cash-flows at list — no discount required.
- To meet the 1% rule (rent ≥ 1% of price), the offer needs to be $182k (9.9% below list).
- Recommended offer: $182k (9.9% below list) — sets the bar for 1% rule.
- Cap rate 6.6% vs local median 3.3% in Yakima — top-decile yield for the area; either an underpriced asset or a hidden risk that comps aren't pricing in. Stress-test before assuming the spread holds.
Location & tenants
- Location reads 80/100 on livability (#98 in WA, #1,912 nationally) — a professional / high-income tenant draw. Strengths: amenities A+, commute A+, housing A+; Watch: employment D, crime F.
- Yakima School District (urban): math 34% / reading 42% proficiency, ranked #238 of 291 in WA (top 82%) — families likely to look elsewhere, expect single-tenant / working-renter base with shorter leases; 76% free/reduced lunch — lower-income household profile, screen leases tightly.
- Zoned schools: Nob Hill Elementary School (412 students, 68% FRL); Franklin Middle School (895 students, 82% FRL); Davis High School (2,330 students, 83% FRL) — zoned schools at 77% FRL track the district average.
- Market conditions: Rents rising fast (+5.1%/yr); 186 active listings in the ZIP; 6 comparable units currently listed for rent nearby; rentals at typical pace (median 23d on market — plan ~3-4 weeks tenant-placement turnaround); 468 units permitted in Yakima County in 2024 (23 in 5+ unit buildings).
- This rent runs 35% of the median local income ($63k/yr) — at the standard rent-burdened threshold; future hikes will face affordability resistance.
Forward outlook
- Local home prices are declining (-3.0%/yr); year-one equity from $1k of loan paydown is wiped out by about $6k of value loss. Plan a longer hold.
- Yakima County population projected at +6% by 2050 — modest demand growth; plan on rents tracking national, not racing it.
Negotiation context
- Only 11 days on market — expect competitive offers; lowballing is unlikely to land.
Risks & watch-outs
- Watch-outs: built in 1945 — expect roof / HVAC / electrical / plumbing capex.
- Climate carrying-cost: major wildfire risk — expect insurance premiums to compound above CPI over the hold.
Questions for the listing agent
- Built in 1945 — when were the roof, HVAC, electrical panel, plumbing, and water heater last replaced?
- Is there a deadline driving the sale (1031 exchange, divorce, estate, relocation)? That informs how much negotiation room exists.
- Crime grade is F in this area — have there been break-ins, vandalism, or insurance claims at this property in the last 3 years? What carrier currently insures it and at what premium?
- What's the average days-on-market for RENTAL listings here right now (not sales)? A rising rental-DOM trend means longer vacancies and softer asking-rent achievability than the comps imply.
- What's the recent tenant-quality profile in this submarket — average credit score on applications, eviction rate, late-payment / NSF rate, and stable-employment percentage? A property-management company in the area should have these aggregated.
- How much new for-sale + rental construction is in the pipeline within 1–3 miles? Heavy new supply typically softens prices + rents 12–24 months out; constrained supply supports both.
Investment metrics
- 1% rule
- 0.90% ✗
- Cap rate
- 6.58%
- Cash-on-cash
- 1.03%
- DSCR
- 1.05
- GRM
- 9.3
CMA / ARV
- ARV (median comp)
- $331,520
- List price
- $202,500
- Delta
- -38.92%
- Verdict
- UNDERPRICED
- Comps
- 20 within 1.0 mi
Show comp detail 12 sales within ~0.75 mi
| Address | Dist | Beds/Ba | Sqft | Sold | Price | $/sf | Match |
|---|---|---|---|---|---|---|---|
| 806 S 25th Ave | 0.07mi | 3/2.0 | 1,774 (-5%) | 1mo | $320,000 | $180 | 87 |
| 919 S 28th Ave | 0.16mi | 3/2.0 | 1,984 (+6%) | 2mo | $334,000 | $168 | 80 |
| 713 S 24th Ave | 0.15mi | 3/2.0 | 2,051 (+10%) | 1mo | $383,500 | $187 | 76 |
| 3209 Tieton Dr | 0.58mi | 3/2.5 | 1,866 (-0%) | 4mo | $382,500 | $205 | 67 |
| 610 S 25th Ave | 0.26mi | 3/2.0 | 2,150 (+15%) | 1mo | $439,000 | $204 | 62 |
| 2312 W Yakima Ave | 0.60mi | 4/2.0 (+1) | 2,000 (+7%) | 3mo | $280,000 | $140 | 53 |
| 1116 S 31st Ave | 0.50mi | 4/2.0 (+1) | 1,680 (-10%) | 3mo | $379,000 | $226 | 52 |
| 1115 S 33rd Ave | 0.57mi | 3/2.0 | 1,669 (-11%) | 4mo | $365,000 | $219 | 52 |
| 608 S 19th Ave | 0.45mi | 3/1.0 | 2,128 (+14%) | 2mo | $260,000 | $122 | 50 |
| 2202 W Logan Ave | 0.62mi | 4/2.0 (+1) | 2,016 (+8%) | 3mo | $405,000 | $201 | 50 |
| 1205 S 21st Ave | 0.47mi | 3/1.5 | 1,597 (-15%) | 3mo | $352,000 | $220 | 50 |
| 1208 S 28th Ave | 0.47mi | 4/2.0 (+1) | 2,148 (+15%) | 0mo | $380,000 | $177 | 48 |
Match score weights: distance 35% · size 25% · config 20% · recency 20%. Top-matched comps best support the ARV.
Projected returns pro-forma
-3.0% appreciation · 5.07% rent growth · sell at horizon
- IRR
- -12.4%
- Equity multiple
- 0.54×
- Total profit
- $-25,805
- Equity at exit
- $30,193
- IRR
- -0.4%
- Equity multiple
- 0.97×
- Total profit
- $-1,779
- Equity at exit
- $17,508
Cash invested: $56,700 (down + closing). Projections, not guarantees.
Landlord ↔ Tenant lean methodology
- Overall (STATE)
- 28 Tenant-Leaning
- State Washington
- 28 Tenant-Leaning · D+8
- County
- — inherits STATE
- City
- — inherits STATE
ZIP-level market 98902
- Rents YoY
- 5.1%
- Active inventory
- 186
- Price-to-rent
- 9.3×
Monthly cashflow live
- Estimated rent
- $1,824 high interval (Pro) →
- Mortgage (P&I)
- −$1,062
- Tax from tax record
- −$245 /mo · $2,946/yr
- Insurance
- −$84
- HOA
- −$0
- Vacancy / Maint / Mgmt
- −$383
- Net cashflow
- $49
Break-even live
Sensitivity live
| Price | -10% $163 | -5% $106 | +0% $49 | +5% $-8 | +10% $-66 |
|---|---|---|---|---|---|
| Rent | -10% $-95 | -5% $-23 | +0% $49 | +5% $121 | +10% $193 |
| Rate | -1.0pp $151 | -0.5pp $100 | base $49 | +0.5pp $-4 | +1.0pp $-57 |
UW: 25.0% down · 7.5% · 30yr · 1.5% tax · 5.0% vac · 8.0% maint · 8.0% mgmt
Financing live
Cash to close
- Down payment
- $50,625
- Closing costs
- $6,075
- Reserves months
- —
- Total cash needed
- —
Loan-product check · same deal, 3 products live
Conventional
25% down · 7.5% · 30yr
- Down + closing
- —
- Monthly P&I
- —
- Monthly cashflow
- —
- DSCR
- —
- Eligible?
- —
Personal DTI + credit; lowest rate.
DSCR
20% down · 8.5% · 30yr
- Down + closing
- —
- Monthly P&I
- —
- Monthly cashflow
- —
- DSCR
- —
- Eligible?
- —
No personal income docs; deal must DSCR.
Hard money
10% down · 12.0% · 12mo
- Down + closing
- —
- Monthly P&I
- —
- Monthly cashflow
- —
- DSCR
- —
- Eligible?
- —
Short-term bridge; refi at stabilization.
Rent comps 6 comps
| Address | Beds | Baths | Sqft | Rent | $/sqft | DOM | Units | Dist |
|---|---|---|---|---|---|---|---|---|
| 1518 S 24th Ave Yakima, WA | 4.0 | 2.5 | 2250 | $2,000 | $0.89 | 22d | 1 | 0.76mi |
| 1900 W Mead Ave #1 Yakima, WA | 3.0 | 2.0 | 1350 | $2,050 | $1.52 | 22d | 1 | 0.79mi |
| 2600 Racquet Ln #4 Yakima, WA | 3.0 | 2.5 | 1422 | $2,200 | $1.55 | 45d | 1 | 0.98mi |
| 910 S 42nd Ave Yakima, WA | 3.0 | 2.0 | 1372 | $1,750 | $1.28 | 15d | 1 | 1.09mi |
| 511 N 22nd Ave Yakima, WA | 4.0 | 2.5 | 2396 | $2,150 | $0.90 | 45d | 1 | 1.26mi |
| 1106 Spokane St Yakima, WA | 3.0 | 1.0 | 1400 | $1,795 | $1.28 | 22d | 1 | 1.43mi |
Listing history 2 events
-
2026-05-15status Pending
-
2026-05-03$202,500 Active
ⓘ Source: listings_history table (triggers on properties + properties_extension) + one-shot
backfill from property_details.listing_events for pre-trigger history.
Tax reassessment forecast WA · Resets to sale price
- Current annual tax
- $2,946 · $245/mo
- Projected year-2 tax
- $2,946 · $245/mo
- Expected delta
- $0/yr ($0/mo · 0.0%)
ⓘ Screening estimate from a state-policy table — verify with the county assessor before closing.
Climate risk First Street
- Flood 1/10 Low FEMA zone X (unshaded) · 0% chance over 30 yrs
- Wildfire 7/10 Severe
- Heat 4/10 Moderate 7 d/yr ≥97°F today · 13 d/yr by 30 yrs out
- Wind 1/10 Low
- Air quality 9/10 Extreme 16 unhealthy d/yr today · 19 by 30 yrs out
Nearby sold comps map
Loading sold comps map…
Walkable amenities ~0.75 mi
Loading nearby amenities…
Taxation est. · year 1
- Rental income
- $21,882
- − Mortgage interest
- −$11,343
- − Property taxes
- −$2,946
- − Insurance
- −$1,012
- − Repairs & maintenance
- −$1,751
- − Management
- −$1,751
- − Depreciation
- −$5,891
- Taxable loss
- −$2,811
- Est. tax savings @ 24.0%
- +$675
- After-tax cash flow
- $1,260/yr
For passive investors: Depreciation is non-cash, so a rental often shows a tax loss while cash-flowing — sheltering income. Rental losses are passive: they offset passive income freely, and up to $25,000/yr can offset ordinary (W-2) income if you actively participate and your MAGI is under $100k (phasing out to $0 by $150k); unused losses carry forward. On sale, claimed depreciation is recaptured at up to 25%, and gains may owe capital-gains tax (a 1031 exchange can defer both). Figures are a year-1 estimate at your 24.0% rate — not tax advice; consult a CPA.
Schools (NCES district)
- District
- Yakima School District
- NCES district ID
- 5310110
- Math proficiency
- 34% ▼ -1.00%
- Reading proficiency
- 42% ▬ 0.00%
- Median HH income
- $36,538
- Composite
- 34.04/100
- National rank
- #10305
- State rank
- #238 of 291 in WA
Livability — Yakima
- Score
- 80/100
- State rank
- #98
- US rank
- #1912
Category grades
Schools grade is shown separately in the Schools card above.
Census & demographics
- Census place
- Yakima, WA
- County
- Yakima County · 134,789 people
- City population
- 115,918
- Metro
- Yakima, WA
- Population (ZIP)
- 46,492
- Household income
- $63,092
- Rent vs Own
- Severe rent burden
- 1607.0
Population outlook (Yakima County) Hauer SSP2
- Today (2025)
- 256,514 people
- By 2030
- 259,403 · +1.1%
- By 2040
- 265,677 · +3.6%
- By 2050
- 273,061 · +6.5%
- By 2075
- 296,991 · +15.8%
- By 2100
- 315,291 · +22.9%
Race, ethnicity, and origin ACS 2023
- Neighborhood character
- Diverse neighborhood (Simpson 0.59)
- Race & ethnicity
- Hispanic / Latino 50% White 40% Two or more races 24% Black 2% Pacific Islander 2% Native American 1% Asian 1%
- Hispanic origin (detail)
- Mexican 44%
- Common ancestry
- Lithuanian 2% Slovak 1% Italian 1%
- Foreign-born
- 20% · Canada
- Languages at home
- 60% English-only · Spanish 37% Other Asian/Pacific 1%
Political lean MEDSL · Yakima
- 2024 margin
- R (+14.3) · D 41.6% · R 55.9% · Other 2.5%
- 2008→2024 swing
- -3.8pp toward R · 2008: -10.6pp · 2024: -14.3pp
- All cycles
- 2024: R+14.3 2020: R+7.7 2016: R+15.4 2012: R+15.1 2008: R+10.6
Not yet ingested
- Civics
- —
Market trends
- HPI YoY
- ▼ -363.66%
- Current HPI
- 294.559
- Rent YoY
- ▲ 5.07%
- Metro
- Yakima, WA
- State GDP YoY
- ▲ 4.65%
- F500 in state
- 22
Industry mix (Fortune 500 HQ in WA)
| Industry | F500 HQs | Revenue |
|---|---|---|
| Retail | 2 | $269B |
|
||
| Technology / Retail | 1 | $638B |
|
||
| Technology | 1 | $245B |
|
||
| Telecommunications | 1 | $38B |
|
||
| Food / Beverage | 1 | $36B |
|
||
| Automotive / Trucks | 1 | $34B |
|
||
Price history
2 events — show timeline
- 2026-05-15 Pending — NWMLS as Distributed by MLS Grid
- 2026-05-03 Listed $202,500 NWMLS as Distributed by MLS Grid
Property tax history
+5.1%/yrLatest (2026): $2,946 · +4.5% YoY. Source: county tax records.
Cash-flow waterfall
monthlySold comps — $/sqft
last 12 mo · ≤1 miLoading sold comps…