 Fourplex
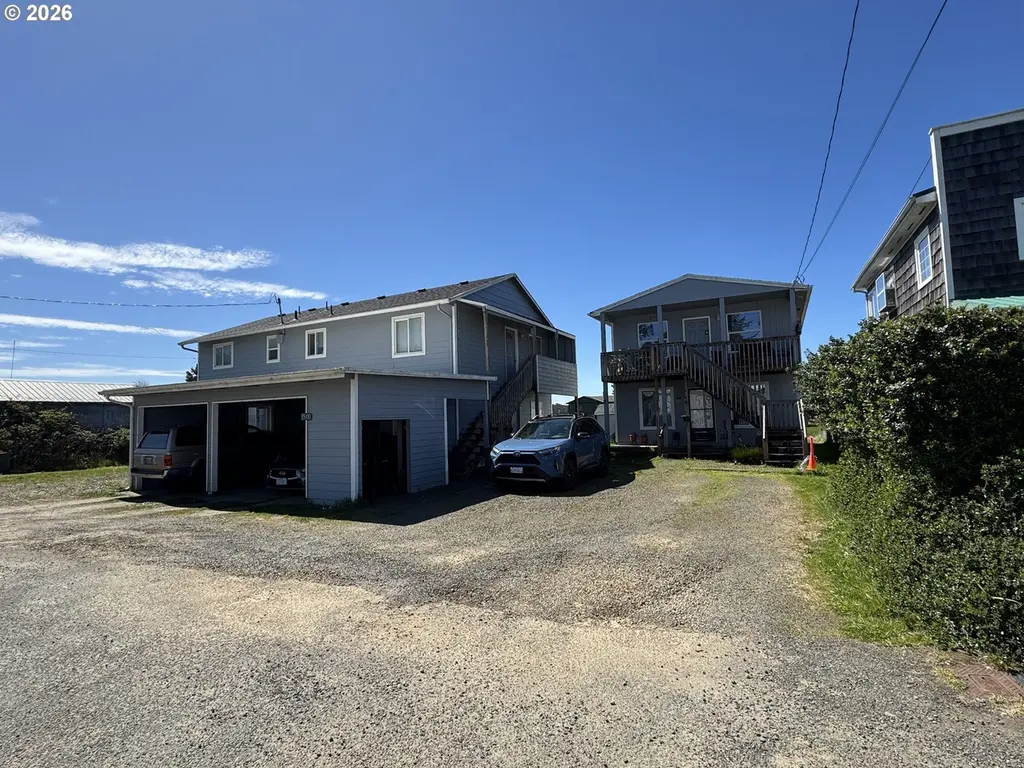
35390 Brooten Rd · Pacific City, OR
Flood risk 9/10 · Severe
- FEMA flood zone
- AE
- Chance of flooding over 30 yrs
- 0.99%
- Est. flood insurance / yr
- $1,737 – $8,500
Fire risk 1/10 · Minimal
- Est. fire insurance / yr
- $498 – $926
Heat risk 1/10 · Minimal
- Hot days now (above 77°F)
- 8 days/yr
- Hot days in 30 yrs
- 18 days/yr
Wind risk 1/10 · Minimal
- Chance of severe wind over 30 yrs
- —
Air-quality risk 7/10 · Major
- Unhealthy air days now
- 11 days/yr
- Unhealthy air days in 30 yrs
- 11 days/yr
Risk factors via First Street. Map © Google.
Why this score? — see what drove the B- grade
The composite is a weighted blend of 9 inputs, each scored 0–100. Each bar is that input's sub-score; the figure is the points it added to the 100-point composite (weight × sub-score).
- Cash flow +26.0/30.0
- DSCR +8.7/10.0
- ARV discount +7.5/15.0
- 1% rule +6.9/10.0
- Appreciation +5.4/10.0
- Condition / age +4.0/5.0
- Schools +3.7/10.0
- Livability +3.4/5.0
- Rent growth +2.5/5.0
$700,000
🖨 Deal sheet 📄 Offer letter ✓ Due diligence
Multi-family units
County records classify this as Multi-Family (2-4 Unit). Listing-text estimate: 4 units. confirmed
Listing remarks MLS
Well-maintained 4-unit multifamily property with coastal views, boat launch and beach access nearby! Two buildings featuring (2) 3BD/1BA units (1,056 sq ft) and (2) 2BD/1BA units (836 sq ft), totaling 3,784 sq ft. All units updated with new kitchens, bathrooms, and W/D hookups. Includes 2 carport spaces, 6 total parking, and 2 storage sheds. Fully tenant-occupied with excellent payment history—3 month-to-month, 1 lease. Strong investment opportunity!
Key facts
- Water views
- W d hookups
- Updated bathrooms
Tags
Neighborhood map
What this means for you Summary
Snapshot
- This is a 4 × 2-bed/1.0-bath units multifamily listed at $700k. Condition is rated good.
Deal economics
- At list price, monthly cash flow is $1k ($16k/yr) — positive. Per door: $328/mo.
- The deal already cash-flows at list — no discount required.
- Meets the 1% rule at list price ($8k rent vs $700k).
- Recommended offer: $658k (6.0% below list) — sets the bar for market timing.
- Cap rate 9.3% vs local median 1.9% in Pacific City — top-decile yield for the area; either an underpriced asset or a hidden risk that comps aren't pricing in. Stress-test before assuming the spread holds.
Location & tenants
- Location reads 67/100 on livability (#173 in OR) — a middle-class / working-renter tenant base. Strengths: crime A+, employment B, housing B; Watch: commute D+, health & safety D+, schools F.
- Nestucca Valley SD 101J (rural): math 33% / reading 50% proficiency, ranked #101 of 183 in OR (top 55%) — families likely to look elsewhere, expect single-tenant / working-renter base with shorter leases.
- Market conditions: 113 active listings in the ZIP; 86 units permitted in Tillamook County in 2024 (0 in 5+ unit buildings).
Forward outlook
- In year one you build about $10k of equity ($5k loan paydown + $5k appreciation (0.7% local appreciation)).
- Tillamook County population projected at +3% by 2050 — modest demand growth; plan on rents tracking national, not racing it.
- At projected returns (0.7% appreciation + 3.0% rent growth), your $196k cash investment doubles in ~7 years — after that, you're playing with house money.
- By year 5, paydown + projected appreciation supports a ~$48k cash-out refi (75% LTV) — recoverable capital for the next deal without selling this one.
Negotiation context
- It's been on market 71 days — a 6% lower offer ($658k) is reasonable based on typical stale-listing flexibility.
Risks & watch-outs
- Watch-outs: flood insurance adds $427/mo.
- Climate carrying-cost: in FEMA flood zone AE (mandatory federal flood insurance) — expect insurance premiums to compound above CPI over the hold.
Questions for the listing agent
- It's been on market 71 days. Have you received any prior offers? Is the seller open to a 6% concession, seller financing, or rate buy-down credit?
- Can we see the unit-by-unit rent roll, current vacancy, and any below-market leases? What's the average tenancy length?
- What capital expenditures (roof, boiler, parking lot, exteriors) have been made in the last 5 years, and what's planned in the next 2?
- What's the actual annual flood-insurance premium (NFIP or private), and is the property in a SFHA with mandatory coverage?
- Why hasn't it sold? Are there any deal-killer items the seller is aware of (foundation, flood, title, zoning, code violations)?
- Is there a deadline driving the sale (1031 exchange, divorce, estate, relocation)? That informs how much negotiation room exists.
- Schools are F-rated, which usually means shorter tenancies and higher turnover. Who's the typical renter profile here, and what's been the actual vacancy rate?
- What's the average days-on-market for RENTAL listings here right now (not sales)? A rising rental-DOM trend means longer vacancies and softer asking-rent achievability than the comps imply.
- What's the recent tenant-quality profile in this submarket — average credit score on applications, eviction rate, late-payment / NSF rate, and stable-employment percentage? A property-management company in the area should have these aggregated.
- How much new apartment / multifamily construction is in the pipeline within 1–3 miles? Heavy new supply (>2% of stock underway) typically softens rents 12–24 months out; light construction supports rent growth.
Investment metrics
- 1% rule
- 1.19% ✓
- Cap rate
- 9.28%
- Cash-on-cash
- 10.65%
- DSCR
- 1.47
- GRM
- 7.0
CMA / ARV
No comps found within radius.
Projected returns pro-forma
0.73% appreciation · 3.0% rent growth · sell at horizon
- IRR
- 9.0%
- Equity multiple
- 1.45×
- Total profit
- $87,909
- Equity at exit
- $229,155
- IRR
- 13.2%
- Equity multiple
- 2.56×
- Total profit
- $306,066
- Equity at exit
- $297,078
Cash invested: $196,000 (down + closing). Projections, not guarantees.
Landlord ↔ Tenant lean methodology
- Overall (STATE)
- 28 Tenant-Leaning
- State Oregon
- 28 Tenant-Leaning · D+6
- County
- — inherits STATE
- City
- — inherits STATE
ZIP-level market 97135
- Home prices YoY
- 0.4%
- Active inventory
- 113
- Price-to-rent
- 28.0×
Monthly cashflow live
- Estimated rent
- $8,326 medium interval (Pro) →
- Mortgage (P&I)
- −$3,671
- Tax est. 1.5%
- −$875 /mo · $10,500/yr
- Insurance
- −$292
- Flood insurance flood zone
- −$427 /mo · $5,118/yr
- HOA
- −$0
- Vacancy / Maint / Mgmt
- −$1,748
- Net cashflow
- $1,313
Break-even live
4-unit breakdown (identical units grouped — click to expand)
| Units | Beds | Baths | Est. rent |
|---|---|---|---|
| 4× units | 2 | 1 | $8,328 |
| #1 | 2 | 1 | $2,082 |
| #2 | 2 | 1 | $2,082 |
| #3 | 2 | 1 | $2,082 |
| #4 | 2 | 1 | $2,082 |
| Total (4 units) | $8,326 | ||
UW: 25.0% down · 7.5% · 30yr · 1.5% tax · 5.0% vac · 8.0% maint · 8.0% mgmt
Financing live
Cash to close
- Down payment
- $175,000
- Closing costs
- $21,000
- Reserves months
- —
- Total cash needed
- —
Loan-product check · same deal, 3 products live
Conventional
25% down · 7.5% · 30yr
- Down + closing
- —
- Monthly P&I
- —
- Monthly cashflow
- —
- DSCR
- —
- Eligible?
- —
Personal DTI + credit; lowest rate.
DSCR
20% down · 8.5% · 30yr
- Down + closing
- —
- Monthly P&I
- —
- Monthly cashflow
- —
- DSCR
- —
- Eligible?
- —
No personal income docs; deal must DSCR.
Hard money
10% down · 12.0% · 12mo
- Down + closing
- —
- Monthly P&I
- —
- Monthly cashflow
- —
- DSCR
- —
- Eligible?
- —
Short-term bridge; refi at stabilization.
Listing history 15 events
-
2026-06-18days on market $700,000 Active 71 DOM
-
2026-06-17days on market $700,000 Active 70 DOM
-
2026-06-16days on market $700,000 Active 69 DOM
-
2026-06-15days on market $700,000 Active 68 DOM
-
2026-06-13days on market $700,000 Active 66 DOM
-
2026-06-12days on market $700,000 Active 65 DOM
-
2026-06-09days on market $700,000 Active 62 DOM
-
2026-06-08days on market $700,000 Active 61 DOM
-
2026-06-08days on market $700,000 Active 60 DOM
-
2026-06-07days on market $700,000 Active 59 DOM
-
2026-06-04days on market $700,000 Active 56 DOM
-
2026-06-02days on market $700,000 Active 55 DOM
-
2026-06-01days on market $700,000 Active 54 DOM
-
2026-05-31days on market $700,000 Active 53 DOM
-
2026-04-08$700,000 Active 460-char remark
Show marketing remark (460 chars)
Well-maintained 4-unit multifamily property with coastal views, boat launch and beach access nearby! Two buildings featuring (2) 3BD/1BA units (1,056 sq ft) and (2) 2BD/1BA units (836 sq ft), totaling 3,784 sq ft. All units updated with new kitchens, bathrooms, and W/D hookups. Includes 2 carport spaces, 6 total parking, and 2 storage sheds. Fully tenant-occupied with excellent payment history—3 month-to-month, 1 lease. Strong investment opportunity!
ⓘ Source: listings_history table (triggers on properties + properties_extension) + one-shot
backfill from property_details.listing_events for pre-trigger history.
Climate risk First Street
- Flood 9/10 Extreme FEMA zone AE · 99% chance over 30 yrs
- Wildfire 1/10 Low
- Heat 1/10 Low 8 d/yr ≥77°F today · 18 d/yr by 30 yrs out
- Wind 1/10 Low
- Air quality 7/10 Severe 11 unhealthy d/yr today · 11 by 30 yrs out
Nearby sold comps map
Loading sold comps map…
Walkable amenities ~0.75 mi
Loading nearby amenities…
Taxation est. · year 1
- Rental income
- $99,912
- − Mortgage interest
- −$39,211
- − Property taxes
- −$10,500
- − Insurance
- −$8,618
- − Repairs & maintenance
- −$7,993
- − Management
- −$7,993
- − Depreciation
- −$20,364
- Taxable income
- $5,233
- Est. tax owed @ 24.0%
- −$1,256
- After-tax cash flow
- $14,506/yr
For passive investors: Depreciation is non-cash, so a rental often shows a tax loss while cash-flowing — sheltering income. Rental losses are passive: they offset passive income freely, and up to $25,000/yr can offset ordinary (W-2) income if you actively participate and your MAGI is under $100k (phasing out to $0 by $150k); unused losses carry forward. On sale, claimed depreciation is recaptured at up to 25%, and gains may owe capital-gains tax (a 1031 exchange can defer both). Figures are a year-1 estimate at your 24.0% rate — not tax advice; consult a CPA.
Condition & rehab AI · 13 photos
This 4-unit multifamily property is well-maintained and updated, with good condition and minimal repairs needed. The home is move-in ready and has strong investment potential.
Repairs flagged
- Minor Kitchen countertops — Visible wear on countertops, but not severe enough to require immediate replacement.
- Minor Bathroom fixtures — Visible wear on some fixtures, but not severe enough to require immediate replacement.
- Minor Exterior trim — Visible wear on trim, but not severe enough to require immediate replacement.
- Minor Exterior siding — Visible wear on siding, but not severe enough to require immediate replacement.
- Minor Exterior paint — Visible wear on paint, but not severe enough to require immediate replacement.
- Minor Exterior plants — Visible wear on some plants, but not severe enough to require immediate replacement.
Value-add opportunities
- Resale Paint exterior trim and siding — Fresh paint will enhance curb appeal and increase the home's resale value.
- Resale Replace worn kitchen countertops — Fresh countertops will improve the kitchen's appearance and functionality, increasing the home's resale value.
- Resale Replace worn bathroom fixtures — Fresh fixtures will improve the bathroom's appearance and functionality, increasing the home's resale value.
- Resale Replace worn exterior trim — Fresh trim will enhance curb appeal and increase the home's resale value.
- Resale Replace worn exterior siding — Fresh siding will enhance curb appeal and increase the home's resale value.
- Resale Replace worn exterior paint — Fresh paint will enhance curb appeal and increase the home's resale value.
- Resale Replace worn exterior plants — Fresh plants will enhance curb appeal and increase the home's resale value.
Renovation cost estimate screening
| Repair item | Severity | Est. cost |
|---|---|---|
| Kitchen countertops · Visible wear on countertops, but not severe enough to require immediate replacement. | Minor | $500–3,000 |
| Bathroom fixtures · Visible wear on some fixtures, but not severe enough to require immediate replacement. | Minor | $500–3,000 |
| Exterior trim · Visible wear on trim, but not severe enough to require immediate replacement. | Minor | $500–3,000 |
| Exterior siding · Visible wear on siding, but not severe enough to require immediate replacement. | Minor | $500–3,000 |
| Exterior paint · Visible wear on paint, but not severe enough to require immediate replacement. | Minor | $500–3,000 |
| Exterior plants · Visible wear on some plants, but not severe enough to require immediate replacement. | Minor | $500–3,000 |
| Total estimated repair cost · 6 items | $3,000–18,000 |
Value-add ROI direction
- Resale Paint exterior trim and siding — Fresh paint will enhance curb appeal and increase the home's resale value. ↑
- Resale Replace worn kitchen countertops — Fresh countertops will improve the kitchen's appearance and functionality, increasing the home's resale value. ↑
- Resale Replace worn bathroom fixtures — Fresh fixtures will improve the bathroom's appearance and functionality, increasing the home's resale value. ↑
- Resale Replace worn exterior trim — Fresh trim will enhance curb appeal and increase the home's resale value. ↑
- Resale Replace worn exterior siding — Fresh siding will enhance curb appeal and increase the home's resale value. ↑
- Resale Replace worn exterior paint — Fresh paint will enhance curb appeal and increase the home's resale value. ↑
- Resale Replace worn exterior plants — Fresh plants will enhance curb appeal and increase the home's resale value. ↑
ⓘ Cost ranges are severity-bucket heuristics (US national rule-of-thumb). Get contractor quotes + a written scope before underwriting a rehab budget.
Schools (NCES district)
- District
- Nestucca Valley SD 101J
- NCES district ID
- 4108700
- Math proficiency
- 33% ▼ -4.00%
- Reading proficiency
- 50% ▼ -4.00%
- Median HH income
- $41,958
- Composite
- 37.3/100
- National rank
- #8956
- State rank
- #101 of 183 in OR
Livability — Pacific City
- Score
- 67/100
- State rank
- #173
- US rank
- #10340
Category grades
Schools grade is shown separately in the Schools card above.
Census & demographics
- Census place
- Pacific City, OR
- City population
- 1,505
- Population (ZIP)
- 1,505
Population outlook (Tillamook County) Hauer SSP2
- Today (2025)
- 26,318 people
- By 2030
- 26,603 · +1.1%
- By 2040
- 26,898 · +2.2%
- By 2050
- 27,129 · +3.1%
- By 2075
- 27,858 · +5.9%
- By 2100
- 26,212 · -0.4%
Race, ethnicity, and origin ACS 2023
- Neighborhood character
- Predominantly White (86%)
- Race & ethnicity
- White 86% Hispanic / Latino 8% Two or more races 3%
- Hispanic origin (detail)
- Mexican 8%
- Common ancestry
- Lithuanian 8% Italian 5% Romanian 5%
- Foreign-born
- 1%
- Languages at home
- 97% English-only · Spanish 3%
Political lean MEDSL · Tillamook
- 2024 margin
- Toss-up / Even · D 47.9% · R 49.2% · Other 2.9%
- 2008→2024 swing
- -11.2pp toward R · 2008: 9.9pp · 2024: -1.4pp
- All cycles
- 2024: R+1.4 2020: R+1.7 2016: R+5.9 2012: D+4.7 2008: D+9.9
Not yet ingested
- Civics
- —
Market trends
- HPI YoY
- ▲ 0.73%
- Current HPI
- 197.7747
- Rent YoY
- —
- Metro
- —
- State GDP YoY
- ▲ 2.05%
- F500 in state
- 2
Industry mix (Fortune 500 HQ in OR)
| Industry | F500 HQs | Revenue |
|---|---|---|
| Consumer Goods | 1 | $51B |
|
||
Price history
1 event — show timeline
- 2026-04-08 Listed $700,000 RMLS
Cash-flow waterfall
monthlySold comps — $/sqft
last 12 mo · ≤1 miLoading sold comps…