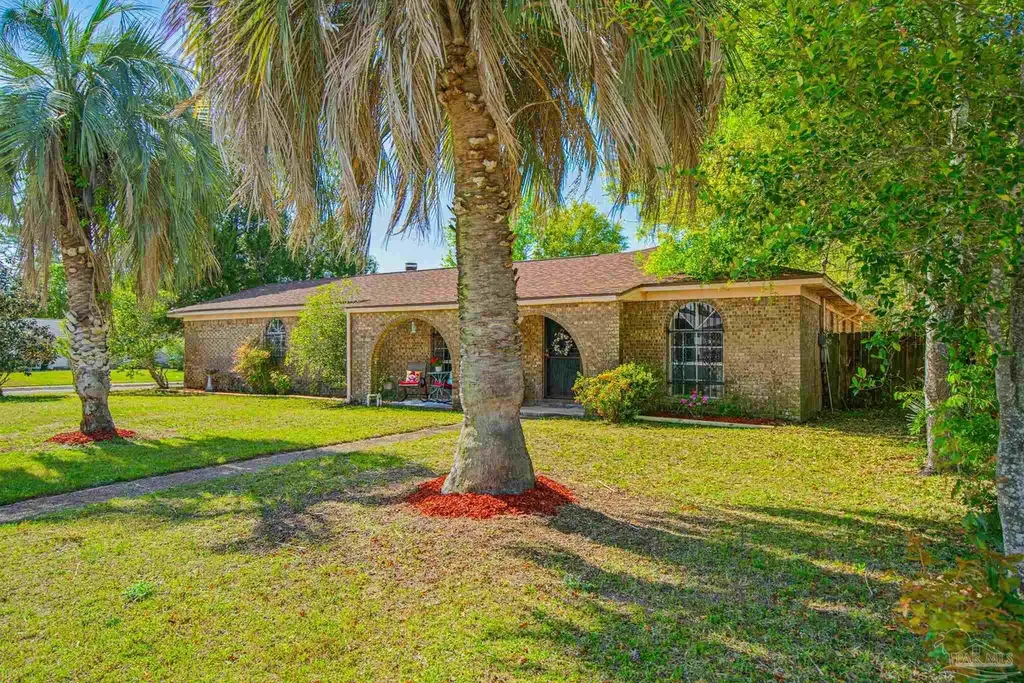
4972 Lanett Dr · Bellview, FL
Flood risk 1/10 · Minimal
- FEMA flood zone
- X (unshaded)
- Chance of flooding over 30 yrs
- 0.0%
- Est. flood insurance / yr
- $507 – $1,088
Fire risk 1/10 · Minimal
- Est. fire insurance / yr
- $947 – $1,759
Heat risk 10/10 · Severe
- Hot days now (above 105°F)
- 7 days/yr
- Hot days in 30 yrs
- 24 days/yr
Wind risk 9/10 · Severe
- Chance of severe wind over 30 yrs
- 99.0%
Air-quality risk 1/10 · Minimal
- Unhealthy air days now
- 0 days/yr
- Unhealthy air days in 30 yrs
- 0 days/yr
Risk factors via First Street. Map © Google.
Why this score? — see what drove the D+ grade
The composite is a weighted blend of 9 inputs, each scored 0–100. Each bar is that input's sub-score; the figure is the points it added to the 100-point composite (weight × sub-score).
- Cash flow +15.5/30.0
- ARV discount +10.9/15.0
- DSCR +4.8/10.0
- Rent growth +3.6/5.0
- Schools +3.6/10.0
- Livability +3.4/5.0
- 1% rule +3.1/10.0
- Condition / age +2.5/5.0
- Appreciation +0.0/10.0
$249,900
🖨 Deal sheet (PDF) 📄 Offer letter ✓ Due diligence
Listing remarks MLS
VERY WELL MAINTAINED HOME. X-LARGE BREAKFAST BAR. STONE FIREPLACE IN FAMILY ROOM. NEW COVERED PATIO INSIDE PRIVACY FENCED CORNER LOT. FORMAL LIVING AND FAMILY ROOMS. LOTS OF CLOSETS. SIDEWALKS. SPRINKLER IS NOT WORKING, SOLD "AS IS". VERY LOVABLE HOME. KITCHEN IS CENTER OF HOME.
Key facts
- Breakfast nook
- Community park
- Covered patio
Tags
Property features AI
Finance
- HOA & community: No association; If applicable, association fees listed annually
Exterior
- Parking: Attached garage with one covered/garage space; Oversized garage with side entrance and garage door opener; One total parking space
- Security: Smoke detectors
- Utilities: Public water; Public sewer; Copper wiring; Cable available; Paved county-maintained road
- Home design: One-story home; Resale property; Not attached to another property; Homestead eligible; Shingle, gable and hip roof
- Construction: Brick and frame construction; Slab foundation
- Exterior features: Covered porch; Back yard with privacy fencing; Corner lot; Central access; Interior lot
Interior
- Kitchen: Laminate counters; Pantry; Built-in microwave; Dishwasher; Refrigerator; Energy Star qualified dishwasher
- Bedrooms: Primary bedroom on the first floor; All bedrooms on the first floor
- Flooring: Vinyl flooring; Carpet
- Bathrooms: Two full bathrooms on the first floor
- Heating & cooling: Central heat and air; Heat pump (Energy Star qualified); Fireplace(s); Ceiling fans
- Interior features: Baseboards; Ceiling fans; High-speed internet; Storm windows; Blinds
- Laundry & utility: Inside laundry with washer/dryer hookups; Electric water heater; Energy Star qualified water heater
Neighborhood map
What this means for you Summary
Snapshot
- This is a 4-bed/2.0-bath single-family listed at $250k.
Deal economics
- At list price, monthly cash flow is $101 ($1k/yr) — positive.
- The deal already cash-flows at list — no discount required.
- To meet the 1% rule (rent ≥ 1% of price), the offer needs to be $202k (19.3% below list).
- Recommended offer: $202k (19.3% below list) — sets the bar for 1% rule.
- Cap rate 6.8% vs local median 5.2% in Bellview — meaningfully above typical; check what's discounted (condition, days-on-market, listing class) to confirm the premium yield is real.
Location & tenants
- Location reads 67/100 on livability (#561 in FL) — a middle-class / working-renter tenant base. Strengths: cost of living A+, housing A+; Watch: amenities F, commute F, health & safety F.
- Escambia (suburban): math 40% / reading 45% proficiency, ranked #56 of 73 in FL (top 77%) — families likely to look elsewhere, expect single-tenant / working-renter base with shorter leases.
- Zoned schools: Bellview Elementary School (math 28% / reading 34%, grade F, #1,854 of 2,144 statewide, top 87%, 545 students, 75% FRL); Bellview Middle School (math 17% / reading 23%, grade F, #558 of 571 statewide, top 98%, 992 students, 76% FRL); Pine Forest High School (math 20% / reading 32%, grade F, #494 of 667 statewide, top 75%, 1,870 students, 62% FRL).
- Zoned-school proficiency averages 26% at this address vs 42% district-wide (-17 pts) — the specific schools serving this property underperform the Escambia average; the district grade overstates school quality for this exact location.
- Market conditions: Rents rising fast (+4.4%/yr); 421 active listings in the ZIP; 13 comparable units currently listed for rent nearby; rentals at typical pace (median 25d on market — plan ~3-4 weeks tenant-placement turnaround); solid renter incomes; 1,479 units permitted in Escambia County in 2024 (0 in 5+ unit buildings).
- This rent runs 32% of the median local income ($75k/yr) — at the standard rent-burdened threshold; future hikes will face affordability resistance.
Forward outlook
- Local home prices are declining (-3.0%/yr); year-one equity from $2k of loan paydown is wiped out by about $7k of value loss. Plan a longer hold.
- Escambia County population projected at +13% by 2050 — modest demand growth; plan on rents tracking national, not racing it.
Negotiation context
- It's been on market 60 days — a 3% lower offer ($242k) is reasonable based on typical stale-listing flexibility.
- 3 sale attempts since 23y ago with the ask held roughly flat each time — persistent listings suggest the price (not the market) is what's stuck; bring a comps-based counter.
- Current owner paid $127k; list at $250k implies a 97% gain — meaningful room to come down on a strong offer.
Risks & watch-outs
- Climate carrying-cost: severe wind risk, 99% chance of damaging wind over 30y; extreme-heat days projected 7→24/yr by 2055 (HVAC capex compounding) — expect insurance premiums to compound above CPI over the hold.
Questions for the listing agent
- It's been on market 60 days. Have you received any prior offers? Is the seller open to a 19% concession, seller financing, or rate buy-down credit?
- Built in 1975 — when were the roof, HVAC, electrical panel, plumbing, and water heater last replaced?
- Is there a deadline driving the sale (1031 exchange, divorce, estate, relocation)? That informs how much negotiation room exists.
- Schools are D-rated, which usually means shorter tenancies and higher turnover. Who's the typical renter profile here, and what's been the actual vacancy rate?
- The area grade is low — what's the realistic commute time and amenity access for the typical tenant pool here? Any planned neighborhood developments (good or bad) we should know about?
- What's the average days-on-market for RENTAL listings here right now (not sales)? A rising rental-DOM trend means longer vacancies and softer asking-rent achievability than the comps imply.
- What's the recent tenant-quality profile in this submarket — average credit score on applications, eviction rate, late-payment / NSF rate, and stable-employment percentage? A property-management company in the area should have these aggregated.
- How much new for-sale + rental construction is in the pipeline within 1–3 miles? Heavy new supply typically softens prices + rents 12–24 months out; constrained supply supports both.
Investment metrics
- 1% rule
- 0.81% ✗
- Cap rate
- 6.78%
- Cash-on-cash
- 1.74%
- DSCR
- 1.08
- GRM
- 10.3
CMA / ARV
- ARV (on-the-fly)
- $270,504
- Comps found
- 12
Show comp detail 12 sales within ~0.75 mi
| Address | Dist | Beds/Ba | Sqft | Sold | Price | $/sf | Match |
|---|---|---|---|---|---|---|---|
| 5800 Avondale Rd | 0.47mi | 4/2.0 | 1,700 (-4%) | 1mo | $110,000 | $65 | 71 |
| 5686 Ventura Ln | 0.27mi | 5/2.0 (+1) | 1,824 (+3%) | 7mo | $260,000 | $143 | 71 |
| 5940 Muldoon Rd | 0.37mi | 3/2.0 (-1) | 1,684 (-5%) | 3mo | $273,000 | $162 | 67 |
| 4655 Kimberly Dr | 0.47mi | 4/2.0 | 1,850 (+5%) | 5mo | $270,000 | $146 | 67 |
| 5687 Nicholas Ln | 0.55mi | 3/2.0 (-1) | 1,863 (+5%) | 4mo | $155,000 | $83 | 57 |
| 5000 Stevendale Rd | 0.61mi | 3/2.0 (-1) | 1,699 (-4%) | 6mo | $225,000 | $132 | 55 |
| 5630 Ferndale Ct | 0.37mi | 4/2.0 | 1,512 (-14%) | 9mo | $235,000 | $155 | 51 |
| 5224 Westwind Cir | 0.61mi | 3/2.0 (-1) | 1,595 (-10%) | 2mo | $289,000 | $181 | 49 |
| 5233 Westwind Cir | 0.57mi | 3/2.0 (-1) | 1,550 (-12%) | 1mo | $237,500 | $153 | 47 |
| 6044 Champion Oaks Dr | 0.52mi | 5/2.0 (+1) | 1,512 (-14%) | 1mo | $200,000 | $132 | 46 |
| 6041 Champion Oaks Dr | 0.51mi | 3/2.0 (-1) | 1,555 (-12%) | 8mo | $255,000 | $164 | 45 |
| 5030 Stevendale Rd | 0.64mi | 3/2.0 (-1) | 1,539 (-13%) | 5mo | $260,000 | $169 | 40 |
Match score weights: distance 35% · size 25% · config 20% · recency 20%. Top-matched comps best support the ARV.
Projected returns pro-forma
-3.0% appreciation · 4.42% rent growth · sell at horizon
- IRR
- -12.2%
- Equity multiple
- 0.55×
- Total profit
- $-31,223
- Equity at exit
- $37,261
- IRR
- -1.4%
- Equity multiple
- 0.90×
- Total profit
- $-6,987
- Equity at exit
- $21,607
Cash invested: $69,972 (down + closing). Projections, not guarantees.
Landlord ↔ Tenant lean methodology
- Overall (STATE)
- 87 Strongly Landlord-Friendly
- State Florida
- 87 Strongly Landlord-Friendly · R+3
- County
- — inherits STATE
- City
- — inherits STATE
ZIP-level market 32526
- Home prices YoY
- -28.3%
- Rents YoY
- 4.4%
- Active inventory
- 421
- Price-to-rent
- 10.3×
Monthly cashflow live
- Estimated rent
- $2,017 high interval (Pro) →
- Mortgage (P&I)
- −$1,311
- Tax from tax record
- −$77 /mo · $924/yr
- Insurance
- −$104
- HOA
- −$0
- Vacancy / Maint / Mgmt
- −$423
- Net cashflow
- $101
Break-even live
Sensitivity live
| Price | -10% $243 | -5% $172 | +0% $101 | +5% $31 | +10% $-40 |
|---|---|---|---|---|---|
| Rent | -10% $-58 | -5% $22 | +0% $101 | +5% $181 | +10% $261 |
| Rate | -1.0pp $227 | -0.5pp $165 | base $101 | +0.5pp $37 | +1.0pp $-29 |
UW: 25.0% down · 7.5% · 30yr · 1.5% tax · 5.0% vac · 8.0% maint · 8.0% mgmt
Financing live
Cash to close
- Down payment
- $62,475
- Closing costs
- $7,497
- Reserves months
- —
- Total cash needed
- —
Loan-product check · same deal, 3 products live
Conventional
25% down · 7.5% · 30yr
- Down + closing
- —
- Monthly P&I
- —
- Monthly cashflow
- —
- DSCR
- —
- Eligible?
- —
Personal DTI + credit; lowest rate.
DSCR
20% down · 8.5% · 30yr
- Down + closing
- —
- Monthly P&I
- —
- Monthly cashflow
- —
- DSCR
- —
- Eligible?
- —
No personal income docs; deal must DSCR.
Hard money
10% down · 12.0% · 12mo
- Down + closing
- —
- Monthly P&I
- —
- Monthly cashflow
- —
- DSCR
- —
- Eligible?
- —
Short-term bridge; refi at stabilization.
Rent comps 13 comps
| Address | Beds | Baths | Sqft | Rent | $/sqft | DOM | Units | Dist |
|---|---|---|---|---|---|---|---|---|
| 4856 Genevive Ct Pensacola, FL | 3.0 | 2.0 | 1900 | $1,850 | $0.97 | 15d | 1 | 0.17mi |
| 6077 Royal Port Ct Pensacola, FL | 3.0 | 2.5 | 1542 | $1,775 | $1.15 | 25d | 1 | 0.62mi |
| 6081 Royal Port Ct Pensacola, FL | 3.0 | 2.5 | 1428 | $1,850 | $1.30 | 25d | 1 | 0.62mi |
| 5217 Saufley Field Rd Pensacola, FL | 4.0 | 2.5 | 1817 | $1,895 | $1.04 | 25d | 1 | 0.63mi |
| 5184 Regalo Dr Pensacola, FL | 3.0 | 2.0 | 1504 | $1,900 | $1.26 | 25d | 1 | 0.63mi |
| 3230 Palmdale Ave Pensacola, FL | 3.0 | 2.0 | 1300 | $1,500 | $1.15 | 25d | 1 | 0.75mi |
| 6225 Mobile Hwy Pensacola, FL | 1.0–3.0 | 1.0–2.0 | 1036 | $2,595 | $2.50 | 15d | 15 | 0.87mi |
| 6379 Mers Ln Pensacola, FL | 3.0 | 2.5 | 1811 | $1,900 | $1.05 | 23d | 1 | 1.02mi |
| 5519 Lexlee Blvd Pensacola, FL | 3.0 | 2.5 | 1543 | $1,850 | $1.20 | 25d | 1 | 1.05mi |
| 5604 Scotland Ter Pensacola, FL | 3.0 | 2.0 | 1231 | $1,600 | $1.30 | 15d | 1 | 1.17mi |
| 5172 Zachary Blvd Pensacola, FL | 3.0 | 2.0 | 1803 | $1,900 | $1.05 | 25d | 1 | 1.34mi |
| 1860 Broyhill Ln Pensacola, FL | 3.0 | 2.0 | 1561 | $1,600 | $1.02 | 25d | 1 | 1.36mi |
| 2702 Massachusetts Ave Pensacola, FL | 1.0–3.0 | 1.0–2.5 | 1150 | $1,745 | $1.52 | 15d | 9 | 1.38mi |
Listing history 24 events
-
2026-06-21days on market $249,900 Active 60 DOM
-
2026-06-18days on market $249,900 Active 57 DOM
-
2026-06-17days on market $249,900 Active 56 DOM
-
2026-06-16days on market $249,900 Active 55 DOM
-
2026-06-15days on market $249,900 Active 54 DOM
-
2026-06-14days on market $249,900 Active 52 DOM
-
2026-06-10days on market $249,900 Active 49 DOM
-
2026-06-09days on market $249,900 Active 48 DOM
-
2026-06-08days on market $249,900 Active 47 DOM
-
2026-06-07days on market $249,900 Active 46 DOM
-
2026-06-03days on market $249,900 Active 42 DOM
-
2026-06-02days on market $249,900 Active 41 DOM
-
2026-06-01days on market $249,900 Active 40 DOM
-
2026-05-31days on market $249,900 Active 39 DOM
-
2026-05-31days on market $249,900 Active 38 DOM
-
2026-05-19status Active
-
2026-05-12historical
-
2026-04-14$249,900 Active
-
2005-01-06soldstatus $126,900
-
2003-12-11soldstatus $98,900
-
2003-11-25soldstatus $98,900 291-char remark
Show marketing remark (291 chars)
VERY WELL MAINTAINED HOME. X-LARGE BREAKFAST BAR. STONE FIREPLACE IN FAMILY ROOM. NEW COVERED PATIO INSIDE PRIVACY FENCED CORNER LOT. FORMAL LIVING AND FAMILY ROOMS. LOTS OF CLOSETS. SIDEWALKS. SPRINKLER IS NOT WORKING, SOLD "AS IS". VERY LOVABLE HOME. KITCHEN IS CENTER OF HOME.
-
2003-08-18$99,900 291-char remark
Show marketing remark (291 chars)
VERY WELL MAINTAINED HOME. X-LARGE BREAKFAST BAR. STONE FIREPLACE IN FAMILY ROOM. NEW COVERED PATIO INSIDE PRIVACY FENCED CORNER LOT. FORMAL LIVING AND FAMILY ROOMS. LOTS OF CLOSETS. SIDEWALKS. SPRINKLER IS NOT WORKING, SOLD "AS IS". VERY LOVABLE HOME. KITCHEN IS CENTER OF HOME.
-
1996-02-27soldstatus $85,000
-
1975-01-01soldstatus $35,000
ⓘ Source: listings_history table (triggers on properties + properties_extension) + one-shot
backfill from property_details.listing_events for pre-trigger history.
Tax reassessment forecast FL · Resets to sale price
- Current annual tax
- $924 · $77/mo
- Projected year-2 tax
- $2,074 · $173/mo
- Expected delta
- +$1,150/yr (+$96/mo · 124.5%)
ⓘ Screening estimate from a state-policy table — verify with the county assessor before closing.
Climate risk First Street
- Flood 1/10 Low FEMA zone X (unshaded) · 0% chance over 30 yrs
- Wildfire 1/10 Low
- Heat 10/10 Extreme 7 d/yr ≥105°F today · 24 d/yr by 30 yrs out
- Wind 9/10 Extreme 99% chance of damaging wind over 30 yrs
- Air quality 1/10 Low 0 unhealthy d/yr today · 0 by 30 yrs out
Nearby sold comps map
Loading sold comps map…
Walkable amenities ~0.75 mi
Loading nearby amenities…
Taxation est. · year 1
- Rental income
- $24,199
- − Mortgage interest
- −$13,998
- − Property taxes
- −$924
- − Insurance
- −$1,250
- − Repairs & maintenance
- −$1,936
- − Management
- −$1,936
- − Depreciation
- −$7,270
- Taxable loss
- −$3,114
- Est. tax savings @ 24.0%
- +$747
- After-tax cash flow
- $1,965/yr
For passive investors: Depreciation is non-cash, so a rental often shows a tax loss while cash-flowing — sheltering income. Rental losses are passive: they offset passive income freely, and up to $25,000/yr can offset ordinary (W-2) income if you actively participate and your MAGI is under $100k (phasing out to $0 by $150k); unused losses carry forward. On sale, claimed depreciation is recaptured at up to 25%, and gains may owe capital-gains tax (a 1031 exchange can defer both). Figures are a year-1 estimate at your 24.0% rate — not tax advice; consult a CPA.
Schools (NCES district)
- District
- Escambia
- NCES district ID
- 1200510
- Math proficiency
- 40% ▼ -9.00%
- Reading proficiency
- 45% ▼ -4.00%
- Median HH income
- $44,649
- Composite
- 36.04/100
- National rank
- #4773
- State rank
- #56 of 73 in FL
Livability — Bellview
- Score
- 67/100
- State rank
- #561
- US rank
- #10731
Category grades
Schools grade is shown separately in the Schools card above.
Census & demographics
- Census place
- Bellview, FL
- County
- Escambia County · 301,722 people
- Metro
- Pensacola-Ferry Pass-Brent, FL
- Population (ZIP)
- 44,680
- Household income
- $75,098
- Rent vs Own
- Severe rent burden
- 1166.0
Population outlook (Escambia County) Hauer SSP2
- Today (2025)
- 334,637 people
- By 2030
- 345,779 · +3.3%
- By 2040
- 364,828 · +9.0%
- By 2050
- 378,514 · +13.1%
- By 2075
- 403,220 · +20.5%
- By 2100
- 386,125 · +15.4%
Race, ethnicity, and origin ACS 2023
- Neighborhood character
- Predominantly White (66%)
- Race & ethnicity
- White 66% Black 19% Two or more races 8% Hispanic / Latino 5% Asian 3%
- Common ancestry
- Lithuanian 2% Slovak 2% Serbian 2%
- Foreign-born
- 5% · Canada, China
- Languages at home
- 94% English-only · Spanish 2% Tagalog/Filipino 1% Other Indo-European 1%
Political lean MEDSL · Escambia
- 2024 margin
- R (+19.5) · D 39.7% · R 59.2% · Other 1.1%
- 2008→2024 swing
- -0.2pp no change · 2008: -19.3pp · 2024: -19.5pp
- All cycles
- 2024: R+19.5 2020: R+15.1 2016: R+20.6 2012: R+20.6 2008: R+19.3
Not yet ingested
- Civics
- —
Market trends
- HPI YoY
- ▼ -99.68%
- Current HPI
- 252.6406
- Rent YoY
- ▲ 4.42%
- Metro
- Pensacola-Ferry Pass-Brent, FL
- State GDP YoY
- ▲ 3.28%
- F500 in state
- 36
Industry mix (Fortune 500 HQ in FL)
| Industry | F500 HQs | Revenue |
|---|---|---|
| Industrial Technology | 2 | $29B |
|
||
| Insurance | 2 | $17B |
|
||
| Retail | 1 | $60B |
|
||
| Technology Distribution | 1 | $58B |
|
||
| Homebuilding | 1 | $35B |
|
||
| Technology Manufacturing | 1 | $35B |
|
||
Price history
+614.0% since first listed9 events — show timeline
- 2026-05-19 Relisted — PARMLS
- 2026-05-12 Listing Removed — PARMLS
- 2026-04-14 Listed $249,900 PARMLS
- 2005-01-06 Sold (Public Records) $126,900 Public Records
- 2003-12-11 Sold (Public Records) $98,900 Public Records
- 2003-11-25 Sold (MLS) $98,900 PARMLS
- 2003-08-18 Listed $99,900 PARMLS
- 1996-02-27 Sold (Public Records) $85,000 Public Records
- 1975-01-01 Sold (Public Records) $35,000 Public Records
Property tax history
+3.9%/yrLatest (2025): $924 · +21.3% YoY. Source: county tax records.
Cash-flow waterfall
monthlySold comps — $/sqft
last 12 mo · ≤1 miLoading sold comps…