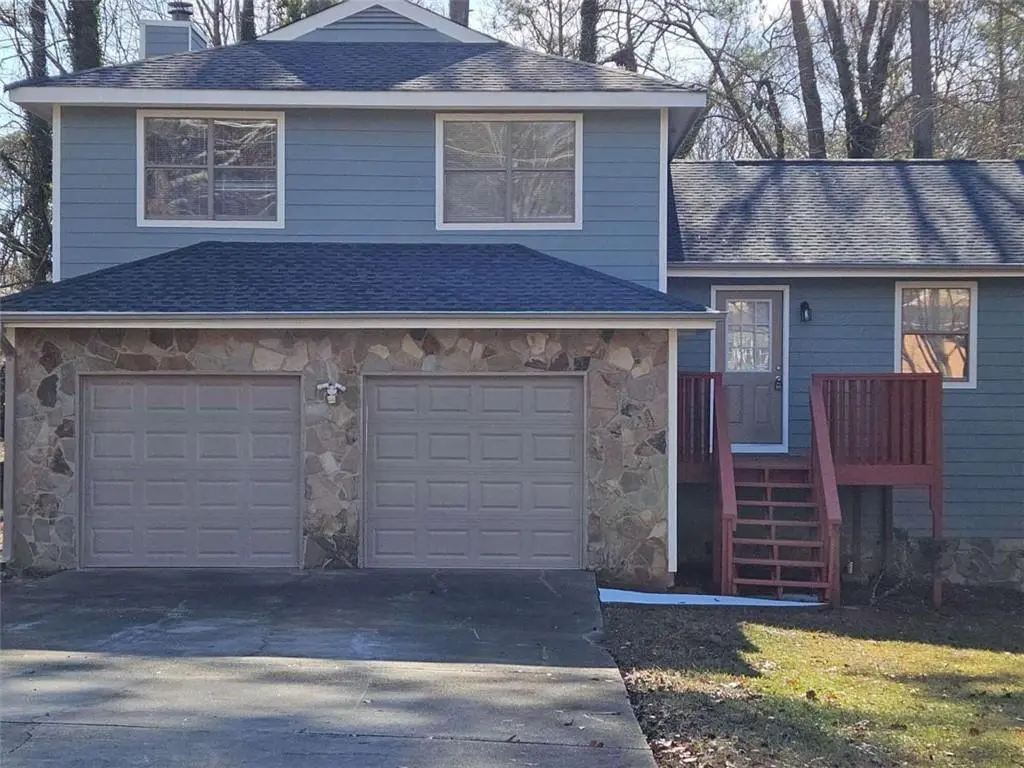
4321 Sebring Walk · Stonecrest, GA
Flood risk 1/10 · Minimal
- FEMA flood zone
- X (unshaded)
- Chance of flooding over 30 yrs
- 0.0%
- Est. flood insurance / yr
- $507 – $1,088
Fire risk 1/10 · Minimal
- Est. fire insurance / yr
- $963 – $1,789
Heat risk 6/10 · Moderate
- Hot days now (above 105°F)
- 7 days/yr
- Hot days in 30 yrs
- 18 days/yr
Wind risk 5/10 · Moderate
- Chance of severe wind over 30 yrs
- 26.0%
Air-quality risk 5/10 · Moderate
- Unhealthy air days now
- 7 days/yr
- Unhealthy air days in 30 yrs
- 10 days/yr
Risk factors via First Street. Map © Google.
Why this score? — see what drove the D grade
The composite is a weighted blend of 9 inputs, each scored 0–100. Each bar is that input's sub-score; the figure is the points it added to the 100-point composite (weight × sub-score).
- ARV discount +12.3/15.0
- Cash flow +11.2/30.0
- 1% rule +3.5/10.0
- DSCR +3.3/10.0
- Rent growth +3.0/5.0
- Livability +2.5/5.0
- Condition / age +2.5/5.0
- Schools +2.1/10.0
- Appreciation +0.0/10.0
$277,900
🖨 Deal sheet 📄 Offer letter ✓ Due diligence
Listing remarks MLS
Welcome home to this 3-bedroom, 2 1/2-bathroom, multi-split-level home with a 2-car attached garage located in the city of Decatur just 5 minutes away from I-20 and approx. 20 minutes from downtown Atlanta, downtown Decatur, Stonecrest Mall, Panola State Park and Arabia Mountain. This home is situated in a well-established, family-oriented neighborhood. This home offers beautiful LVP flooring throughout the lower levels. Step down into a sunken family room, centered with a gas fireplace where you can enjoy time with family and friends. This home also has a separate dining room that seats up to 6 people and an eat-in kitchen with access to the backyard deck. All bedrooms are located on the upper level and the newly renovated master has a beautifully tiled glass enclosed shower with a rainfall showerhead great for your personal private meditation time. This home won't last long! Schedule your appointment today.
Key facts
- Separate dining room
- Sunken family room
- Gas fireplace
Tags
Neighborhood map
What this means for you Summary
Snapshot
- This is a 3-bed/2.5-bath single-family listed at $278k.
Deal economics
- At list price, monthly cash flow is $-107 ($-1k/yr) — negative.
- To cash-flow at today's rent, offer at most $259k (6.8% below list).
- To meet the 1% rule (rent ≥ 1% of price), the offer needs to be $237k (14.9% below list).
- Recommended offer: $237k (14.9% below list) — sets the bar for 1% rule.
Location & tenants
- Location reads: area grade D — affects rentability + tenant quality, not the cash-flow math above.
- Dekalb County (suburban): math 19% / reading 28% proficiency, ranked #125 of 174 in GA (top 72%) — low school quality limits family demand, transient renter base, plan for 1-2y turnover; 68% free/reduced lunch — lower-income household profile, screen leases tightly.
- Market conditions: Rents rising (+2.2%/yr); 353 active listings in the ZIP; 12 comparable units currently listed for rent nearby; rentals lingering (median 44d on market — plan ~5-8 weeks vacancy on turnover, expect pricing pressure); 50% of comp listings sitting > 30 days — soft ceiling on asking rent; 1,240 units permitted in DeKalb County in 2024 (385 in 5+ unit buildings).
- This rent runs 45% of the median local income ($64k/yr) — at the standard rent-burdened threshold; future hikes will face affordability resistance.
Forward outlook
- Local home prices are declining (-3.0%/yr); year-one equity from $2k of loan paydown is wiped out by about $8k of value loss. Plan a longer hold.
- DeKalb County population projected at +28% by 2050 — long-run rental-demand tailwind backs the buy-and-hold thesis.
Negotiation context
- It's been on market 152 days — a 12% lower offer ($245k) is reasonable based on typical stale-listing flexibility.
- 3 sale attempts since 8y ago with the ask held roughly flat each time — persistent listings suggest the price (not the market) is what's stuck; bring a comps-based counter.
- Current owner paid $150k; list at $278k implies a 85% gain — meaningful room to come down on a strong offer.
Risks & watch-outs
- Climate carrying-cost: moderate wind risk, 26% chance of damaging wind over 30y; extreme-heat days projected 7→18/yr by 2055 (HVAC capex compounding) — expect insurance premiums to compound above CPI over the hold.
Questions for the listing agent
- What do current leases actually rent for vs. the listed asking? Can we see a recent rent roll and the last 12 months of T-12 income?
- It's been on market 152 days. Have you received any prior offers? Is the seller open to a 15% concession, seller financing, or rate buy-down credit?
- Why hasn't it sold? Are there any deal-killer items the seller is aware of (foundation, flood, title, zoning, code violations)?
- Is there a deadline driving the sale (1031 exchange, divorce, estate, relocation)? That informs how much negotiation room exists.
- The area grade is low — what's the realistic commute time and amenity access for the typical tenant pool here? Any planned neighborhood developments (good or bad) we should know about?
- What's the average days-on-market for RENTAL listings here right now (not sales)? A rising rental-DOM trend means longer vacancies and softer asking-rent achievability than the comps imply.
- What's the recent tenant-quality profile in this submarket — average credit score on applications, eviction rate, late-payment / NSF rate, and stable-employment percentage? A property-management company in the area should have these aggregated.
- How much new for-sale + rental construction is in the pipeline within 1–3 miles? Heavy new supply typically softens prices + rents 12–24 months out; constrained supply supports both.
Investment metrics
- 1% rule
- 0.85% ✗
- Cap rate
- 5.83%
- Cash-on-cash
- -1.65%
- DSCR
- 0.93
- GRM
- 9.8
CMA / ARV
- ARV (median comp)
- $311,067
- List price
- $277,900
- Delta
- -10.66%
- Verdict
- UNDERPRICED
- Comps
- 20 within 1.0 mi
Show comp detail 12 sales within ~0.75 mi
| Address | Dist | Beds/Ba | Sqft | Sold | Price | $/sf | Match |
|---|---|---|---|---|---|---|---|
| 2904 Pleasant Ridge Dr | 0.29mi | 3/2.0 | 1,956 (+2%) | 8mo | $244,000 | $125 | 75 |
| 4402 Sebring Walk | 0.13mi | 4/2.5 (+1) | 1,968 (+2%) | 13mo | $230,000 | $117 | 75 |
| 2849 Snapfinger Rd | 0.27mi | 4/3.0 (+1) | 1,925 (0%) | 7mo | $256,000 | $133 | 74 |
| 4171 Liffey Ln | 0.41mi | 3/2.5 | 1,919 (-0%) | 8mo | $450,000 | $234 | 74 |
| 4480 Raleigh Dr | 0.70mi | 3/2.0 | 1,882 (-2%) | 5mo | $177,000 | $94 | 57 |
| 3127 Snapfinger Ct | 0.43mi | 3/2.5 | 2,186 (+14%) | 1mo | $185,000 | $85 | 56 |
| 3257 Greenvale Way | 0.52mi | 3/2.0 | 1,761 (-8%) | 6mo | $225,000 | $128 | 54 |
| 4328 Luxembourg Dr | 0.53mi | 3/2.0 | 1,689 (-12%) | 1mo | $310,000 | $184 | 52 |
| 4762 Huntsman Bnd | 0.66mi | 3/2.0 | 1,864 (-3%) | 12mo | $248,350 | $133 | 52 |
| 4647 Wonder Valley Trl | 0.65mi | 3/2.0 | 1,656 (-14%) | 11mo | $312,000 | $188 | 35 |
| 4817 Huntsman Bnd | 0.61mi | 3/2.0 | 1,643 (-15%) | 14mo | $240,000 | $146 | 33 |
| 2963 Thompson Cir | 0.56mi | 4/2.0 (+1) | 1,656 (-14%) | 13mo | $211,000 | $127 | 33 |
Match score weights: distance 35% · size 25% · config 20% · recency 20%. Top-matched comps best support the ARV.
Projected returns pro-forma
-3.0% appreciation · 2.18% rent growth · sell at horizon
- IRR
- -19.9%
- Equity multiple
- 0.31×
- Total profit
- $-53,697
- Equity at exit
- $41,436
- IRR
- -14.7%
- Equity multiple
- 0.19×
- Total profit
- $-63,045
- Equity at exit
- $24,028
Cash invested: $77,812 (down + closing). Projections, not guarantees.
Landlord ↔ Tenant lean methodology
- Overall (STATE)
- 90 Strongly Landlord-Friendly
- State Georgia
- 90 Strongly Landlord-Friendly · R+3
- County
- — inherits STATE
- City
- — inherits STATE
ZIP-level market 30034
- Home prices YoY
- -27.4%
- Rents YoY
- 2.2%
- Active inventory
- 353
- Price-to-rent
- 9.8×
Monthly cashflow live
- Estimated rent
- $2,366 high interval (Pro) →
- Mortgage (P&I)
- −$1,457
- Tax from tax record
- −$403 /mo · $4,834/yr
- Insurance
- −$116
- HOA
- −$0
- Vacancy / Maint / Mgmt
- −$497
- Net cashflow
- $-107
Break-even live
UW: 25.0% down · 7.5% · 30yr · 1.5% tax · 5.0% vac · 8.0% maint · 8.0% mgmt
Financing live
Cash to close
- Down payment
- $69,475
- Closing costs
- $8,337
- Reserves months
- —
- Total cash needed
- —
Loan-product check · same deal, 3 products live
Conventional
25% down · 7.5% · 30yr
- Down + closing
- —
- Monthly P&I
- —
- Monthly cashflow
- —
- DSCR
- —
- Eligible?
- —
Personal DTI + credit; lowest rate.
DSCR
20% down · 8.5% · 30yr
- Down + closing
- —
- Monthly P&I
- —
- Monthly cashflow
- —
- DSCR
- —
- Eligible?
- —
No personal income docs; deal must DSCR.
Hard money
10% down · 12.0% · 12mo
- Down + closing
- —
- Monthly P&I
- —
- Monthly cashflow
- —
- DSCR
- —
- Eligible?
- —
Short-term bridge; refi at stabilization.
Rent comps 12 comps
| Address | Beds | Baths | Sqft | Rent | $/sqft | DOM | Units | Dist |
|---|---|---|---|---|---|---|---|---|
| 2937 Thompson Cir Decatur, GA | 3.0 | 2.0 | 1480 | $1,860 | $1.26 | 1d | 1 | 0.52mi |
| 3095 Riders Trl Decatur, GA | 3.0 | 2.0 | 1800 | $4,500 | $2.50 | 1d | 1 | 0.56mi |
| 2564 Treadway Dr Decatur, GA | 3.0 | 2.0 | 1927 | $2,950 | $1.53 | 43d | 1 | 0.75mi |
| 4336 Pleasant Point Dr Decatur, GA | 1.0–3.0 | 1.0–2.0 | 1010 | $1,235 | $1.22 | 1d | 4 | 0.82mi |
| 2692 Paxton PL #14 Decatur, GA | 3.0 | 2.5 | 1611 | $2,299 | $1.43 | 43d | 1 | 0.86mi |
| 4292 Callum Ct Decatur, GA | 3.0 | 2.5 | 1611 | $2,200 | $1.37 | 43d | 1 | 0.95mi |
| 4282 Callum Ct Decatur, GA | 3.0 | 2.5 | 1611 | $2,200 | $1.37 | 43d | 1 | 0.95mi |
| 4433 Golf Vista Cir Decatur, GA | 3.0 | 2.5 | 1495 | $1,350 | $0.90 | 24d | 1 | 0.97mi |
| 2878 Snapfinger Mnr Decatur, GA | 3.0 | 2.5 | 1670 | $1,780 | $1.07 | 2d | 1 | 1.14mi |
| 2559 Walden Lake Dr Unit 1 Decatur, GA | 3.0 | 2.5 | 1464 | $2,000 | $1.37 | 43d | 1 | 1.37mi |
| 2545 Walden Lake Dr Unit 1 Decatur, GA | 3.0 | 2.5 | 1464 | $2,000 | $1.37 | 43d | 1 | 1.39mi |
| 3715 Boring Rd Decatur, GA | 3.0 | 2.0 | 1379 | $1,525 | $1.11 | 21d | 1 | 1.45mi |
Listing history 14 events
-
2026-06-04days on market $277,900 Active 152 DOM
-
2026-06-03days on market $277,900 Active 151 DOM
-
2026-06-02days on market $277,900 Active 150 DOM
-
2026-06-01days on market $277,900 Active 149 DOM
-
2026-05-31days on market $277,900 Active 148 DOM
-
2026-01-03$277,900 Active 922-char remark
Show marketing remark (922 chars)
Welcome home to this 3-bedroom, 2 1/2-bathroom, multi-split-level home with a 2-car attached garage located in the city of Decatur just 5 minutes away from I-20 and approx. 20 minutes from downtown Atlanta, downtown Decatur, Stonecrest Mall, Panola State Park and Arabia Mountain. This home is situated in a well-established, family-oriented neighborhood. This home offers beautiful LVP flooring throughout the lower levels. Step down into a sunken family room, centered with a gas fireplace where you can enjoy time with family and friends. This home also has a separate dining room that seats up to 6 people and an eat-in kitchen with access to the backyard deck. All bedrooms are located on the upper level and the newly renovated master has a beautifully tiled glass enclosed shower with a rainfall showerhead great for your personal private meditation time. This home won't last long! Schedule your appointment today.
-
2024-06-05historical
-
2024-04-19price $315,000
-
2024-02-03price $319,900
-
2024-01-05$325,000 Active
-
2021-10-29soldstatus $150,000
-
2019-02-12historical
-
2018-12-16$90,000 New
-
2006-10-12soldstatus $140,000
ⓘ Source: listings_history table (triggers on properties + properties_extension) + one-shot
backfill from property_details.listing_events for pre-trigger history.
Tax reassessment forecast GA · Resets to sale price
- Current annual tax
- $4,834 · $403/mo
- Projected year-2 tax
- $4,834 · $403/mo
- Expected delta
- $0/yr ($0/mo · 0.0%)
ⓘ Screening estimate from a state-policy table — verify with the county assessor before closing.
Climate risk First Street
- Flood 1/10 Low FEMA zone X (unshaded) · 0% chance over 30 yrs
- Wildfire 1/10 Low
- Heat 6/10 Major 7 d/yr ≥105°F today · 18 d/yr by 30 yrs out
- Wind 5/10 Major 26% chance of damaging wind over 30 yrs
- Air quality 5/10 Major 7 unhealthy d/yr today · 10 by 30 yrs out
Nearby sold comps map
Loading sold comps map…
Walkable amenities ~0.75 mi
Loading nearby amenities…
Taxation est. · year 1
- Rental income
- $28,393
- − Mortgage interest
- −$15,567
- − Property taxes
- −$4,834
- − Insurance
- −$1,390
- − Repairs & maintenance
- −$2,271
- − Management
- −$2,271
- − Depreciation
- −$8,084
- Taxable loss
- −$6,024
- Est. tax savings @ 24.0%
- +$1,446
- After-tax cash flow
- $165/yr
For passive investors: Depreciation is non-cash, so a rental often shows a tax loss while cash-flowing — sheltering income. Rental losses are passive: they offset passive income freely, and up to $25,000/yr can offset ordinary (W-2) income if you actively participate and your MAGI is under $100k (phasing out to $0 by $150k); unused losses carry forward. On sale, claimed depreciation is recaptured at up to 25%, and gains may owe capital-gains tax (a 1031 exchange can defer both). Figures are a year-1 estimate at your 24.0% rate — not tax advice; consult a CPA.
Schools (NCES district)
- District
- Dekalb County
- NCES district ID
- 1301740
- Math proficiency
- 19% ▼ -12.00%
- Reading proficiency
- 28% ▼ -7.00%
- Median HH income
- $51,448
- Composite
- 20.92/100
- National rank
- #8482
- State rank
- #125 of 174 in GA
Livability — Stonecrest
No livability data for this city. (Only ~50 U.S. cities are tracked.)
Census & demographics
- County
- Dekalb County · 782,738 people
- City population
- 106,165
- Metro
- Atlanta-Sandy Springs-Alpharetta, GA
- Population (ZIP)
- 41,847
- Household income
- $63,517
- Rent vs Own
- Severe rent burden
- 1659.0
Population outlook (DeKalb County) Hauer SSP2
- Today (2025)
- 839,977 people
- By 2030
- 891,768 · +6.2%
- By 2040
- 988,894 · +17.7%
- By 2050
- 1,074,583 · +27.9%
- By 2075
- 1,245,026 · +48.2%
- By 2100
- 1,303,135 · +55.1%
Race, ethnicity, and origin ACS 2023
- Neighborhood character
- Predominantly Black (90%)
- Race & ethnicity
- Black 90% White 4% Two or more races 3% Hispanic / Latino 2%
- Common ancestry
- Hispanic 1% Lithuanian 1%
- Foreign-born
- 8% · Canada
- Languages at home
- 93% English-only · Spanish 2% French/Haitian/Cajun 1%
Political lean MEDSL · DeKalb
- 2024 margin
- Solid D (+64.8) · D 81.9% · R 17.1% · Other 1.0%
- 2008→2024 swing
- +6.1pp toward D · 2008: 58.6pp · 2024: 64.8pp
- All cycles
- 2024: D+64.8 2020: D+67.4 2016: D+64.8 2012: D+56.8 2008: D+58.6
Not yet ingested
- Civics
- —
Market trends
- HPI YoY
- ▼ -78.92%
- Current HPI
- 209.5638
- Rent YoY
- ▲ 2.18%
- Metro
- Atlanta-Sandy Springs-Alpharetta, GA
- State GDP YoY
- ▲ 2.66%
- F500 in state
- 28
Industry mix (Fortune 500 HQ in GA)
| Industry | F500 HQs | Revenue |
|---|---|---|
| Paper / Packaging | 2 | $29B |
|
||
| Retail | 1 | $160B |
|
||
| Transportation / Logistics | 1 | $91B |
|
||
| Airlines | 1 | $62B |
|
||
| Consumer Goods | 1 | $47B |
|
||
| Utilities | 1 | $25B |
|
||
Price history
+98.5% since first listed9 events — show timeline
- 2026-01-03 Listed $277,900 FMLS
- 2024-06-05 Listing Removed — FMLS
- 2024-04-19 Price Changed $315,000 FMLS
- 2024-02-03 Price Changed $319,900 FMLS
- 2024-01-05 Listed $325,000 FMLS
- 2021-10-29 Sold (Public Records) $150,000 Public Records
- 2019-02-12 Listing Removed — GAMLS
- 2018-12-16 Listed $90,000 GAMLS
- 2006-10-12 Sold (Public Records) $140,000 Public Records
Property tax history
+7.0%/yrLatest (2025): $4,834 · +10.8% YoY. Source: county tax records.
Cash-flow waterfall
monthlySold comps — $/sqft
last 12 mo · ≤1 miLoading sold comps…