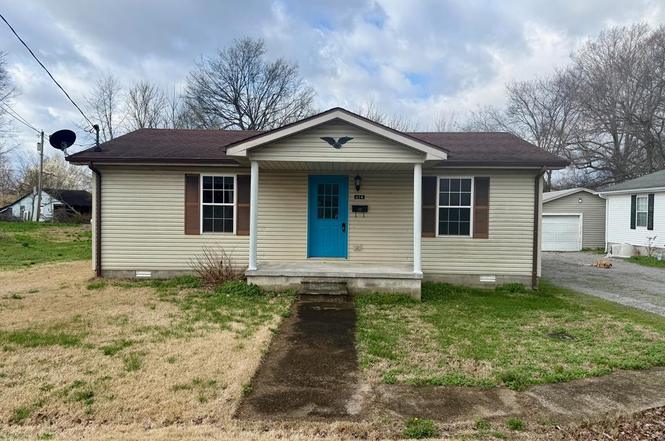
614 Saint Bernard St · Providence, KY
Flood risk 1/10 · Minimal
- FEMA flood zone
- X (unshaded)
- Chance of flooding over 30 yrs
- 0.0%
- Est. flood insurance / yr
- $507 – $1,088
Fire risk 4/10 · Minor
- Est. fire insurance / yr
- $839 – $1,559
Heat risk 5/10 · Moderate
- Hot days now (above 109°F)
- 7 days/yr
- Hot days in 30 yrs
- 19 days/yr
Wind risk 3/10 · Minor
- Chance of severe wind over 30 yrs
- 5.0%
Air-quality risk 2/10 · Minimal
- Unhealthy air days now
- 1 days/yr
- Unhealthy air days in 30 yrs
- 1 days/yr
Risk factors via First Street. Map © Google.
Why this score? — see what drove the B- grade
The composite is a weighted blend of 9 inputs, each scored 0–100. Each bar is that input's sub-score; the figure is the points it added to the 100-point composite (weight × sub-score).
- Cash flow +27.4/30.0
- DSCR +9.6/10.0
- Appreciation +7.7/10.0
- ARV discount +6.7/15.0
- 1% rule +6.3/10.0
- Livability +3.1/5.0
- Rent growth +2.5/5.0
- Schools +2.5/10.0
- Condition / age +2.5/5.0
$75,000
🖨 Deal sheet (PDF) 📄 Offer letter ✓ Due diligence
Listing remarks
Charming 2 bed, 1 bath home offering approximately 888 square feet. This property offers a functional kitchen and decent sized bedrooms. Perfect for first- time home buyers, downsizers or investors. The backyard offers some privacy, flat and a great area for kids or pets to play. Contact Amber Goff at 270-871-3179 for more information or your own private showing!
Key facts
- Functional kitchen
- Backyard privacy
- Flat backyard
Tags
Property features AI
Exterior
- Parking: Gravel parking area
- Utilities: Public water; Public sewer
- Home design: Single-family residence; Residential property
- Construction: Vinyl siding; Composition roof
- Exterior features: Covered patio/porch
Interior
- Kitchen: Range; Gas range
- Bedrooms: 2 bedrooms on the main level
- Bathrooms: 1 full bathroom on the main level
- Heating & cooling: Natural gas heating; Central air conditioning
- Interior features: Range and gas range; Gas water heater
- Laundry & utility: Main level laundry
Neighborhood map
What this means for you Summary
Snapshot
- This is a 2-bed/1.0-bath single-family listed at $75k.
Deal economics
- At list price, monthly cash flow is $220 ($3k/yr) — positive.
- The deal already cash-flows at list — no discount required.
- Meets the 1% rule at list price ($849 rent vs $75k).
- Recommended offer: $73k (3.0% below list) — sets the bar for market timing.
Location & tenants
- Location reads 62/100 on livability (#352 in KY) — a middle-class / working-renter tenant base. Strengths: crime A+, cost of living A+, housing A; Watch: amenities F, commute F, employment F.
- Webster County (rural): math 25% / reading 34% proficiency, ranked #114 of 165 in KY (top 69%) — low school quality limits family demand, transient renter base, plan for 1-2y turnover.
- Zoned schools: Providence Elementary School (math 22% / reading 37%, grade F, #393 of 676 statewide, top 63%, 290 students, 76% FRL); Webster County Middle School (math 22% / reading 36%, grade F, #156 of 217 statewide, top 74%, 315 students, 66% FRL); Webster County High School (math 22% / reading 27%, grade F, #179 of 254 statewide, top 78%, 676 students, 61% FRL) — zoned schools average 68% FRL vs 51% district-wide (17 pts higher); higher-poverty schools than district average — tighter screening recommended.
- Market conditions: 22 active listings in the ZIP; 6 units permitted in Webster County in 2024 (0 in 5+ unit buildings).
Forward outlook
- In year one you build about $5k of equity ($519 loan paydown + $4k appreciation (5.4% local appreciation)).
- Webster County population projected at -14% by 2050 — secular population decline; favor cash flow + early exit over multi-decade hold.
- At projected returns (5.4% appreciation + 3.0% rent growth), your $21k cash investment doubles in ~3 years — after that, you're playing with house money.
- By year 8, paydown + projected appreciation supports a ~$35k cash-out refi (75% LTV) — recoverable capital for the next deal without selling this one.
Negotiation context
- It's been on market 43 days — a 3% lower offer ($73k) is reasonable based on typical stale-listing flexibility.
- 2 sale attempts with the ask held roughly flat each time — persistent listings suggest the price (not the market) is what's stuck; bring a comps-based counter.
- Current owner paid $21k; list at $75k implies a 257% gain — meaningful room to come down on a strong offer.
Risks & watch-outs
- Climate carrying-cost: extreme-heat days projected 7→19/yr by 2055 (HVAC capex compounding) — expect insurance premiums to compound above CPI over the hold.
Questions for the listing agent
- It's been on market 43 days. Have you received any prior offers? Is the seller open to a 3% concession, seller financing, or rate buy-down credit?
- Is there a deadline driving the sale (1031 exchange, divorce, estate, relocation)? That informs how much negotiation room exists.
- Schools are D-rated, which usually means shorter tenancies and higher turnover. Who's the typical renter profile here, and what's been the actual vacancy rate?
- What's the average days-on-market for RENTAL listings here right now (not sales)? A rising rental-DOM trend means longer vacancies and softer asking-rent achievability than the comps imply.
- What's the recent tenant-quality profile in this submarket — average credit score on applications, eviction rate, late-payment / NSF rate, and stable-employment percentage? A property-management company in the area should have these aggregated.
- How much new for-sale + rental construction is in the pipeline within 1–3 miles? Heavy new supply typically softens prices + rents 12–24 months out; constrained supply supports both.
Investment metrics
- 1% rule
- 1.13% ✓
- Cap rate
- 9.81%
- Cash-on-cash
- 12.57%
- DSCR
- 1.56
- GRM
- 7.4
CMA / ARV
- ARV (on-the-fly)
- $73,704
- Comps found
- 5
Show comp detail 5 sales within ~0.75 mi
| Address | Dist | Beds/Ba | Sqft | Sold | Price | $/sf | Match |
|---|---|---|---|---|---|---|---|
| 614 Saint Bernard St | 0.00mi | 2/1.0 | 888 (0%) | 1mo | $74,000 | $83 | 100 |
| 609 Langley Ave | 0.16mi | 2/1.0 | 783 (-12%) | 14mo | $67,500 | $86 | 61 |
| 201 S Willow St | 0.54mi | 2/2.0 | 875 (-2%) | 10mo | $100,000 | $114 | 60 |
| 217 N Green St | 0.45mi | 2/1.0 | 884 (-0%) | 23mo | $30,000 | $34 | 59 |
| 111 Vaughn St | 0.51mi | 1/1.0 (-1) | 979 (+10%) | 15mo | $14,800 | $15 | 42 |
Match score weights: distance 35% · size 25% · config 20% · recency 20%. Top-matched comps best support the ARV.
Projected returns pro-forma
5.4% appreciation · 3.0% rent growth · sell at horizon
- IRR
- 24.5%
- Equity multiple
- 2.57×
- Total profit
- $32,982
- Equity at exit
- $44,325
- IRR
- 23.5%
- Equity multiple
- 5.13×
- Total profit
- $86,788
- Equity at exit
- $78,051
Cash invested: $21,000 (down + closing). Projections, not guarantees.
Landlord ↔ Tenant lean methodology
- Overall (STATE)
- 83 Strongly Landlord-Friendly
- State Kentucky
- 83 Strongly Landlord-Friendly · R+16
- County
- — inherits STATE
- City
- — inherits STATE
ZIP-level market 42450
- Home prices YoY
- 2.3%
- Active inventory
- 22
- Price-to-rent
- 7.4×
Monthly cashflow live
- Estimated rent
- $849 medium interval (Pro) →
- Mortgage (P&I)
- −$393
- Tax from tax record
- −$26 /mo · $314/yr
- Insurance
- −$31
- HOA
- −$0
- Vacancy / Maint / Mgmt
- −$178
- Net cashflow
- $220
Break-even live
Sensitivity live
| Price | -10% $262 | -5% $241 | +0% $220 | +5% $199 | +10% $178 |
|---|---|---|---|---|---|
| Rent | -10% $153 | -5% $186 | +0% $220 | +5% $254 | +10% $287 |
| Rate | -1.0pp $258 | -0.5pp $239 | base $220 | +0.5pp $201 | +1.0pp $181 |
UW: 25.0% down · 7.5% · 30yr · 1.5% tax · 5.0% vac · 8.0% maint · 8.0% mgmt
Financing live
Cash to close
- Down payment
- $18,750
- Closing costs
- $2,250
- Reserves months
- —
- Total cash needed
- —
Loan-product check · same deal, 3 products live
Conventional
25% down · 7.5% · 30yr
- Down + closing
- —
- Monthly P&I
- —
- Monthly cashflow
- —
- DSCR
- —
- Eligible?
- —
Personal DTI + credit; lowest rate.
DSCR
20% down · 8.5% · 30yr
- Down + closing
- —
- Monthly P&I
- —
- Monthly cashflow
- —
- DSCR
- —
- Eligible?
- —
No personal income docs; deal must DSCR.
Hard money
10% down · 12.0% · 12mo
- Down + closing
- —
- Monthly P&I
- —
- Monthly cashflow
- —
- DSCR
- —
- Eligible?
- —
Short-term bridge; refi at stabilization.
Listing history 7 events
-
2026-04-30status Pending
-
2026-03-19status Active
-
2026-03-13status Pending
-
2026-03-12$75,000 Active
-
2021-11-19soldstatus $21,000
-
2008-09-12soldstatus $35,000
-
1998-07-01soldstatus $21,500
ⓘ Source: listings_history table (triggers on properties + properties_extension) + one-shot
backfill from property_details.listing_events for pre-trigger history.
Tax reassessment forecast KY · Resets to sale price
- Current annual tax
- $314 · $26/mo
- Projected year-2 tax
- $645 · $54/mo
- Expected delta
- +$331/yr (+$28/mo · 105.3%)
ⓘ Screening estimate from a state-policy table — verify with the county assessor before closing.
Climate risk First Street
- Flood 1/10 Low FEMA zone X (unshaded) · 0% chance over 30 yrs
- Wildfire 4/10 Moderate
- Heat 5/10 Major 7 d/yr ≥109°F today · 19 d/yr by 30 yrs out
- Wind 3/10 Moderate 5% chance of damaging wind over 30 yrs
- Air quality 2/10 Low 1 unhealthy d/yr today · 1 by 30 yrs out
Nearby sold comps map
Loading sold comps map…
Walkable amenities ~0.75 mi
Loading nearby amenities…
Taxation est. · year 1
- Rental income
- $10,188
- − Mortgage interest
- −$4,201
- − Property taxes
- −$314
- − Insurance
- −$375
- − Repairs & maintenance
- −$815
- − Management
- −$815
- − Depreciation
- −$2,182
- Taxable income
- $1,486
- Est. tax owed @ 24.0%
- −$357
- After-tax cash flow
- $2,283/yr
For passive investors: Depreciation is non-cash, so a rental often shows a tax loss while cash-flowing — sheltering income. Rental losses are passive: they offset passive income freely, and up to $25,000/yr can offset ordinary (W-2) income if you actively participate and your MAGI is under $100k (phasing out to $0 by $150k); unused losses carry forward. On sale, claimed depreciation is recaptured at up to 25%, and gains may owe capital-gains tax (a 1031 exchange can defer both). Figures are a year-1 estimate at your 24.0% rate — not tax advice; consult a CPA.
Schools (NCES district)
- District
- Webster County
- NCES district ID
- 2105820
- Math proficiency
- 25% ▼ -17.00%
- Reading proficiency
- 34% ▼ -16.00%
- Median HH income
- $39,542
- Composite
- 24.76/100
- National rank
- #7600
- State rank
- #114 of 165 in KY
Livability — Providence
- Score
- 62/100
- State rank
- #352
- US rank
- #16669
Category grades
Schools grade is shown separately in the Schools card above.
Census & demographics
- Census place
- Providence, KY
- Population (ZIP)
- 3,589
Population outlook (Webster County) Hauer SSP2
- Today (2025)
- 12,548 people
- By 2030
- 12,119 · -3.4%
- By 2040
- 11,345 · -9.6%
- By 2050
- 10,761 · -14.2%
- By 2075
- 10,166 · -19.0%
- By 2100
- 10,546 · -16.0%
Race, ethnicity, and origin ACS 2023
- Neighborhood character
- Predominantly White (85%)
- Race & ethnicity
- White 85% Black 12% Two or more races 1%
- Common ancestry
- Italian 4% Iranian 1% Russian 1%
- Languages at home
- 99% English-only · Other Indo-European 1%
Political lean MEDSL · Webster
- 2024 margin
- Solid R (+57.4) · D 20.8% · R 78.1% · Other 1.1%
- 2008→2024 swing
- -45.7pp toward R · 2008: -11.7pp · 2024: -57.4pp
- All cycles
- 2024: R+57.4 2020: R+51.6 2016: R+54.4 2012: R+33.7 2008: R+11.7
Not yet ingested
- Civics
- —
Market trends
- HPI YoY
- ▲ 5.40%
- Current HPI
- 240.0686
- Rent YoY
- —
- Metro
- —
- State GDP YoY
- ▲ 1.81%
- F500 in state
- 4
Industry mix (Fortune 500 HQ in KY)
| Industry | F500 HQs | Revenue |
|---|---|---|
| Healthcare | 1 | $118B |
|
||
| Food / Beverage | 1 | $7B |
|
||
Price history
+248.8% since first listed7 events — show timeline
- 2026-04-30 Pending — MHCBOR
- 2026-03-19 Relisted — MHCBOR
- 2026-03-13 Pending — MHCBOR
- 2026-03-12 Listed $75,000 MHCBOR
- 2021-11-19 Sold (Public Records) $21,000 Public Records
- 2008-09-12 Sold (Public Records) $35,000 Public Records
- 1998-07-01 Sold (Public Records) $21,500 Public Records
Property tax history
-3.4%/yrLatest (2025): $314 · +10.7% YoY. Source: county tax records.
Cash-flow waterfall
monthlySold comps — $/sqft
last 12 mo · ≤1 miLoading sold comps…