None · Bushnell, FL
Flood risk 6/10 · Moderate
- FEMA flood zone
- X (unshaded)
- Chance of flooding over 30 yrs
- 0.72%
- Est. flood insurance / yr
- $507 – $1,088
Fire risk 5/10 · Moderate
- Est. fire insurance / yr
- $947 – $1,759
Heat risk 8/10 · Major
- Hot days now (above 108°F)
- 7 days/yr
- Hot days in 30 yrs
- 23 days/yr
Wind risk 9/10 · Severe
- Chance of severe wind over 30 yrs
- 99.0%
Air-quality risk 1/10 · Minimal
- Unhealthy air days now
- 0 days/yr
- Unhealthy air days in 30 yrs
- 0 days/yr
Risk factors via First Street. Map © Google.
Why this score? — see what drove the B+ grade
The composite is a weighted blend of 9 inputs, each scored 0–100. Each bar is that input's sub-score; the figure is the points it added to the 100-point composite (weight × sub-score).
- Cash flow +26.2/30.0
- ARV discount +15.0/15.0
- Appreciation +10.0/10.0
- DSCR +8.9/10.0
- 1% rule +6.6/10.0
- Schools +5.2/10.0
- Livability +2.9/5.0
- Rent growth +2.5/5.0
- Condition / age +2.5/5.0
$159,000
🖨 Deal sheet 📄 Offer letter ✓ Due diligence
Listing remarks MLS
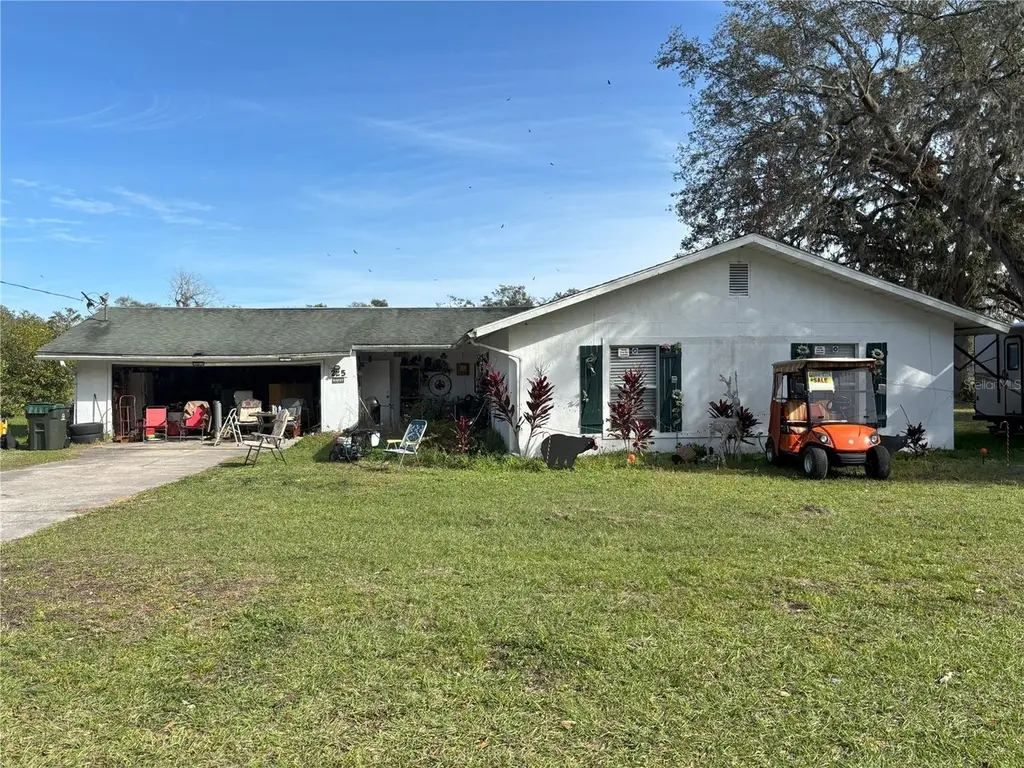
Not a short sale-response to offers usually w/ i 3 business days-can close in 30-45 days. Closing cost assistance may be available subject to seller approval & terms. This property is eligible under the Freddie Mac First Look Initiative through 03.06.2012. Great starter home, close to town, great price!
Key facts
- 0.29 acre lot
- 2 garage spots
- Built 1985
Property features AI
Finance
- Other: Property type: Residential (Single Family); Zoning: R; Lot size approximately 0.29 acres (about 1/4 to less than 1/2 acre)
- HOA & community: No HOA/association
Exterior
- Parking: Attached garage with 2 parking spaces
- Utilities: Public water; Public sewer; Cable available; Public utilities
- Home design: Single family residence; One level; Faces west
- Construction: Stucco exterior; Shingle roof; Block foundation; Built as residential construction
- Exterior features: Pond view with pond access; Paved, public-maintained road
Interior
- Kitchen: Range; Refrigerator
- Bedrooms: 3 bedrooms
- Flooring: Ceramic tile; Laminate
- Bathrooms: 2 full bathrooms
- Heating & cooling: Central heating; Central air conditioning
- Interior features: Ceiling fans
- Laundry & utility: Washer; Dryer; Laundry area in kitchen
Neighborhood map
What this means for you Summary
Snapshot
- This is a 3-bed/2.0-bath single-family listed at $159k.
Deal economics
- At list price, monthly cash flow is $408 ($5k/yr) — positive.
- The deal already cash-flows at list — no discount required.
- Meets the 1% rule at list price ($2k rent vs $159k).
- Recommended offer: $145k (9.0% below list) — sets the bar for market timing.
- Cap rate 9.4% vs local median 4.2% in Bushnell — top-decile yield for the area; either an underpriced asset or a hidden risk that comps aren't pricing in. Stress-test before assuming the spread holds.
Location & tenants
- Location reads 58/100 on livability (#835 in FL) — a working-class tenant base; expect higher turnover. Strengths: cost of living A+, housing A+, crime A-; Watch: health & safety C-, schools D+, amenities F.
- Sumter (rural): math 61% / reading 61% proficiency, ranked #11 of 73 in FL (top 15%) — acceptable for families but not a draw, mixed tenant base, ~2y average lease.
- Market conditions: 97 active listings in the ZIP; 3,961 units permitted in Sumter County in 2024 (248 in 5+ unit buildings).
Forward outlook
- In year one you build about $17k of equity ($1k loan paydown + $16k appreciation (10.0% local appreciation)).
- Sumter County population projected at +45% by 2050 — long-run rental-demand tailwind backs the buy-and-hold thesis.
- At projected returns (10.0% appreciation + 3.0% rent growth), your $45k cash investment doubles in ~2 years — after that, you're playing with house money.
- By year 3, paydown + projected appreciation supports a ~$43k cash-out refi (75% LTV) — recoverable capital for the next deal without selling this one.
Negotiation context
- It's been on market 93 days — a 9% lower offer ($145k) is reasonable based on typical stale-listing flexibility.
- 8 sale attempts since 22y ago; this cycle's ask has dropped $20k (11%) from the opening price — seller is motivated, your offer sets the floor, not the list.
- Current owner paid $59k; list at $159k implies a 170% gain — meaningful room to come down on a strong offer.
Risks & watch-outs
- Climate carrying-cost: major flood risk; severe wind risk, 99% chance of damaging wind over 30y; moderate wildfire risk; extreme-heat days projected 7→23/yr by 2055 (HVAC capex compounding) — expect insurance premiums to compound above CPI over the hold.
Questions for the listing agent
- It's been on market 93 days. Have you received any prior offers? Is the seller open to a 9% concession, seller financing, or rate buy-down credit?
- Why hasn't it sold? Are there any deal-killer items the seller is aware of (foundation, flood, title, zoning, code violations)?
- Is there a deadline driving the sale (1031 exchange, divorce, estate, relocation)? That informs how much negotiation room exists.
- Schools are D-rated, which usually means shorter tenancies and higher turnover. Who's the typical renter profile here, and what's been the actual vacancy rate?
- What's the average days-on-market for RENTAL listings here right now (not sales)? A rising rental-DOM trend means longer vacancies and softer asking-rent achievability than the comps imply.
- What's the recent tenant-quality profile in this submarket — average credit score on applications, eviction rate, late-payment / NSF rate, and stable-employment percentage? A property-management company in the area should have these aggregated.
- How much new for-sale + rental construction is in the pipeline within 1–3 miles? Heavy new supply typically softens prices + rents 12–24 months out; constrained supply supports both.
Investment metrics
- 1% rule
- 1.16% ✓
- Cap rate
- 9.37%
- Cash-on-cash
- 10.99%
- DSCR
- 1.49
- GRM
- 7.2
CMA / ARV
- ARV (on-the-fly)
- $248,094
- Comps found
- 10
Show comp detail 10 sales within ~0.75 mi
| Address | Dist | Beds/Ba | Sqft | Sold | Price | $/sf | Match |
|---|---|---|---|---|---|---|---|
| 123 W Dade Ave | 0.41mi | 3/2.0 | 1,351 (-2%) | 5mo | $195,000 | $144 | 72 |
| 309 N Westwood St | 0.20mi | 3/2.0 | 1,248 (-10%) | 2mo | $285,000 | $228 | 72 |
| 311 W Central Ave | 0.29mi | 3/2.0 | 1,232 (-11%) | 3mo | $210,000 | $170 | 65 |
| 403 W Palm Ave | 0.41mi | 3/2.0 | 1,482 (+7%) | 6mo | $265,000 | $179 | 65 |
| 324 N York St | 0.18mi | 3/2.0 | 1,183 (-15%) | 14mo | $225,000 | $190 | 56 |
| 1314 SW 68th Ave | 0.60mi | 3/2.0 | 1,200 (-13%) | 3mo | $255,000 | $213 | 47 |
| 119 W Noble Ave | 0.41mi | 3/1.0 | 1,254 (-10%) | 19mo | $190,000 | $152 | 45 |
| 1355 CR 604 | 0.71mi | 3/1.0 | 1,180 (-15%) | 1mo | $189,000 | $160 | 37 |
| 1423 CR 604 | 0.75mi | 3/2.0 | 1,475 (+6%) | 22mo | $260,000 | $176 | 36 |
| 409 Jumper Dr S | 0.75mi | 2/2.0 (-1) | 1,523 (+10%) | 12mo | $310,000 | $204 | 34 |
Match score weights: distance 35% · size 25% · config 20% · recency 20%. Top-matched comps best support the ARV.
Projected returns pro-forma
10.0% appreciation · 3.0% rent growth · sell at horizon
- IRR
- 32.3%
- Equity multiple
- 3.53×
- Total profit
- $112,560
- Equity at exit
- $143,240
- IRR
- 27.9%
- Equity multiple
- 7.99×
- Total profit
- $311,039
- Equity at exit
- $308,902
Cash invested: $44,520 (down + closing). Projections, not guarantees.
Landlord ↔ Tenant lean methodology
- Overall (STATE)
- 87 Strongly Landlord-Friendly
- State Florida
- 87 Strongly Landlord-Friendly · R+3
- County
- — inherits STATE
- City
- — inherits STATE
ZIP-level market 33513
- Home prices YoY
- 12.8%
- Active inventory
- 97
- Price-to-rent
- 7.2×
Monthly cashflow live
- Estimated rent
- $1,840 medium interval (Pro) →
- Mortgage (P&I)
- −$834
- Tax from tax record
- −$146 /mo · $1,752/yr
- Insurance
- −$66
- HOA
- −$0
- Vacancy / Maint / Mgmt
- −$386
- Net cashflow
- $408
Break-even live
UW: 25.0% down · 7.5% · 30yr · 1.5% tax · 5.0% vac · 8.0% maint · 8.0% mgmt
Financing live
Cash to close
- Down payment
- $39,750
- Closing costs
- $4,770
- Reserves months
- —
- Total cash needed
- —
Loan-product check · same deal, 3 products live
Conventional
25% down · 7.5% · 30yr
- Down + closing
- —
- Monthly P&I
- —
- Monthly cashflow
- —
- DSCR
- —
- Eligible?
- —
Personal DTI + credit; lowest rate.
DSCR
20% down · 8.5% · 30yr
- Down + closing
- —
- Monthly P&I
- —
- Monthly cashflow
- —
- DSCR
- —
- Eligible?
- —
No personal income docs; deal must DSCR.
Hard money
10% down · 12.0% · 12mo
- Down + closing
- —
- Monthly P&I
- —
- Monthly cashflow
- —
- DSCR
- —
- Eligible?
- —
Short-term bridge; refi at stabilization.
Listing history 35 events
-
2026-06-19days on market $159,000 Active 93 DOM
-
2026-06-18days on market $159,000 Active 92 DOM
-
2026-06-17days on market $159,000 Active 91 DOM
-
2026-06-16days on market $159,000 Active 90 DOM
-
2026-06-15days on market $159,000 Active 89 DOM
-
2026-06-14days on market $159,000 Active 87 DOM
-
2026-06-13days on market $159,000 Active 86 DOM
-
2026-06-10days on market $159,000 Active 84 DOM
-
2026-06-09days on market $159,000 Active 83 DOM
-
2026-06-08days on market $159,000 Active 82 DOM
-
2026-06-07remarks 243-char remark
-
2026-06-07pricedays on market $159,000 Active 81 DOM
-
2026-06-02days on market $179,000 Active 76 DOM
-
2026-06-01days on market $179,000 Active 75 DOM
-
2026-05-31days on market $179,000 Active 74 DOM
-
2026-05-30days on market $179,000 Active 73 DOM
-
2026-03-18$179,000 Active
-
2025-07-18historical
-
2025-03-08price $199,900
-
2025-01-18$239,000 Active
-
2012-03-29soldstatus $58,900 310-char remark
Show marketing remark (310 chars)
Not a short sale-response to offers usually w/ i 3 business days-can close in 30-45 days. Closing cost assistance may be available subject to seller approval & terms. This property is eligible under the Freddie Mac First Look Initiative through 03.06.2012. Great starter home, close to town, great price!
-
2012-02-21$58,900 310-char remark
Show marketing remark (310 chars)
Not a short sale-response to offers usually w/ i 3 business days-can close in 30-45 days. Closing cost assistance may be available subject to seller approval & terms. This property is eligible under the Freddie Mac First Look Initiative through 03.06.2012. Great starter home, close to town, great price!
-
2012-01-03historical
-
2011-08-04$54,900
-
2011-08-03historical
-
2011-08-03historical
-
2009-09-21historical
-
2009-09-21$67,900
-
2009-09-15$67,900
-
2009-01-24$162,000
-
2005-05-17soldstatus $123,000
-
2005-05-09soldstatus $145,000
-
2004-12-16$145,000
-
1988-10-01soldstatus $49,100
-
1986-07-01soldstatus $47,500
ⓘ Source: listings_history table (triggers on properties + properties_extension) + one-shot
backfill from property_details.listing_events for pre-trigger history.
Tax reassessment forecast FL · Resets to sale price
- Current annual tax
- $1,752 · $146/mo
- Projected year-2 tax
- $1,752 · $146/mo
- Expected delta
- $0/yr ($0/mo · 0.0%)
ⓘ Screening estimate from a state-policy table — verify with the county assessor before closing.
Climate risk First Street
- Flood 6/10 Major FEMA zone X (unshaded) · 72% chance over 30 yrs
- Wildfire 5/10 Major
- Heat 8/10 Severe 7 d/yr ≥108°F today · 23 d/yr by 30 yrs out
- Wind 9/10 Extreme 99% chance of damaging wind over 30 yrs
- Air quality 1/10 Low 0 unhealthy d/yr today · 0 by 30 yrs out
Nearby sold comps map
Loading sold comps map…
Walkable amenities ~0.75 mi
Loading nearby amenities…
Taxation est. · year 1
- Rental income
- $22,083
- − Mortgage interest
- −$8,906
- − Property taxes
- −$1,752
- − Insurance
- −$795
- − Repairs & maintenance
- −$1,767
- − Management
- −$1,767
- − Depreciation
- −$4,625
- Taxable income
- $2,471
- Est. tax owed @ 24.0%
- −$593
- After-tax cash flow
- $4,300/yr
For passive investors: Depreciation is non-cash, so a rental often shows a tax loss while cash-flowing — sheltering income. Rental losses are passive: they offset passive income freely, and up to $25,000/yr can offset ordinary (W-2) income if you actively participate and your MAGI is under $100k (phasing out to $0 by $150k); unused losses carry forward. On sale, claimed depreciation is recaptured at up to 25%, and gains may owe capital-gains tax (a 1031 exchange can defer both). Figures are a year-1 estimate at your 24.0% rate — not tax advice; consult a CPA.
Schools (NCES district)
- District
- Sumter
- NCES district ID
- 1201800
- Math proficiency
- 61% ▼ -4.00%
- Reading proficiency
- 61% ▼ -2.00%
- Median HH income
- $48,240
- Composite
- 51.74/100
- National rank
- #1682
- State rank
- #11 of 73 in FL
Livability — Bushnell
- Score
- 58/100
- State rank
- #835
- US rank
- #20676
Category grades
Schools grade is shown separately in the Schools card above.
Census & demographics
- Census place
- Bushnell, FL
- Population (ZIP)
- 13,647
Population outlook (Sumter County) Hauer SSP2
- Today (2025)
- 161,172 people
- By 2030
- 180,083 · +11.7%
- By 2040
- 209,892 · +30.2%
- By 2050
- 234,186 · +45.3%
- By 2075
- 284,602 · +76.6%
- By 2100
- 317,039 · +96.7%
Race, ethnicity, and origin ACS 2023
- Neighborhood character
- Predominantly White (74%)
- Race & ethnicity
- White 74% Black 11% Hispanic / Latino 10% Two or more races 4% Asian 1%
- Hispanic origin (detail)
- Mexican 4% Puerto Rican 3%
- Common ancestry
- Lithuanian 3% Serbian 3% Iranian 1%
- Foreign-born
- 2% · Canada, China
- Languages at home
- 92% English-only · Spanish 6% Chinese 1%
Political lean MEDSL · Sumter
- 2024 margin
- Solid R (+37.6) · D 30.9% · R 68.6%
- 2008→2024 swing
- -10.6pp toward R · 2008: -27.0pp · 2024: -37.6pp
- All cycles
- 2024: R+37.6 2020: R+36.1 2016: R+39.2 2012: R+34.9 2008: R+27.0
Not yet ingested
- Civics
- —
Market trends
- HPI YoY
- ▲ 40.29%
- Current HPI
- 354.5531
- Rent YoY
- —
- Metro
- —
- State GDP YoY
- ▲ 3.28%
- F500 in state
- 36
Industry mix (Fortune 500 HQ in FL)
| Industry | F500 HQs | Revenue |
|---|---|---|
| Industrial Technology | 2 | $29B |
|
||
| Insurance | 2 | $17B |
|
||
| Retail | 1 | $60B |
|
||
| Technology Distribution | 1 | $58B |
|
||
| Homebuilding | 1 | $35B |
|
||
| Technology Manufacturing | 1 | $35B |
|
||
Price history
+276.8% since first listed19 events — show timeline
- 2026-03-18 Listed $179,000 Stellar MLS as Distributed by MLS Grid
- 2025-07-18 Listing Removed — Stellar MLS as Distributed by MLS Grid
- 2025-03-08 Price Changed $199,900 Stellar MLS as Distributed by MLS Grid
- 2025-01-18 Listed $239,000 Stellar MLS as Distributed by MLS Grid
- 2012-03-29 Sold (MLS) $58,900 Stellar MLS as Distributed by MLS Grid
- 2012-02-21 Listed $58,900 Stellar MLS as Distributed by MLS Grid
- 2012-01-03 Listing Removed — Stellar MLS as Distributed by MLS Grid
- 2011-08-04 Listed $54,900 Stellar MLS as Distributed by MLS Grid
- 2011-08-03 Listing Removed — Stellar MLS as Distributed by MLS Grid
- 2011-08-03 Listing Removed — Stellar MLS as Distributed by MLS Grid
- 2009-09-21 Listed $67,900 Stellar MLS as Distributed by MLS Grid
- 2009-09-21 Listing Removed — Stellar MLS as Distributed by MLS Grid
- 2009-09-15 Listed $67,900 Stellar MLS as Distributed by MLS Grid
- 2009-01-24 Listed $162,000 Stellar MLS as Distributed by MLS Grid
- 2005-05-17 Sold (Public Records) $123,000 Public Records
- 2005-05-09 Sold (MLS) $145,000 Stellar MLS as Distributed by MLS Grid
- 2004-12-16 Listed $145,000 Stellar MLS as Distributed by MLS Grid
- 1988-10-01 Sold (Public Records) $49,100 Public Records
- 1986-07-01 Sold (Public Records) $47,500 Public Records
Property tax history
+2.9%/yrLatest (2025): $1,752 · +2.4% YoY. Source: county tax records.
Cash-flow waterfall
monthlySold comps — $/sqft
last 12 mo · ≤1 miLoading sold comps…