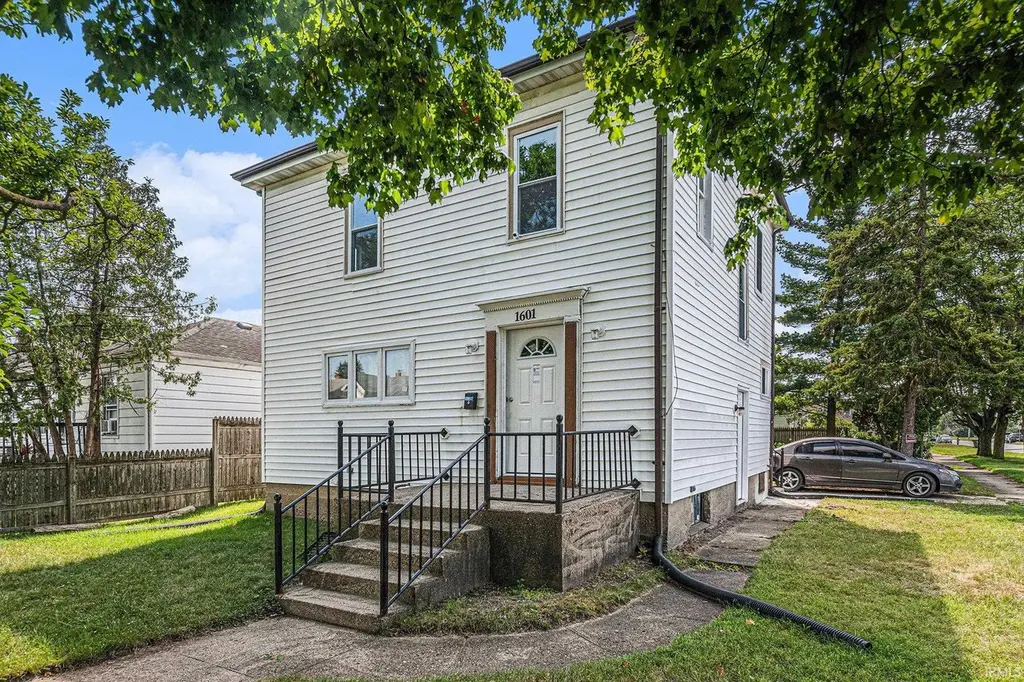
1601 Magnolia St · South Bend, IN
Flood risk 4/10 · Minor
- FEMA flood zone
- X (unshaded)
- Chance of flooding over 30 yrs
- 0.2%
- Est. flood insurance / yr
- $473 – $860
Fire risk 1/10 · Minimal
- Est. fire insurance / yr
- $717 – $1,331
Heat risk 3/10 · Minor
- Hot days now (above 99°F)
- 7 days/yr
- Hot days in 30 yrs
- 16 days/yr
Wind risk 2/10 · Minimal
- Chance of severe wind over 30 yrs
- —
Air-quality risk 3/10 · Minor
- Unhealthy air days now
- 3 days/yr
- Unhealthy air days in 30 yrs
- 3 days/yr
Risk factors via First Street. Map © Google.
Why this score? — see what drove the F grade
The composite is a weighted blend of 9 inputs, each scored 0–100. Each bar is that input's sub-score; the figure is the points it added to the 100-point composite (weight × sub-score).
- Cash flow +14.6/30.0
- DSCR +4.5/10.0
- 1% rule +4.0/10.0
- Rent growth +3.5/5.0
- Livability +3.2/5.0
- Condition / age +2.5/5.0
- Schools +1.4/10.0
- ARV discount +0.0/15.0
- Appreciation +0.0/10.0
$145,000
🖨 Deal sheet 📄 Offer letter ✓ Due diligence
Listing remarks MLS
Property is insurable. Property is insurable- repair escrow $2585.00 Include, all HUD-acquired properties are sold "AS-IS", and Agents with active NAID#s can submit offers at www. HUDHOMESTORE.com. HUD case #151-624719. Equal Housing Opportunity.
Key facts
- Formal dining room
- Access to the garage
- Open living area
Tags
Property features AI
Finance
- Other: Property listed by Century 21 Circle
Exterior
- Parking: Attached garage (1 car); Concrete driveway/parking; Off-street parking
- Utilities: Public water; Public sewer
- Home design: Single-family residence, site-built; 2 stories
- Construction: Vinyl siding; Block foundation; Asphalt roof; Built as site-built home
- Exterior features: Deck; Corner lot
Interior
- Kitchen: Gas cooktop; Gas range; Refrigerator
- Bedrooms: Total of 6 rooms (bedroom count not specified)
- Flooring: Vinyl
- Bathrooms: 1 full bathroom
- Heating & cooling: Natural gas heating; No cooling
- Interior features: Laminate counters; Full basement
- Laundry & utility: Washer; Dryer; Laundry located in basement; Gas water heater
Neighborhood map
What this means for you Summary
Snapshot
- This is a 3-bed/1.0-bath single-family listed at $145k.
Deal economics
- At list price, monthly cash flow is $35 ($421/yr) — positive.
- The deal already cash-flows at list — no discount required.
- To meet the 1% rule (rent ≥ 1% of price), the offer needs to be $130k (10.2% below list).
- Recommended offer: $130k (10.2% below list) — sets the bar for 1% rule.
- Cap rate 6.6% vs local median 4.4% in South Bend — top-decile yield for the area; either an underpriced asset or a hidden risk that comps aren't pricing in. Stress-test before assuming the spread holds.
Location & tenants
- Location reads 64/100 on livability (#365 in IN) — a middle-class / working-renter tenant base. Strengths: cost of living A+, housing A+, health & safety A+; Watch: amenities D, employment D, crime F.
- South Bend Community School Corporation (urban): math 12% / reading 21% proficiency, ranked #284 of 301 in IN (top 94%) — low school quality limits family demand, transient renter base, plan for 1-2y turnover; 66% free/reduced lunch — lower-income household profile, screen leases tightly.
- Zoned schools: Monroe Elementary School (math 8% / reading 2%, grade F, #970 of 994 statewide, top 99%, 418 students, 90% FRL); Jackson Middle School (math 3% / reading 8%, grade F, #326 of 330 statewide, top 99%, 528 students, 82% FRL); Riley High School (math 19% / reading 46%, grade F, #293 of 369 statewide, top 80%, 992 students, 67% FRL).
- Market conditions: Rents rising fast (+4.1%/yr); 77 active listings in the ZIP; 15 comparable units currently listed for rent nearby; rentals at typical pace (median 21d on market — plan ~3-4 weeks tenant-placement turnaround); lower-income renter base — watch delinquency; 754 units permitted in St. Joseph County in 2024 (460 in 5+ unit buildings).
- This rent runs 37% of the median local income ($43k/yr) — at the standard rent-burdened threshold; future hikes will face affordability resistance.
Forward outlook
- Local home prices are declining (-3.0%/yr); year-one equity from $1k of loan paydown is wiped out by about $4k of value loss. Plan a longer hold.
Negotiation context
- It's been on market 89 days — a 6% lower offer ($136k) is reasonable based on typical stale-listing flexibility.
- 5 sale attempts since 11y ago; this cycle's ask has dropped $10k (6%) from the opening price — seller is motivated, your offer sets the floor, not the list.
- Current owner paid $8k; list at $145k implies a 1695% gain — meaningful room to come down on a strong offer.
Risks & watch-outs
- Watch-outs: built in 1941 — expect roof / HVAC / electrical / plumbing capex.
Questions for the listing agent
- It's been on market 89 days. Have you received any prior offers? Is the seller open to a 10% concession, seller financing, or rate buy-down credit?
- Built in 1941 — when were the roof, HVAC, electrical panel, plumbing, and water heater last replaced?
- Why hasn't it sold? Are there any deal-killer items the seller is aware of (foundation, flood, title, zoning, code violations)?
- Is there a deadline driving the sale (1031 exchange, divorce, estate, relocation)? That informs how much negotiation room exists.
- Schools are F-rated, which usually means shorter tenancies and higher turnover. Who's the typical renter profile here, and what's been the actual vacancy rate?
- Crime grade is F in this area — have there been break-ins, vandalism, or insurance claims at this property in the last 3 years? What carrier currently insures it and at what premium?
- The area grade is low — what's the realistic commute time and amenity access for the typical tenant pool here? Any planned neighborhood developments (good or bad) we should know about?
- What's the average days-on-market for RENTAL listings here right now (not sales)? A rising rental-DOM trend means longer vacancies and softer asking-rent achievability than the comps imply.
- What's the recent tenant-quality profile in this submarket — average credit score on applications, eviction rate, late-payment / NSF rate, and stable-employment percentage? A property-management company in the area should have these aggregated.
- How much new for-sale + rental construction is in the pipeline within 1–3 miles? Heavy new supply typically softens prices + rents 12–24 months out; constrained supply supports both.
Investment metrics
- 1% rule
- 0.90% ✗
- Cap rate
- 6.58%
- Cash-on-cash
- 1.04%
- DSCR
- 1.05
- GRM
- 9.3
CMA / ARV
- ARV (on-the-fly)
- $123,264
- Comps found
- 12
Show comp detail 12 sales within ~0.75 mi
| Address | Dist | Beds/Ba | Sqft | Sold | Price | $/sf | Match |
|---|---|---|---|---|---|---|---|
| 1413 W Indiana Ave | 0.13mi | 3/1.0 | 1,030 (-11%) | 5mo | $115,500 | $112 | 72 |
| 1778 Prairie Ave | 0.23mi | 2/1.0 (-1) | 1,122 (-3%) | 9mo | $37,500 | $33 | 72 |
| 1819 Magnolia St | 0.17mi | 3/1.0 | 1,284 (+12%) | 1mo | $164,900 | $128 | 72 |
| 1701 Nash St | 0.12mi | 3/1.0 | 1,272 (+10%) | 7mo | $165,000 | $130 | 71 |
| 712 W Calvert St | 0.73mi | 3/1.0 | 1,152 (0%) | 1mo | $154,000 | $134 | 65 |
| 1919 S Carlisle St | 0.50mi | 2/1.0 (-1) | 1,105 (-4%) | 0mo | $80,000 | $72 | 65 |
| 827 Kosciuszko St | 0.60mi | 3/2.0 | 1,224 (+6%) | 9mo | $85,000 | $69 | 50 |
| 2009 Catalpa St | 0.61mi | 3/1.5 | 1,272 (+10%) | 5mo | $52,500 | $41 | 48 |
| 1530 Fisher St | 0.60mi | 3/1.0 | 984 (-15%) | 1mo | $105,000 | $107 | 47 |
| 827 S Brookfield St | 0.67mi | 3/1.0 | 1,000 (-13%) | 2mo | $79,999 | $80 | 45 |
| 2124 Kemble Ave | 0.63mi | 2/1.5 (-1) | 1,248 (+8%) | 8mo | $158,000 | $127 | 43 |
| 811 Pulaski St | 0.64mi | 2/1.0 (-1) | 1,032 (-10%) | 7mo | $52,525 | $51 | 42 |
Match score weights: distance 35% · size 25% · config 20% · recency 20%. Top-matched comps best support the ARV.
Projected returns pro-forma
-3.0% appreciation · 4.08% rent growth · sell at horizon
- IRR
- -13.4%
- Equity multiple
- 0.51×
- Total profit
- $-19,820
- Equity at exit
- $21,620
- IRR
- -2.9%
- Equity multiple
- 0.79×
- Total profit
- $-8,332
- Equity at exit
- $12,537
Cash invested: $40,600 (down + closing). Projections, not guarantees.
Landlord ↔ Tenant lean methodology
- Overall (STATE)
- 90 Strongly Landlord-Friendly
- State Indiana
- 90 Strongly Landlord-Friendly · R+11
- County
- — inherits STATE
- City
- — inherits STATE
ZIP-level market 46613
- Home prices YoY
- -7.2%
- Rents YoY
- 4.1%
- Active inventory
- 77
- Price-to-rent
- 9.3×
Monthly cashflow live
- Estimated rent
- $1,301 high interval (Pro) →
- Mortgage (P&I)
- −$760
- Tax from tax record
- −$172 /mo · $2,067/yr
- Insurance
- −$60
- HOA
- −$0
- Vacancy / Maint / Mgmt
- −$273
- Net cashflow
- $35
Break-even live
UW: 25.0% down · 7.5% · 30yr · 1.5% tax · 5.0% vac · 8.0% maint · 8.0% mgmt
Financing live
Cash to close
- Down payment
- $36,250
- Closing costs
- $4,350
- Reserves months
- —
- Total cash needed
- —
Loan-product check · same deal, 3 products live
Conventional
25% down · 7.5% · 30yr
- Down + closing
- —
- Monthly P&I
- —
- Monthly cashflow
- —
- DSCR
- —
- Eligible?
- —
Personal DTI + credit; lowest rate.
DSCR
20% down · 8.5% · 30yr
- Down + closing
- —
- Monthly P&I
- —
- Monthly cashflow
- —
- DSCR
- —
- Eligible?
- —
No personal income docs; deal must DSCR.
Hard money
10% down · 12.0% · 12mo
- Down + closing
- —
- Monthly P&I
- —
- Monthly cashflow
- —
- DSCR
- —
- Eligible?
- —
Short-term bridge; refi at stabilization.
Rent comps 15 comps
| Address | Beds | Baths | Sqft | Rent | $/sqft | DOM | Units | Dist |
|---|---|---|---|---|---|---|---|---|
| 1909 Swygart Ave South Bend, IN | 2.0 | 1.0 | 720 | $1,100 | $1.53 | 13d | 1 | 0.28mi |
| 1928 S Walnut St South Bend, IN | 2.0 | 1.0 | 700 | $1,150 | $1.64 | 44d | 1 | 0.30mi |
| 2002 Catalpa Ave South Bend, IN | 3.0 | 1.0 | 1424 | $1,250 | $0.88 | 21d | 1 | 0.63mi |
| 1317 Poland St South Bend, IN | 3.0 | 1.0 | 1100 | $1,300 | $1.18 | 21d | 1 | 0.76mi |
| 1920 S Scott St South Bend, IN | 2.0 | 1.0 | 816 | $1,000 | $1.23 | 13d | 1 | 0.79mi |
| 2102 S Scott St South Bend, IN | 3.0 | 1.0 | 768 | $1,250 | $1.63 | 44d | 1 | 0.82mi |
| 2502 Ford St South Bend, IN | 3.0 | 1.0 | 1176 | $1,175 | $1.00 | 44d | 1 | 0.98mi |
| 453 S Kaley St Unit 1 South Bend, IN | 2.0 | 1.0 | 1100 | $1,050 | $0.95 | 44d | 1 | 1.20mi |
| 3220 Vermont Pl South Bend, IN | 2.0 | 1.0 | 725 | $1,100 | $1.52 | 13d | 1 | 1.32mi |
| 202 E Calvert St South Bend, IN | 2.0 | 1.0 | 1000 | $999 | $1.00 | 21d | 1 | 1.32mi |
| 208 S Bendix Dr South Bend, IN | 3.0 | 1.0 | 864 | $1,150 | $1.33 | 21d | 1 | 1.42mi |
| 214 Altgeld St South Bend, IN | 2.0 | 1.0 | 950 | $1,200 | $1.26 | 21d | 1 | 1.43mi |
| 221 S Taylor St South Bend, IN | 3.0 | 2.0 | 1178 | $2,599 | $2.21 | 13d | 1 | 1.43mi |
| 317 E Indiana Ave South Bend, IN | 3.0 | 1.0 | 1344 | $1,200 | $0.89 | 21d | 1 | 1.43mi |
| 237 E Victoria St South Bend, IN | 3.0 | 1.0 | 840 | $995 | $1.18 | 44d | 1 | 1.48mi |
Listing history 26 events
-
2026-06-18days on market $145,000 Active 89 DOM
-
2026-06-17days on market $145,000 Active 88 DOM
-
2026-06-16days on market $145,000 Active 87 DOM
-
2026-06-15days on market $145,000 Active 86 DOM
-
2026-06-14days on market $145,000 Active 84 DOM
-
2026-06-13days on market $145,000 Active 83 DOM
-
2026-06-10days on market $145,000 Active 81 DOM
-
2026-06-09pricedays on market $145,000 Active 80 DOM
-
2026-06-08days on market $149,000 Active 79 DOM
-
2026-06-07days on market $149,000 Active 78 DOM
-
2026-06-03days on market $149,000 Active 74 DOM
-
2026-06-02days on market $149,000 Active 73 DOM
-
2026-06-01days on market $149,000 Active 72 DOM
-
2026-05-31days on market $149,000 Active 71 DOM
-
2026-05-30days on market $149,000 Active 70 DOM
-
2026-05-18status Active
-
2026-05-07status Pending
-
2026-05-07historical
-
2026-04-10status Pending
-
2026-03-03status Active
-
2025-12-08price $149,000
-
2025-09-22status Active
-
2025-08-18status Pending
-
2025-07-31$155,000 Active
-
2015-10-23soldstatus $8,077 256-char remark
Show marketing remark (256 chars)
Property is insurable. Property is insurable- repair escrow $2585.00 Include, all HUD-acquired properties are sold "AS-IS", and Agents with active NAID#s can submit offers at www. HUDHOMESTORE.com. HUD case #151-624719. Equal Housing Opportunity.
-
2015-06-25$8,000 256-char remark
Show marketing remark (256 chars)
Property is insurable. Property is insurable- repair escrow $2585.00 Include, all HUD-acquired properties are sold "AS-IS", and Agents with active NAID#s can submit offers at www. HUDHOMESTORE.com. HUD case #151-624719. Equal Housing Opportunity.
ⓘ Source: listings_history table (triggers on properties + properties_extension) + one-shot
backfill from property_details.listing_events for pre-trigger history.
Tax reassessment forecast IN · Partial reset (capped growth)
- Current annual tax
- $2,067 · $172/mo
- Projected year-2 tax
- $2,067 · $172/mo
- Expected delta
- $0/yr ($0/mo · 0.0%)
ⓘ Screening estimate from a state-policy table — verify with the county assessor before closing.
Climate risk First Street
- Flood 4/10 Moderate FEMA zone X (unshaded) · 20% chance over 30 yrs
- Wildfire 1/10 Low
- Heat 3/10 Moderate 7 d/yr ≥99°F today · 16 d/yr by 30 yrs out
- Wind 2/10 Low
- Air quality 3/10 Moderate 3 unhealthy d/yr today · 3 by 30 yrs out
Nearby sold comps map
Loading sold comps map…
Walkable amenities ~0.75 mi
Loading nearby amenities…
Taxation est. · year 1
- Rental income
- $15,617
- − Mortgage interest
- −$8,122
- − Property taxes
- −$2,067
- − Insurance
- −$725
- − Repairs & maintenance
- −$1,249
- − Management
- −$1,249
- − Depreciation
- −$4,218
- Taxable loss
- −$2,014
- Est. tax savings @ 24.0%
- +$483
- After-tax cash flow
- $904/yr
For passive investors: Depreciation is non-cash, so a rental often shows a tax loss while cash-flowing — sheltering income. Rental losses are passive: they offset passive income freely, and up to $25,000/yr can offset ordinary (W-2) income if you actively participate and your MAGI is under $100k (phasing out to $0 by $150k); unused losses carry forward. On sale, claimed depreciation is recaptured at up to 25%, and gains may owe capital-gains tax (a 1031 exchange can defer both). Figures are a year-1 estimate at your 24.0% rate — not tax advice; consult a CPA.
Schools (NCES district)
- District
- South Bend Community School Corporation
- NCES district ID
- 1810290
- Math proficiency
- 12% ▼ -10.00%
- Reading proficiency
- 21% ▼ -6.00%
- Median HH income
- $41,935
- Composite
- 14.21/100
- National rank
- #9452
- State rank
- #284 of 301 in IN
Livability — South Bend
- Score
- 64/100
- State rank
- #365
- US rank
- #13730
Category grades
Schools grade is shown separately in the Schools card above.
Census & demographics
- Census place
- South Bend, IN
- County
- Saint Joseph County · 189,048 people
- City population
- 99,767
- Metro
- South Bend-Mishawaka, IN-MI
- Population (ZIP)
- 12,279
- Household income
- $42,537
- Rent vs Own
- Severe rent burden
- 545.0
Population outlook (St. Joseph County) Hauer SSP2
- Today (2025)
- 273,186 people
- By 2030
- 273,594 · +0.1%
- By 2040
- 271,641 · -0.6%
- By 2050
- 269,187 · -1.5%
- By 2075
- 263,136 · -3.7%
- By 2100
- 245,659 · -10.1%
Race, ethnicity, and origin ACS 2023
- Neighborhood character
- Highly diverse neighborhood (Simpson 0.72)
- Race & ethnicity
- White 41% Hispanic / Latino 24% Black 23% Two or more races 22% Asian 2% Native American 1%
- Hispanic origin (detail)
- Mexican 22%
- Common ancestry
- Romanian 4% Italian 1% Slovak 1%
- Foreign-born
- 9% · Canada, Philippines
- Languages at home
- 81% English-only · Spanish 17% Other Asian/Pacific 1%
Political lean MEDSL · St. Joseph
- 2024 margin
- Toss-up / Even · D 50.0% · R 48.5% · Other 1.5%
- 2008→2024 swing
- -15.6pp toward R · 2008: 17.1pp · 2024: 1.5pp
- All cycles
- 2024: D+1.5 2020: D+5.8 2016: D+0.2 2012: D+3.5 2008: D+17.1
Not yet ingested
- Civics
- —
Market trends
- HPI YoY
- ▼ -20.88%
- Current HPI
- 270.0303
- Rent YoY
- ▲ 4.08%
- Metro
- South Bend-Mishawaka, IN-MI
- State GDP YoY
- ▲ 2.90%
- F500 in state
- 18
Industry mix (Fortune 500 HQ in IN)
| Industry | F500 HQs | Revenue |
|---|---|---|
| Industrial Machinery | 2 | $37B |
|
||
| Healthcare | 1 | $177B |
|
||
| Pharmaceuticals | 1 | $45B |
|
||
| Metals / Steel | 1 | $18B |
|
||
| Agriculture | 1 | $17B |
|
||
| Packaging | 1 | $12B |
|
||
Price history
+1762.5% since first listed11 events — show timeline
- 2026-05-18 Relisted — IRMLS
- 2026-05-07 Pending — IRMLS
- 2026-05-07 Delisted — IRMLS
- 2026-04-10 Pending — IRMLS
- 2026-03-03 Relisted — IRMLS
- 2025-12-08 Price Changed $149,000 IRMLS
- 2025-09-22 Relisted — IRMLS
- 2025-08-18 Pending — IRMLS
- 2025-07-31 Listed $155,000 IRMLS
- 2015-10-23 Sold (MLS) $8,077 IRMLS
- 2015-06-25 Listed $8,000 IRMLS
Property tax history
+14.9%/yrLatest (2023): $2,067 · +16.1% YoY. Source: county tax records.
Cash-flow waterfall
monthlySold comps — $/sqft
last 12 mo · ≤1 miLoading sold comps…