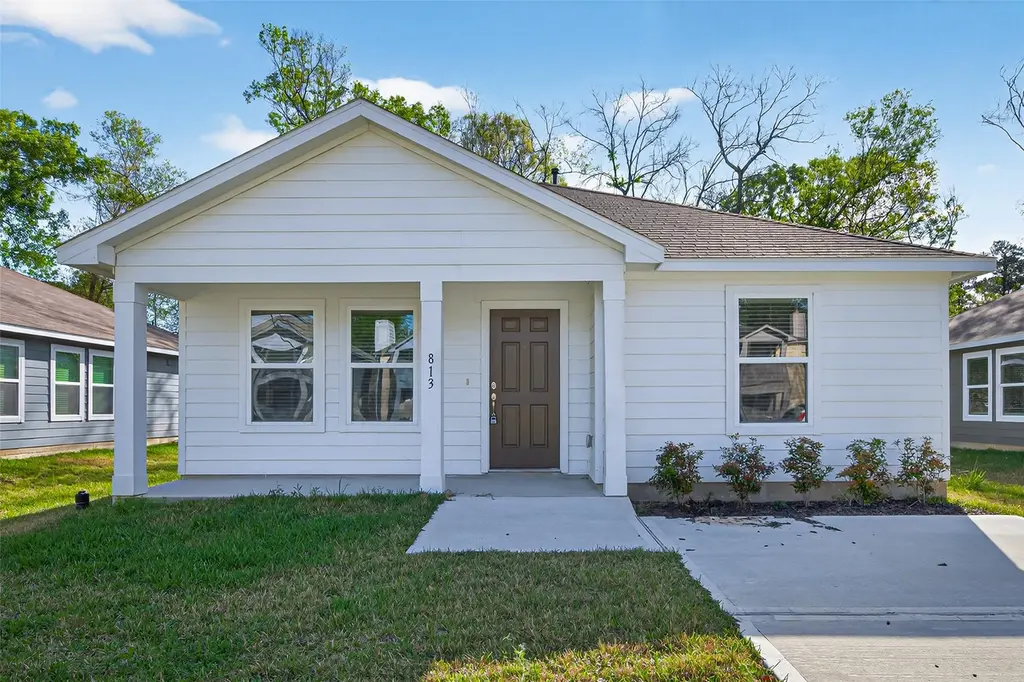
813 Jefferson Ave · Cleveland, TX
Flood risk No data
- FEMA flood zone
- —
- Chance of flooding over 30 yrs
- —
- Est. flood insurance / yr
- —
Fire risk No data
- Est. fire insurance / yr
- —
Heat risk No data
- Hot days now (above threshold)
- —
- Hot days in 30 yrs
- —
Wind risk No data
- Chance of severe wind over 30 yrs
- —
Air-quality risk No data
- Unhealthy air days now
- —
- Unhealthy air days in 30 yrs
- —
Risk factors via First Street. Map © Google.
Why this score? — see what drove the C- grade
The composite is a weighted blend of 9 inputs, each scored 0–100. Each bar is that input's sub-score; the figure is the points it added to the 100-point composite (weight × sub-score).
- ARV discount +15.0/15.0
- Cash flow +14.5/30.0
- 1% rule +4.9/10.0
- DSCR +4.4/10.0
- Condition / age +4.0/5.0
- Rent growth +3.5/5.0
- Livability +3.1/5.0
- Schools +2.1/10.0
- Appreciation +0.0/10.0
$175,000
🖨 Deal sheet 📄 Offer letter ✓ Due diligence
Listing remarks MLS
Welcome to 813 Jefferson Avenue in Cleveland! This charming craftsman style 1 story new build by Zion Homes features 3 bedrooms and 2 bathrooms. Thoughtfully designed with an open concept layout, the home offers a seamless flow between the living, dining and kitchen areas perfect for everyday living and entertaining. Conveniently located near schools and restaurants. Don't miss this opportunity to see this home, schedule your showing today!
Key facts
- Craftsman style
- Open concept layout
- Conveniently located
Tags
Neighborhood map
What this means for you Summary
Snapshot
- This is a 3-bed/3.0-bath single-family listed at $175k. Condition is rated good.
Deal economics
- At list price, monthly cash flow is $40 ($479/yr) — positive.
- The deal already cash-flows at list — no discount required.
- To meet the 1% rule (rent ≥ 1% of price), the offer needs to be $173k (1.3% below list).
- Recommended offer: $159k (9.0% below list) — sets the bar for market timing.
- Cap rate 6.6% vs local median 4.7% in Cleveland — top-decile yield for the area; either an underpriced asset or a hidden risk that comps aren't pricing in. Stress-test before assuming the spread holds.
Location & tenants
- Location reads 61/100 on livability (#1,013 in TX) — a middle-class / working-renter tenant base. Strengths: cost of living A+, housing A+; Watch: schools F, crime D-, amenities F.
- Cleveland ISD (town): math 24% / reading 25% proficiency, ranked #723 of 826 in TX (top 88%) — low school quality limits family demand, transient renter base, plan for 1-2y turnover; 71% free/reduced lunch — lower-income household profile, screen leases tightly.
- Market conditions: Rents rising fast (+4.0%/yr); 1574 active listings in the ZIP; 7 comparable units currently listed for rent nearby; rentals leasing fast (median 7d on market — plan ~1-2 weeks tenant-placement turnaround); 1,321 units permitted in Liberty County in 2024 (0 in 5+ unit buildings).
- This rent runs 33% of the median local income ($62k/yr) — at the standard rent-burdened threshold; future hikes will face affordability resistance.
Forward outlook
- Local home prices are declining (-3.0%/yr); year-one equity from $1k of loan paydown is wiped out by about $5k of value loss. Plan a longer hold.
- Liberty County population projected at +24% by 2050 — long-run rental-demand tailwind backs the buy-and-hold thesis.
Negotiation context
- It's been on market 92 days — a 9% lower offer ($159k) is reasonable based on typical stale-listing flexibility.
- 2 sale attempts since 7y ago with the ask held roughly flat each time — persistent listings suggest the price (not the market) is what's stuck; bring a comps-based counter.
Questions for the listing agent
- It's been on market 92 days. Have you received any prior offers? Is the seller open to a 9% concession, seller financing, or rate buy-down credit?
- Why hasn't it sold? Are there any deal-killer items the seller is aware of (foundation, flood, title, zoning, code violations)?
- Is there a deadline driving the sale (1031 exchange, divorce, estate, relocation)? That informs how much negotiation room exists.
- Schools are F-rated, which usually means shorter tenancies and higher turnover. Who's the typical renter profile here, and what's been the actual vacancy rate?
- Crime grade is D in this area — have there been break-ins, vandalism, or insurance claims at this property in the last 3 years? What carrier currently insures it and at what premium?
- What's the average days-on-market for RENTAL listings here right now (not sales)? A rising rental-DOM trend means longer vacancies and softer asking-rent achievability than the comps imply.
- What's the recent tenant-quality profile in this submarket — average credit score on applications, eviction rate, late-payment / NSF rate, and stable-employment percentage? A property-management company in the area should have these aggregated.
- How much new for-sale + rental construction is in the pipeline within 1–3 miles? Heavy new supply typically softens prices + rents 12–24 months out; constrained supply supports both.
Investment metrics
- 1% rule
- 0.99% ✗
- Cap rate
- 6.57%
- Cash-on-cash
- 0.98%
- DSCR
- 1.04
- GRM
- 8.4
CMA / ARV
- ARV (median comp)
- $233,180
- List price
- $175,000
- Delta
- -24.95%
- Verdict
- UNDERPRICED
- Comps
- 20 within 1.0 mi
Show comp detail 12 sales within ~0.75 mi
| Address | Dist | Beds/Ba | Sqft | Sold | Price | $/sf | Match |
|---|---|---|---|---|---|---|---|
| 803 Jefferson Ave | 0.05mi | 3/2.0 | 1,380 (-2%) | 0mo | $165,000 | $120 | 91 |
| 809 Jefferson Ave | 0.02mi | 3/2.0 | 1,380 (-2%) | 3mo | $175,000 | $127 | 90 |
| 807 Jefferson Ave | 0.03mi | 3/2.0 | 1,380 (-2%) | 3mo | $175,000 | $127 | 90 |
| 1204 Parkhurst Ave | 0.33mi | 3/2.0 | 1,373 (-2%) | 2mo | $196,880 | $143 | 76 |
| 908 Perry St | 0.48mi | 3/2.0 | 1,345 (-4%) | 10mo | $182,000 | $135 | 59 |
| 1002 Williams St | 0.39mi | 3/2.0 | 1,296 (-8%) | 10mo | $165,000 | $127 | 57 |
| 1105 S Fenner Ave | 0.56mi | 3/2.0 | 1,345 (-4%) | 8mo | $172,900 | $129 | 57 |
| 624 Truman St | 0.60mi | 3/2.0 | 1,361 (-3%) | 10mo | $174,900 | $129 | 56 |
| 1107 Fenner St | 0.56mi | 3/2.0 | 1,345 (-4%) | 10mo | $205,000 | $152 | 55 |
| 101 Ramey Ave | 0.74mi | 3/1.0 | 1,438 (+3%) | 10mo | $182,000 | $127 | 45 |
| 803 Hays St | 0.56mi | 3/2.0 | 1,200 (-14%) | 6mo | $125,000 | $104 | 41 |
| 605 Arvon St | 0.68mi | 2/1.0 (-1) | 1,260 (-10%) | 1mo | $82,200 | $65 | 38 |
Match score weights: distance 35% · size 25% · config 20% · recency 20%. Top-matched comps best support the ARV.
Projected returns pro-forma
-3.0% appreciation · 4.0% rent growth · sell at horizon
- IRR
- -13.5%
- Equity multiple
- 0.51×
- Total profit
- $-23,963
- Equity at exit
- $26,093
- IRR
- -2.8%
- Equity multiple
- 0.80×
- Total profit
- $-9,849
- Equity at exit
- $15,131
Cash invested: $49,000 (down + closing). Projections, not guarantees.
Landlord ↔ Tenant lean methodology
- Overall (STATE)
- 87 Strongly Landlord-Friendly
- State Texas
- 87 Strongly Landlord-Friendly · R+5
- County
- — inherits STATE
- City
- — inherits STATE
ZIP-level market 77327
- Home prices YoY
- -5.2%
- Rents YoY
- 4.0%
- Active inventory
- 1574
- Price-to-rent
- 8.4×
Monthly cashflow live
- Estimated rent
- $1,727 high interval (Pro) →
- Mortgage (P&I)
- −$918
- Tax from tax record
- −$334 /mo · $4,007/yr
- Insurance
- −$73
- HOA
- −$0
- Vacancy / Maint / Mgmt
- −$363
- Net cashflow
- $40
Break-even live
UW: 25.0% down · 7.5% · 30yr · 1.5% tax · 5.0% vac · 8.0% maint · 8.0% mgmt
Financing live
Cash to close
- Down payment
- $43,750
- Closing costs
- $5,250
- Reserves months
- —
- Total cash needed
- —
Loan-product check · same deal, 3 products live
Conventional
25% down · 7.5% · 30yr
- Down + closing
- —
- Monthly P&I
- —
- Monthly cashflow
- —
- DSCR
- —
- Eligible?
- —
Personal DTI + credit; lowest rate.
DSCR
20% down · 8.5% · 30yr
- Down + closing
- —
- Monthly P&I
- —
- Monthly cashflow
- —
- DSCR
- —
- Eligible?
- —
No personal income docs; deal must DSCR.
Hard money
10% down · 12.0% · 12mo
- Down + closing
- —
- Monthly P&I
- —
- Monthly cashflow
- —
- DSCR
- —
- Eligible?
- —
Short-term bridge; refi at stabilization.
Rent comps 7 comps
| Address | Beds | Baths | Sqft | Rent | $/sqft | DOM | Units | Dist |
|---|---|---|---|---|---|---|---|---|
| 909 Jefferson Ave Cleveland, TX | 3.0 | 2.0 | 1600 | $1,870 | $1.17 | 1d | 1 | 0.05mi |
| 700 Lyle West Ave Cleveland, TX | 3.0 | 2.0 | 1080 | $1,195 | $1.11 | 1d | 1 | 0.18mi |
| 201 Pine Bend Ct Cleveland, TX | 3.0 | 1.0 | 1040 | $1,200 | $1.15 | 43d | 1 | 0.64mi |
| 511 S Roosevelt Ave Cleveland, TX | 3.0 | 1.0 | 960 | $1,600 | $1.67 | 43d | 1 | 0.76mi |
| 309 Johnson ST Unit J Cleveland, TX | 4.0 | 1.0 | 1346 | $1,350 | $1.00 | 7d | 1 | 0.85mi |
| 1301 Nevell St Cleveland, TX | 1.0–3.0 | 1.0–2.0 | 827 | $1,255 | $1.52 | 1d | 4 | 1.22mi |
| 1018 Green Ave Cleveland, TX | 4.0 | 2.0 | 1337 | $1,500 | $1.12 | 22d | 1 | 1.33mi |
Listing history 20 events
-
2026-06-18days on market $175,000 Active 92 DOM
-
2026-06-17days on market $175,000 Active 91 DOM
-
2026-06-16days on market $175,000 Active 90 DOM
-
2026-06-15days on market $175,000 Active 89 DOM
-
2026-06-13days on market $175,000 Active 87 DOM
-
2026-06-10price $175,000 Active 83 DOM
-
2026-06-09days on market $185,000 Active 83 DOM
-
2026-06-08days on market $185,000 Active 82 DOM
-
2026-06-07days on market $185,000 Active 81 DOM
-
2026-06-04days on market $185,000 Active 78 DOM
-
2026-06-03days on market $185,000 Active 77 DOM
-
2026-06-02days on market $185,000 Active 76 DOM
-
2026-06-01days on market $185,000 Active 75 DOM
-
2026-05-31days on market $185,000 Active 74 DOM
-
2026-03-23price $185,000 447-char remark
Show marketing remark (447 chars)
Welcome to 813 Jefferson Avenue in Cleveland! This charming craftsman style 1 story new build by Zion Homes features 3 bedrooms and 2 bathrooms. Thoughtfully designed with an open concept layout, the home offers a seamless flow between the living, dining and kitchen areas perfect for everyday living and entertaining. Conveniently located near schools and restaurants. Don't miss this opportunity to see this home, schedule your showing today!
-
2026-03-18$179,999 Active 447-char remark
Show marketing remark (447 chars)
Welcome to 813 Jefferson Avenue in Cleveland! This charming craftsman style 1 story new build by Zion Homes features 3 bedrooms and 2 bathrooms. Thoughtfully designed with an open concept layout, the home offers a seamless flow between the living, dining and kitchen areas perfect for everyday living and entertaining. Conveniently located near schools and restaurants. Don't miss this opportunity to see this home, schedule your showing today!
-
2019-12-17historical
-
2019-11-14price $150,260
-
2019-10-31price $150,821
-
2019-07-27$145,821 Active
ⓘ Source: listings_history table (triggers on properties + properties_extension) + one-shot
backfill from property_details.listing_events for pre-trigger history.
Tax reassessment forecast TX · Resets to sale price
- Current annual tax
- $4,007 · $334/mo
- Projected year-2 tax
- $4,007 · $334/mo
- Expected delta
- $0/yr ($0/mo · 0.0%)
ⓘ Screening estimate from a state-policy table — verify with the county assessor before closing.
Nearby sold comps map
Loading sold comps map…
Walkable amenities ~0.75 mi
Loading nearby amenities…
Taxation est. · year 1
- Rental income
- $20,726
- − Mortgage interest
- −$9,803
- − Property taxes
- −$4,007
- − Insurance
- −$875
- − Repairs & maintenance
- −$1,658
- − Management
- −$1,658
- − Depreciation
- −$5,091
- Taxable loss
- −$2,366
- Est. tax savings @ 24.0%
- +$568
- After-tax cash flow
- $1,047/yr
For passive investors: Depreciation is non-cash, so a rental often shows a tax loss while cash-flowing — sheltering income. Rental losses are passive: they offset passive income freely, and up to $25,000/yr can offset ordinary (W-2) income if you actively participate and your MAGI is under $100k (phasing out to $0 by $150k); unused losses carry forward. On sale, claimed depreciation is recaptured at up to 25%, and gains may owe capital-gains tax (a 1031 exchange can defer both). Figures are a year-1 estimate at your 24.0% rate — not tax advice; consult a CPA.
Condition & rehab AI · 12 photos
This charming craftsman-style single-family home is in excellent condition with a good condition score of 80. It features an open concept layout, modern kitchen, and two bathrooms. The home is located in a desirable neighborhood and is ready for immediate occupancy.
Value-add opportunities
- Both Painting the exterior and interior walls — Fresh paint can enhance curb appeal and interior aesthetics.
- Both Landscaping the front yard — A well-maintained front yard can improve curb appeal and attract potential buyers/tenants.
- Both Adding smart home features — Smart home features can increase the home's value and appeal to tech-savvy buyers/tenants.
- Both Upgrading the kitchen appliances — Modern appliances can make the kitchen more functional and appealing to potential buyers/tenants.
Renovation cost estimate screening
Value-add ROI direction
- Both Painting the exterior and interior walls — Fresh paint can enhance curb appeal and interior aesthetics. ↑
- Both Landscaping the front yard — A well-maintained front yard can improve curb appeal and attract potential buyers/tenants. ↑
- Both Adding smart home features — Smart home features can increase the home's value and appeal to tech-savvy buyers/tenants. ↑
- Both Upgrading the kitchen appliances — Modern appliances can make the kitchen more functional and appealing to potential buyers/tenants. ↑
ⓘ Cost ranges are severity-bucket heuristics (US national rule-of-thumb). Get contractor quotes + a written scope before underwriting a rehab budget.
Schools (NCES district)
- District
- Cleveland ISD
- NCES district ID
- 4814370
- Math proficiency
- 24% ▼ -13.00%
- Reading proficiency
- 25% ▼ -4.00%
- Median HH income
- $39,173
- Composite
- 20.61/100
- National rank
- #8549
- State rank
- #723 of 826 in TX
Livability — Cleveland
- Score
- 61/100
- State rank
- #1013
- US rank
- #17943
Category grades
Schools grade is shown separately in the Schools card above.
Census & demographics
- Census place
- Cleveland, TX
- County
- Liberty County · 82,189 people
- City population
- 82,189
- Metro
- Houston-The Woodlands-Sugar Land, TX
- Population (ZIP)
- 42,685
- Household income
- $62,219
- Rent vs Own
- Severe rent burden
- 437.0
Population outlook (Liberty County) Hauer SSP2
- Today (2025)
- 87,956 people
- By 2030
- 92,161 · +4.8%
- By 2040
- 100,784 · +14.6%
- By 2050
- 109,471 · +24.5%
- By 2075
- 133,470 · +51.7%
- By 2100
- 147,372 · +67.6%
Race, ethnicity, and origin ACS 2023
- Neighborhood character
- Diverse neighborhood (Simpson 0.57)
- Race & ethnicity
- Hispanic / Latino 54% White 36% Two or more races 18% Black 8% Native American 2%
- Hispanic origin (detail)
- Mexican 42%
- Common ancestry
- Lithuanian 2% Serbian 1% Slovak 0%
- Foreign-born
- 22% · Canada
- Languages at home
- 51% English-only · Spanish 48%
Political lean MEDSL · Liberty
- 2024 margin
- Solid R (+61.6) · D 19.0% · R 80.6%
- 2008→2024 swing
- -17.9pp toward R · 2008: -43.7pp · 2024: -61.6pp
- All cycles
- 2024: R+61.6 2020: R+59.7 2016: R+58.0 2012: R+53.3 2008: R+43.7
Not yet ingested
- Civics
- —
Market trends
- HPI YoY
- ▼ -12.39%
- Current HPI
- 224.9222
- Rent YoY
- ▲ 4.00%
- Metro
- Houston-The Woodlands-Sugar Land, TX
- State GDP YoY
- ▲ 3.95%
- F500 in state
- 110
Industry mix (Fortune 500 HQ in TX)
| Industry | F500 HQs | Revenue |
|---|---|---|
| Energy | 16 | $1,198B |
|
||
| Technology | 5 | $198B |
|
||
| Engineering / Construction | 4 | $72B |
|
||
| Energy Services | 3 | $60B |
|
||
| Utilities | 3 | $41B |
|
||
| Healthcare | 2 | $330B |
|
||
Price history
+26.9% since first listed6 events — show timeline
- 2026-03-23 Price Changed $185,000 HARMLS
- 2026-03-18 Listed $179,999 HARMLS
- 2019-12-17 Listing Removed — HARMLS
- 2019-11-14 Price Changed $150,260 HARMLS
- 2019-10-31 Price Changed $150,821 HARMLS
- 2019-07-27 Listed $145,821 HARMLS
Property tax history
+4.4%/yrLatest (2025): $4,007 · +4.4% YoY. Source: county tax records.
Cash-flow waterfall
monthlySold comps — $/sqft
last 12 mo · ≤1 miLoading sold comps…