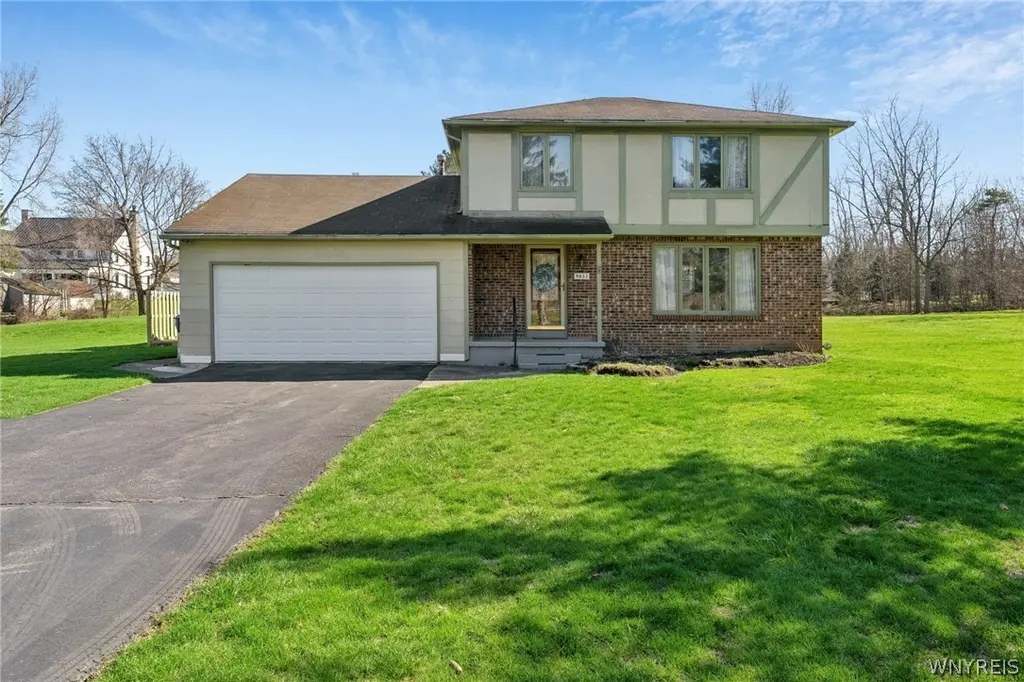
9033 Greiner Rd · Harris Hill, NY
Flood risk 8/10 · Major
- FEMA flood zone
- X (unshaded)
- Chance of flooding over 30 yrs
- 0.99%
- Est. flood insurance / yr
- $473 – $860
Fire risk 1/10 · Minimal
- Est. fire insurance / yr
- $691 – $1,283
Heat risk 2/10 · Minimal
- Hot days now (above 94°F)
- 7 days/yr
- Hot days in 30 yrs
- 15 days/yr
Wind risk 1/10 · Minimal
- Chance of severe wind over 30 yrs
- —
Air-quality risk 2/10 · Minimal
- Unhealthy air days now
- 2 days/yr
- Unhealthy air days in 30 yrs
- 2 days/yr
Risk factors via First Street. Map © Google.
Why this score? — see what drove the F grade
The composite is a weighted blend of 9 inputs, each scored 0–100. Each bar is that input's sub-score; the figure is the points it added to the 100-point composite (weight × sub-score).
- ARV discount +15.0/15.0
- Schools +6.5/10.0
- Cash flow +4.0/30.0
- Livability +3.6/5.0
- Rent growth +2.5/5.0
- Condition / age +2.5/5.0
- 1% rule +0.0/10.0
- DSCR +0.0/10.0
- Appreciation +0.0/10.0
$339,900
🖨 Deal sheet 📄 Offer letter ✓ Due diligence
Listing remarks
Set back from the road on a spacious 0.63-acre lot in Clarence, NY, this exceptionally well-maintained two-story single-family 3 bed 1.5 bath home offers privacy, space, and a bright, open feel throughout. A turnaround driveway and attached two-car garage provide convenience, while the expansive yard creates a peaceful setting with flexibility to add fencing if desired. Inside, you’ll find abundant natural light from an abundance of vinyl & some oversized windows and hardwood floors in immaculate condition. The living room features a large front window, and the open-concept kitchen includes plenty of cabinet space, many with pull out shelves, an eat-in counter bar and flows seam
Key facts
- Turnaround driveway
- Attached garage
- Expansive yard
Tags
Property features AI
Exterior
- Parking: Attached garage with garage door opener; Driveway; 2 garage spaces
- Utilities: High-speed internet available; Public water connected; Septic tank sewer; Circuit breaker electric
- Home design: Two-story house; Resale property; Irregular, rural lot with main thoroughfare frontage
- Construction: Brick, wood siding, and pre-cast concrete construction
- Exterior features: Blacktop driveway; Deck; Shed(s)/storage
Interior
- Kitchen: Dishwasher; Gas oven; Gas range; Refrigerator; Pantry; Granite and solid surface counters; Eat-in kitchen
- Bedrooms: Total rooms include multiple living spaces (Great Room, Living Room, Sitting Room, Sunroom, Bonus Room, Entry Foyer, Family Room, Florida Room) — bedroom count not specified
- Flooring: Carpet; Hardwood; Ceramic tile; Tile; Varies
- Bathrooms: 1 full bathroom; 1 half bathroom; One main-level bathroom
- Heating & cooling: Gas forced-air heating
- Interior features: Cathedral ceilings; Separate/formal dining room; Entrance foyer; Eat-in kitchen; Separate/formal living room; Great room; Pantry; Granite counters; Solid surface counters; Skylights; Natural woodwork; Bath in primary bedroom; Thermal windows
- Laundry & utility: Gas water heater
Neighborhood map
What this means for you Summary
Snapshot
- This is a 3-bed/1.5-bath single-family listed at $340k.
Deal economics
- At list price, monthly cash flow is $-1k ($-12k/yr) — negative.
- To cash-flow at today's rent, offer at most $161k (52.6% below list).
- To meet the 1% rule (rent ≥ 1% of price), the offer needs to be $172k (49.5% below list).
- Recommended offer: $161k (52.6% below list) — sets the bar for cash-flow.
Location & tenants
- Location reads 72/100 on livability (#345 in NY) — a middle-class / working-renter tenant base. Strengths: employment A+, housing A+, health & safety A-; Watch: amenities F, commute F, cost of living F.
- Clarence Central School District (suburban): math 70% / reading 76% proficiency, ranked #94 of 590 in NY (top 16%) — strong family-tenant draw, lease renewals of 3-5y typical; only 7% free/reduced lunch — higher-income household profile.
- Market conditions: 77 active listings in the ZIP; 1,244 units permitted in Erie County in 2024 (563 in 5+ unit buildings).
Forward outlook
- Local home prices are declining (-3.0%/yr); year-one equity from $2k of loan paydown is wiped out by about $10k of value loss. Plan a longer hold.
Negotiation context
- Only 13 days on market — expect competitive offers; lowballing is unlikely to land.
- Current owner paid $155k; list at $340k implies a 119% gain — meaningful room to come down on a strong offer.
Risks & watch-outs
- Watch-outs: flood insurance adds $56/mo.
- Climate carrying-cost: severe flood risk — expect insurance premiums to compound above CPI over the hold.
Questions for the listing agent
- What do current leases actually rent for vs. the listed asking? Can we see a recent rent roll and the last 12 months of T-12 income?
- Built in 1975 — when were the roof, HVAC, electrical panel, plumbing, and water heater last replaced?
- What's the actual annual flood-insurance premium (NFIP or private), and is the property in a SFHA with mandatory coverage?
- Is there a deadline driving the sale (1031 exchange, divorce, estate, relocation)? That informs how much negotiation room exists.
- Schools are B-rated — typically a magnet for longer-tenancy family renters. What's the average tenant stay here, and is there a school-zone premium baked into asking?
- The area grade is low — what's the realistic commute time and amenity access for the typical tenant pool here? Any planned neighborhood developments (good or bad) we should know about?
- What's the average days-on-market for RENTAL listings here right now (not sales)? A rising rental-DOM trend means longer vacancies and softer asking-rent achievability than the comps imply.
- What's the recent tenant-quality profile in this submarket — average credit score on applications, eviction rate, late-payment / NSF rate, and stable-employment percentage? A property-management company in the area should have these aggregated.
- How much new for-sale + rental construction is in the pipeline within 1–3 miles? Heavy new supply typically softens prices + rents 12–24 months out; constrained supply supports both.
Investment metrics
- 1% rule
- 0.50% ✗
- Cap rate
- 2.91%
- Cash-on-cash
- -12.07%
- DSCR
- 0.46
- GRM
- 16.5
CMA / ARV
- ARV (on-the-fly)
- $451,164
- Comps found
- 3
Show comp detail 3 sales within ~0.75 mi
| Address | Dist | Beds/Ba | Sqft | Sold | Price | $/sf | Match |
|---|---|---|---|---|---|---|---|
| 9033 Greiner Rd | 0.00mi | 3/1.5 | 1,779 (+13%) | 0mo | $377,000 | $212 | 78 |
| 9165 Greiner Rd | 0.31mi | 3/2.0 | 1,453 (-8%) | 1mo | $506,000 | $348 | 70 |
| 5125 Brookfield Ln | 0.20mi | 3/2.0 | 1,744 (+11%) | 12mo | $501,000 | $287 | 60 |
Match score weights: distance 35% · size 25% · config 20% · recency 20%. Top-matched comps best support the ARV.
Projected returns pro-forma
-3.0% appreciation · 3.0% rent growth · sell at horizon
- IRR
- -40.1%
- Equity multiple
- -0.26×
- Total profit
- $-119,540
- Equity at exit
- $50,680
- IRR
- -63.9%
- Equity multiple
- -0.96×
- Total profit
- $-186,994
- Equity at exit
- $29,388
Cash invested: $95,172 (down + closing). Projections, not guarantees.
Landlord ↔ Tenant lean methodology
- Overall (STATE)
- 15 Strongly Tenant-Friendly
- State New York
- 15 Strongly Tenant-Friendly · D+10
- County
- — inherits STATE
- City
- — inherits STATE
ZIP-level market 14031
- Home prices YoY
- -16.4%
- Active inventory
- 77
- Price-to-rent
- 16.5×
Monthly cashflow live
- Estimated rent
- $1,715 medium interval (Pro) →
- Mortgage (P&I)
- −$1,782
- Tax from tax record
- −$388 /mo · $4,657/yr
- Insurance
- −$142
- Flood insurance flood zone
- −$56 /mo · $666/yr
- HOA
- −$0
- Vacancy / Maint / Mgmt
- −$360
- Net cashflow
- $-1,013
Break-even live
UW: 25.0% down · 7.5% · 30yr · 1.5% tax · 5.0% vac · 8.0% maint · 8.0% mgmt
Financing live
Cash to close
- Down payment
- $84,975
- Closing costs
- $10,197
- Reserves months
- —
- Total cash needed
- —
Loan-product check · same deal, 3 products live
Conventional
25% down · 7.5% · 30yr
- Down + closing
- —
- Monthly P&I
- —
- Monthly cashflow
- —
- DSCR
- —
- Eligible?
- —
Personal DTI + credit; lowest rate.
DSCR
20% down · 8.5% · 30yr
- Down + closing
- —
- Monthly P&I
- —
- Monthly cashflow
- —
- DSCR
- —
- Eligible?
- —
No personal income docs; deal must DSCR.
Hard money
10% down · 12.0% · 12mo
- Down + closing
- —
- Monthly P&I
- —
- Monthly cashflow
- —
- DSCR
- —
- Eligible?
- —
Short-term bridge; refi at stabilization.
Listing history 3 events
-
2026-04-29status Pending
-
2026-04-16$339,900 Active
-
2003-07-25soldstatus $155,000
ⓘ Source: listings_history table (triggers on properties + properties_extension) + one-shot
backfill from property_details.listing_events for pre-trigger history.
Tax reassessment forecast NY · Partial reset (capped growth)
- Current annual tax
- $4,657 · $388/mo
- Projected year-2 tax
- $5,200 · $433/mo
- Expected delta
- +$544/yr (+$45/mo · 11.7%)
ⓘ Screening estimate from a state-policy table — verify with the county assessor before closing.
Climate risk First Street
- Flood 8/10 Severe FEMA zone X (unshaded) · 99% chance over 30 yrs
- Wildfire 1/10 Low
- Heat 2/10 Low 7 d/yr ≥94°F today · 15 d/yr by 30 yrs out
- Wind 1/10 Low
- Air quality 2/10 Low 2 unhealthy d/yr today · 2 by 30 yrs out
Nearby sold comps map
Loading sold comps map…
Walkable amenities ~0.75 mi
Loading nearby amenities…
Taxation est. · year 1
- Rental income
- $20,582
- − Mortgage interest
- −$19,040
- − Property taxes
- −$4,657
- − Insurance
- −$2,366
- − Repairs & maintenance
- −$1,647
- − Management
- −$1,647
- − Depreciation
- −$9,888
- Taxable loss
- −$18,661
- Est. tax savings @ 24.0%
- +$4,479
- After-tax cash flow
- $-7,674/yr
For passive investors: Depreciation is non-cash, so a rental often shows a tax loss while cash-flowing — sheltering income. Rental losses are passive: they offset passive income freely, and up to $25,000/yr can offset ordinary (W-2) income if you actively participate and your MAGI is under $100k (phasing out to $0 by $150k); unused losses carry forward. On sale, claimed depreciation is recaptured at up to 25%, and gains may owe capital-gains tax (a 1031 exchange can defer both). Figures are a year-1 estimate at your 24.0% rate — not tax advice; consult a CPA.
Schools (NCES district)
- District
- Clarence Central School District
- NCES district ID
- 3607590
- Math proficiency
- 70% ▼ -9.00%
- Reading proficiency
- 76% ▲ 2.00%
- Median HH income
- $81,568
- Composite
- 64.85/100
- National rank
- #514
- State rank
- #94 of 590 in NY
Livability — Harris Hill
- Score
- 72/100
- State rank
- #345
- US rank
- #5816
Category grades
Schools grade is shown separately in the Schools card above.
Census & demographics
- Population (ZIP)
- 9,741
Population outlook (Erie County) Hauer SSP2
- Today (2025)
- 933,037 people
- By 2030
- 935,181 · +0.2%
- By 2040
- 928,531 · -0.5%
- By 2050
- 905,725 · -2.9%
- By 2075
- 834,037 · -10.6%
- By 2100
- 708,033 · -24.1%
Race, ethnicity, and origin ACS 2023
- Neighborhood character
- Predominantly White (88%)
- Race & ethnicity
- White 88% Two or more races 6% Hispanic / Latino 3%
- Common ancestry
- Romanian 13% Portuguese 2% Scotch-Irish 2%
- Foreign-born
- 7% · Canada
- Languages at home
- 96% English-only · Spanish 2% Russian/Polish/Slavic 1% Other Indo-European 1%
Political lean MEDSL · Erie
- 2024 margin
- Lean D (+9.7) · D 54.8% · R 45.2%
- 2008→2024 swing
- -7.9pp toward R · 2008: 17.5pp · 2024: 9.7pp
- All cycles
- 2024: D+9.7 2020: D+14.7 2016: D+4.8 2012: D+15.6 2008: D+17.5
Not yet ingested
- Civics
- —
Market trends
- HPI YoY
- ▼ -67.27%
- Current HPI
- 344.136
- Rent YoY
- —
- Metro
- —
- State GDP YoY
- ▲ 2.60%
- F500 in state
- 92
Industry mix (Fortune 500 HQ in NY)
| Industry | F500 HQs | Revenue |
|---|---|---|
| Financial Services | 10 | $950B |
|
||
| Consumer Goods | 9 | $162B |
|
||
| Insurance | 4 | $225B |
|
||
| Telecommunications | 2 | $144B |
|
||
| Pharmaceuticals | 2 | $112B |
|
||
| Media / Entertainment | 2 | $69B |
|
||
Price history
+119.3% since first listed3 events — show timeline
- 2026-04-29 Pending — WNYREIS
- 2026-04-16 Listed $339,900 WNYREIS
- 2003-07-25 Sold (Public Records) $155,000 Public Records
Property tax history
+4.4%/yrLatest (2025): $4,657 · +0.3% YoY. Source: county tax records.
Cash-flow waterfall
monthlySold comps — $/sqft
last 12 mo · ≤1 miLoading sold comps…